
1. Background
Nowadays, much attention has been paid to infection and Pseudomonas aeruginosa is a top three opportunistic pathogen in hospitalized, immunocompromised, and cystic fibrosis patients (1). Infection caused by P. aeruginosa is often life-threatening and difficult to treat because of its primary limited susceptibility to commonly used antimicrobial agents (2). It is necessary for the utilization of alternative antibacterial therapies against P.aeruginosa infections. Synergistic combinations of antibiotics and other antimicrobials may be effective against infections where the development of resistance and/or subsequent failure to monotherapy is prevalent associated with the prevention of the emergence of bacterial resistance (3, 4). Aminoglycosides are broad-spectrum antibiotics of high potency that have been traditionally used for the treatment of serious Gram-negative infections (5) and vital component of antipseudomonal chemotherapy implicated in the treatment of a variety of infections (6). These agents are bactericidal and exhibit synergy with other antimicrobial compounds.
One such preference is the possible therapeutic use of probiotics as an adjunct to chemotherapy (7). Probiotics are dietary supplements containing potentially useful yeasts or bacteria. According to the currently adopted description by food and agriculture organization of the united nations/world health organization (FAO/WHO) in 2001, probiotics are live microorganisms, which when administered in requisite amounts confer a health benefit on the host (4, 8). Supernatant of most Lactobacillus bacteria (LAB) such Lactobacillus casei and L. rahmnosus contains several antimicrobials including organic acids, hydrogen peroxide, aroma components, fatty acid and low-molecular-mass compounds which kill pathogens (9). Strains of Lactobacillus bacteria can produce organic acid through hetero fermentative pathways, and these compounds may interact with cell membranes, induce intracellular acidification and diffuse passively across the membrane and protein denaturation (10). Hydrogen peroxide (H2O2) can act as a precursor to the production of bactericidal free radicals, such as superoxide (O2ˉ) and hydroxyl (OHˉ) radicals, which can damage DNA as well as peroxidation of membrane lipids increases the permeability of the membrane (11).
The therapeutic role of probiotics in the P. aeruginosa (12-14), Staphylococcus aureus (15) and Salmonella (7, 8, 16) infections have been reported. Treatments with combination of probiotics and antibiotic have been reported to be successful in the management of Helicobacter pylori infection (17). A combination therapy by probiotic and antibiotic may provide higher antimicrobial activity and decrease the dose of antibiotic required in addition to replenish the intestinal flora thereby providing benefit to the host and also decrease other antibiotic side effects (18). In the present study, the possible synergistic interactions between the cell-free Lactobacillus supernatant (CFS) and amikacin or gentamicin on their antibacterial potencies against P. aeruginosa were evaluated.
2. Objectives
This study aimed to investigate the antimicrobial effect of CFS from Lactobacillus strains on the growth of P. aeruginosa and evaluate synergistic interactions between CFS and amikacin or gentamicin against P. aeruginosa and also to identify some of the antimicrobial compounds that Lactobacillus strains produce.
3. Materials and Methods
3.1. Bacterial Strains and Growth Conditions
Pseudomonas aeruginosa PTCC 1430, Lactobacillus casei PTCC 1608 and Lactobacillus rahmnosus PTCC 1637 were procured from Iranian Type Culture Collection (PTCC). P.aeruginosa subcultured in nutrient broth (NB) (Merck, Germany) for 24 hours at 37°C. L. casei and L. rahmnosus were grown in De Mann Rogosa Sharpe (MRS) broth (Merck, Germany) for 48 hours at 37°C under anaerobic conditions in a Coy Laboratory anaerobic chamber (19).
3.2. Antibiotic Susceptibility Testing
Qualitative antibacterial susceptibility of the microorganisms was determined according to the standard disk diffusion (Kirby-Bauer) method (20). using the paper disk including (μg/disc): azithromycin (15); ceftriaxone (21); imipenem (10); amikacin (21); chloramphenicol (21); ceftazidim (21); tobramycin (10); gentamycin (10) andciprofloxacin (5) purchased from Mast Co (Liverpool, UK).
Microbial suspensions with 106 colony forming units (CFU/mL) of each Lactobacillus strain in NB were prepared on a De Mann Rogosa Sharpe agar plate. The plates were incubated at 37°C for 48 hours in anaerobic condition and examined for the inhibition zone diameter appearing around each antibiotic disc. A test was carried out thrice for each antibiotic agent . Inhibitory zone diameters were compared with the standards provided by the National Committee for Clinical Laboratory Standards (NCCLS) (19). Antibiotic sensitivity of P. aeruginosa was also determined by the same method using the Muller Hilton agar.
3.3. In Vitro Inhibitory Effect of Cell-Free Supernatants and Antibiotics
3.3.1. Preparation of Cell-Free Supernatant From Lactobacilli Strains
Cell-free supernatant was prepared according to the method Ogunbanwo (22). Lactobacillus was grown in MRS broth (pH 5.7) for 48 hours at 37°C in anaerobic condition. Cell-free supernatant was obtained by centrifuging the culture at 15000 rpm for 15 minutes at 4°C and then filtered through 0.45 μm filters (Millipore, Bedford, MA).
3.3.2. Agar Well Diffusion Assay
Antimicrobial activities of CFS were determined by the agar well diffusion assay. In this method, bacterial inoculum colonies from overnight nutrient agar were used to make suspension of the test organisms to be equivalent to the 0.5 McFarland standards. Wells with a 6-mm diameter were punched in the agar plates and were filled with 100 µL of different concentrations of CFS (10 µL/mL, 50 µL/mL and 100 µL/mL). The plates were then incubated at 37°C for 24 hours and the diameter zones of inhibition were assessed (23). The experiments were repeated three times and the mean values of the diameter of inhibition zone with ± standard deviation were calculated.
3.3.3. Determination of Minimum Inhibitory Concentrations
The minimum inhibitory concentrations (MICs) were determined by micro dilution assay according to the procedures recommended by the Clinical and Laboratory Standards Institute (formerly the National Committee for Clinical Laboratory Standards 2006). Dilutions of the antibiotics (amikacin or gentamicin), ranging from 0.125 - 256 µg/mL in Muller Hinton Broth (MHB) were prepared by incorporating the antibiotic stock solution into the Muller Hinton Broth. Dilutions of the CFS in the range of 0.12-250 µL/mL were also prepared by incorporation of the CFS into Muller Hinton Broth. Each plate includes positive and negative controls (19). Briefly, a bacterial inoculum (100 μL), corresponding to 5 × 10⁵ CFU/mL, was added to 100 μL of serial two-fold dilutions of the antibiotics in the wells of microtiter plates. For negative controls, 100 μL of 256 µg/mL concentration of the antibiotics was added to100 μL MHB in the wells of micro titer plates. Furthermore, for positive controls 100 μL bacterial inoculum was added to 100 μL MHB in the wells of microtiter plates.
The final volume of each well was 200 μL. The plates were incubated at 37°C for 24 hours. The MIC was defined as “the lowest concentration of antibiotic which can inhibit visible growth of microorganism”. Afterwards, 100 μL of liquid from each well without visible growth on to Mueller-Hinton agar (MHA) for determination of MBC was used and incubated at 37°C for 48-72 hours. Finally, the lowest concentration of antimicrobial agent being able to reduced 99.9% of the bacteria was assessed as MBC. Experiments were done in triplicate.
3.3.4. Fractional Inhibitory Concentration Determination and the Interaction Effect of Two Antimicrobial Agents (Antibiotics + Cell Free Supernatant) on Test Bacteria
Drug interactions were assessed using a checkerboard microdilution method. The concentrations of antimicrobial agent were typically ranged from four or five below the expected MIC to twice the anticipated MIC as the 45 degree line in Figure 1 (each square represents one plate). The interactions were assessed using two-fold dilutions of each antimicrobial agent, concentration of MIC point and dilution lower than it for each antimicrobial agent alone. Inocula were prepared spectrophotometrically and further diluted to obtain final concentrations 0.5 × 10⁶ CFU/mL. Each microdilution well included 100 μL of the diluted (two times) drug concentrations of both antimicrobials (antibiotics and CFS) was inoculated with 100 μL of the diluted (two times) inoculum suspension (final volume of each well, 200 μL). The trays were incubated at 37°C, and the results were read at 24 hours visually using an ELISA reader system (statfax-2100, Awareness Technology Inc., USA).
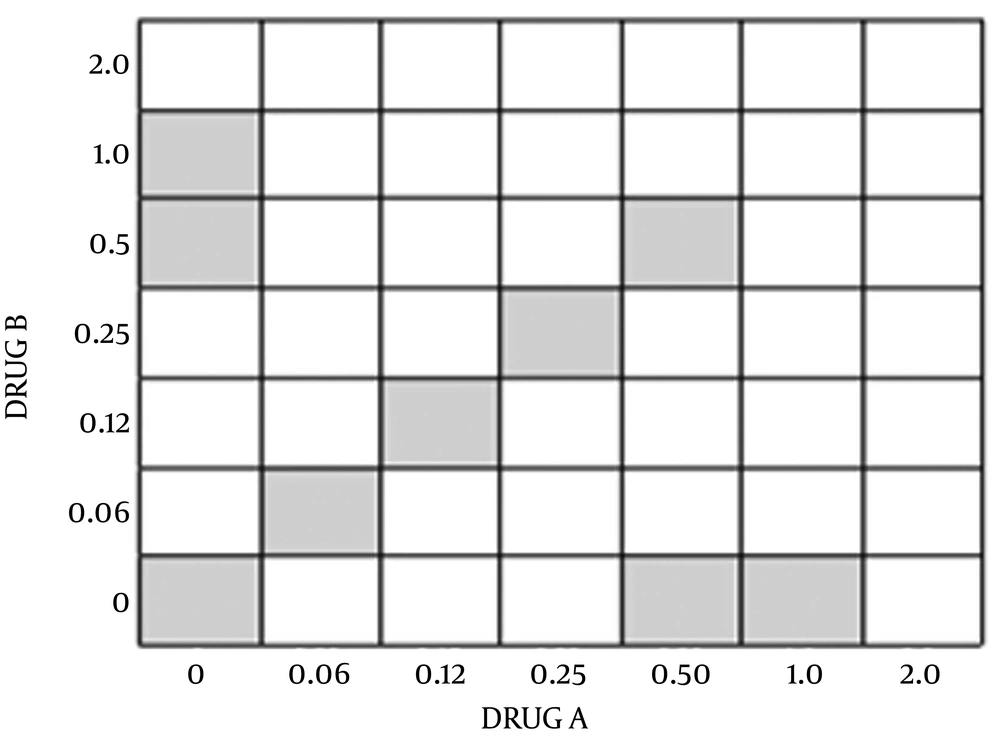
Figure 1.
Minimum inhibitory concentration (MIC) of drugs A and B are considered as 1 µg/mL.
The FIC index was then calculated using the observing equation with summing the separate FICs for each drug present in that well:
Where A is the concentration of drug A in well that is the lowest inhibitory concentration in its row, MIC A is the MIC of the organism to drug A alone, and FIC A is the FIC of drug A. Also, B is the concentration of drug B in a well that is the lowest inhibitory concentration in its column; MICB and FICB are defined in the same fashion for drug A. According to this method, synergism has traditionally been defined as an FIC index of 0.5 or less and additively as a FIC index of 1.0; antagonism has been defined as a FIC index of 2.0. Synergy was further subclassified as marked (FIC ≤ 0.50) and weak (FIC index, between 0.50 and 1.0) (24).
3.4. Analysis of Cell-Free Supernatant From Lactobacillus Strains for Antimicrobial Compounds
Cell-free supernatants of each strain of L. Casei, and L. rhamnosus were prepared according to the method of Ogunbanwo (22). The supernatant was filtered using 0.45 µm Millipore filters and 2 aliquots were stored at 20°C until analyzed for antimicrobial compounds, including lactic acid, acetic acids and hydrogen peroxide (H2O2) (Sigma) using Reversed-Phase high-Performance Liquid Chromatography (RP-HPLC) (25). Standard stock solutions of lactic acid pKa = 3. 086 (5.2 mg/mL), acetic acid (5.4 mg/mL) and H2O2 (35%) were prepared in ultrapure water and stored at 4°C (26). Standard solutions of organic acids and H2O2 were determined by RP-FPLC, using an AKTA purifier system (GE Healthcare) equipped with YMC-Triart C18 (250 × 4.6 mmI.D, S-5 um, 12 nm). The degassed mobile phase of 0.009 M KH2PO4 adjusted by phosphoric acid to pH 2.06.filtered through a 0.45 µm membrane filter was used at a flow rate of 1 mL/minutes. The wavelength of detection was optimized at 210 nm and the sample injection was 50 µL. (25, 27). Moreover, the CFSs from Lactobacillus strains were analyzed by RP-HPLC under the same conditions (25, 28).
3.5. Statistical Analysis
Data were analyzed using Graph Pad Prism version 5 (Graphpad Software In, San Deigo, USA). All data were expressed as Mean ± S.D. Statistical analyses were evaluated by one-way analysis of variance (ANOVA). Significance level for all tests was considered (P < 0. 05).
4. Results
Antibiotic susceptibility pattern of the tested microorganisms was shown that P. aeruginosa was sensitive to amikacin and gentamicin, while L. casei and L. rhamnosus were resistance to the amikacin and gentamicin (Table 1). The antimicrobial activities of CFS from Lactobacillus strains in different concentration were determined using the agar well diffusion assay summarized in Table 2Figure 2.
Table 1.
Antibiotic Susceptibility Pattern of Test Lactobacillus Strains Including Lactobacillus rahmnosus, and Lactobacillus casei, and Standard Strain of Pseudomonas aeruginosa as Determined by the Disc-Diffusion Technique a
| Antibiotics | Concentration, ug/disc | Test Lactobacillus Strains | P. aeruginosa PTCC 1430 | |
|---|---|---|---|---|
| L. casei PTCC 1608 | L. rahmnosus PTCC 1637 | |||
| Azithromycin | 15 | S | S | R |
| Ciprofloxacin | 5 | S | S | S |
| Gentamicin | 10 | R | R | S |
| Ceftazidim | 30 | S | R | S |
| Ceftriaxone | 30 | S | S | S |
| Amikacin | 30 | R | R | S |
| Tobramycin | 10 | R | S | S |
| Chloramphenicol | 30 | S | S | R |
| Imipenem | 10 | R | R | S |
a Abbreviations: R, resistant;S, sensitive.
Table 2.
| Concentrations of CFS, μL/mL | 10 | 50 | 100 | P Value |
|---|---|---|---|---|
| L. casei PTCC 1608 | 6 c | 14 ± 0.70 | 20.33 ± 0.57 | 0.0003 |
| L. rahmnosus PTCC 1637 | 6 | 12.33 ± 0.57 | 17.33 ± 0.57 | 0.0003 |
| Blank (MRS medium) | 6 | 6 | 6 | - |
a Abbreviations: CFS, Cell-Free Supernatant; MRS, De Mann Rogosa Sharpe.
b Data are presented as No. (%).
cZone of inhibition, including the diameter of the well (6 mm); mean value of three independent experiments.
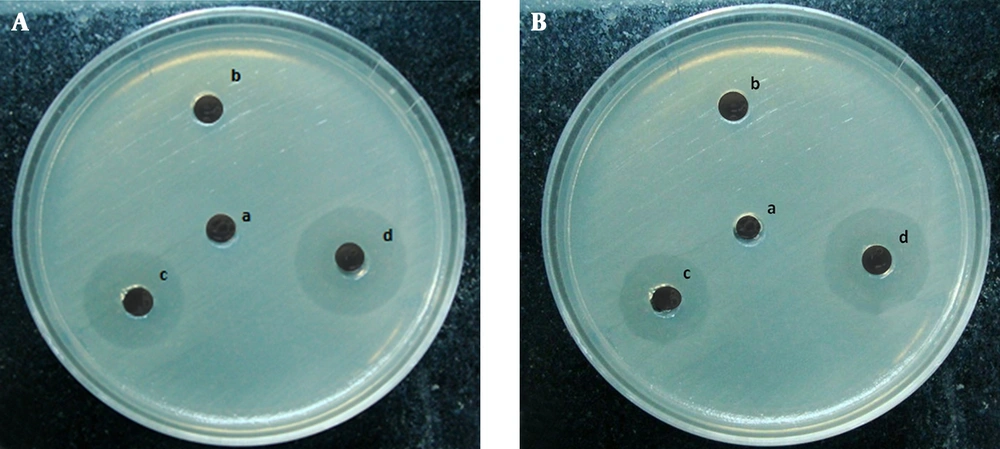
Figure 2.
A, MRS (100 μL/mL), B, CFS (10 μL/mL), C, CFS (50 μL/mL), D, CFS (100 μL/mL).
The activity quantitatively assessed on the basis of the inhibition zone, and their activity index was also calculated along with the minimum inhibitory concentration (MIC). The results of the MIC and minimum bactericidal concentration (MBC) of the CFS and antibiotics were determined by the microdilution method and are shown in Table 3. Also, the FIC value for CFS and antibiotics were shown in Table 4. All antimicrobial combinations demonstrated synergistic actions against P. aeruginosa. Only the combination of CFS from L. casei and gentamicin demonstrated indifference action.
Table 3.
| MIC and MBC | CFS, μL/mL c | Antibiotics (μg/mL) | ||
|---|---|---|---|---|
| L. casei PTCC 1608 | L. rahmnosus PTCC 1637 | Amikacin | Gentamicin | |
| MIC | 62.5 | 62.5 | 8 | 1 |
| MBC | 62.5 | 125 | 16 | 4 |
a All determinations were done in triplicate.
b Abbreviations: CFS, Cell-Free Supernatant; MBC, minimum bactericidal concentration; and MIC, Minimum Inhibitory Concentrations.
c CFS dissolved in Cation Adjusted Muller Hinton Broth.
Table 4.
Fractional Inhibitory Concentration Determination and Interaction Effect of Two Antimicrobial Agents (Antibiotics + Cell Free Supernatant) on the Pseudomonas aeruginosa PTCC 1430 a
| Combination of Two Compounds | MIC A (Alone) (μL/mL) | MIC B (Alone) (μL/mL) | MIC A (in the Presence of B) (μL/mL) | MIC B (in the Presence of A) (μL/mL) | Checkerboard FIC Index | Checkerboard Effect |
|---|---|---|---|---|---|---|
| L.Casei and Gentamicin | 62.5 | 1 | 0.39 | 0.25 | 0.312 | marked synergy |
| L. rhamnosus and Gentamicin | 62.5 | 1 | 0.39 | 0.0625 | 0.124 | marked synergy |
| L. casei and Amikacin | 62.5 | 8 | 0.39 | 0.5 | 0.124 | marked synergy |
| L. rhamnosus and Amikacin | 62.5 | 8 | 0.39 | 4 | 0.56 | weak synergy |
a Abbreviations: FIC, Fractional Inhibitory Concentration; and MIC, Minimum Inhibitory Concentrations.
An antimicrobial compound in the CFS of Lactobacillus was identified by comparison of retention times and the UV absorption spectra with those obtained from the corresponding standards. Peaks of standard solution were observed at (6.00 ± 0.13) minutes for lactic acid, (6.02 ± 0.06) minutes for acetic acid, and (3.06 ± 0.0.6) minutes for H2O2, for an average of 5 injections (Table 5). As a control, the antimicrobial compound profile of the sterile MRS medium was analyzed (Figure 3A). Compared with this control chromatogram, the CFS of L. casei and L.rhamnosus (Figure 3B and 3C) contained the same peaks that corresponding to acetic acid (AA) (6. 23 minutes), lactic acid (LA) (5.73) and H2O2 (3.02 minutes). This study showed that antimicrobial compound is already present in the sterile MRS medium; however, significant changes were observed in the amount of the compound during growth of Lactobacillus strains (P < 0. 05) (Figures 3A,3A,3B and 3C).
Table 5.
Determination of Antimicrobial Compounds in Cell-Free Supernatant From Lactobacillus Strains Using Reversed phase HPLC Method
| CFS From Lactobacillus, Antimicrobial Compound | Retention Time, mL | Peak Start, mL | Peak End, mL | Area/Total Area (Volume (%)) |
|---|---|---|---|---|
| Blank (MRS Medium) | ||||
| H2O2 | 3.02 | 2.65 | 3.19 | 13.09 |
| Lactic acid pKa = 3.086 | 5.79 | 5.57 | 6.06 | 3.68 |
| Acetic acidpKa = 4.76 | 6.24 | 6.06 | 6.66 | 3.80 |
| L. casei PTCC 1608 | ||||
| H2O2 | 3.02 | 2.63 | 3.35 | 16.56 |
| Lactic acid pKa = 3.086 | 5.73 | 5.53 | 6.08 | 12.06 |
| Acetic acidpKa = 4.76 | 6.23 | 6.08 | 6.69 | 3.6 |
| L. rahmnosus PTCC 1637 | ||||
| H2O2 | 3.01 | 2.65 | 3.30 | 20.64 |
| Lactic acid | 5.60 | 5.23 | 5.92 | 12.193 |
| Acetic acid | 6.07 | 5.92 | 6.50 | 3.22 |
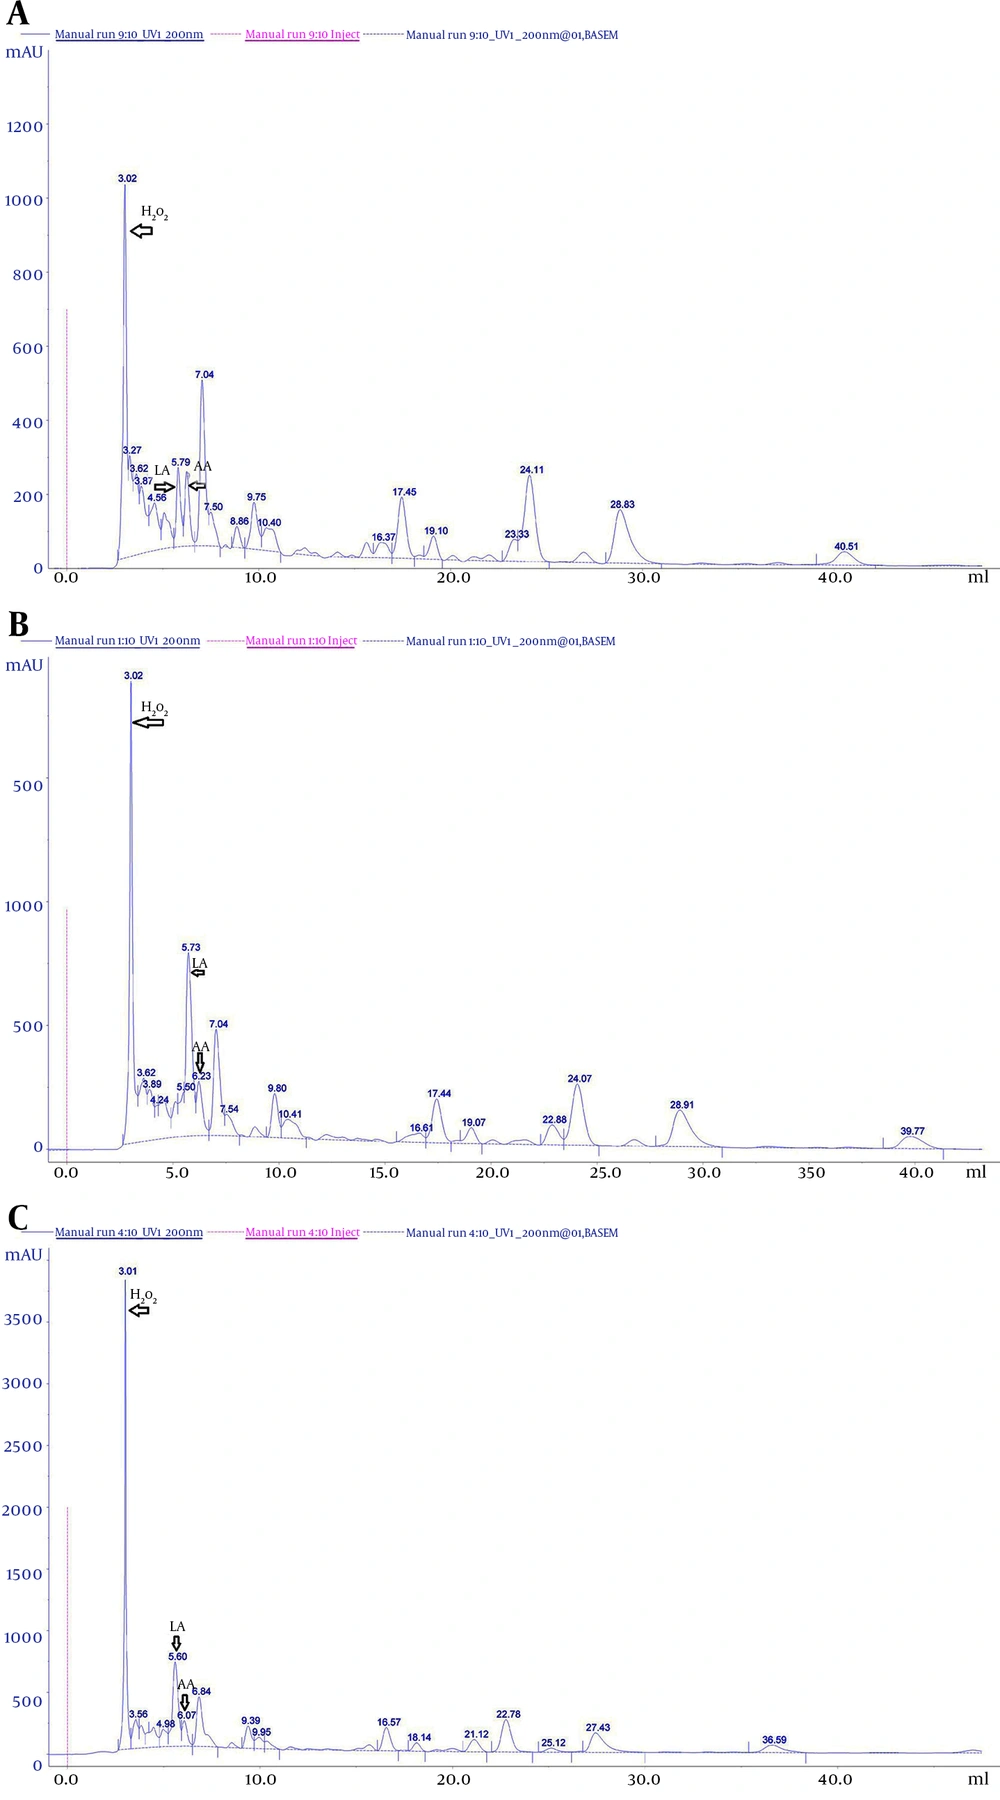
Figure 3.
A, Cell-free supernatant of sterile De Man-Rogosa Sharpe medium; B, Lactobacillus casei PTCC 1608; C, Lactobacillus rahmnosus PTCC 1637. The x-axis refers to the retention time of the antimicrobial compound (in minutes): lactic acid (LA), acetic acid (AA) and hydrogen peroxide (H2O2). Column: ymc-triart C18 (250 x 4.6 mm, HP, particle size 5 µm, flow rate 1 mL/minute) Detection: diode array detector set at 210 nm.
5. Discussion
Pseudomonas aeruginosa infection is one of the most difficult or impossible to eradicate infections and therefore this bacterial infection needs new therapeutic protocol and strategy (12, 29). An antimicrobial combination has been utilized as an effective therapeutic strategy by using of various mechanisms of action (18). Aminoglycosides are known Frontline antibiotics in the treatment of Gram-negative bacterial infections there are potent antibiotics that inhibit protein synthesis by binding to the bacterial 30S ribosomal subunit (30). Since emerging reports showed increased prevalence of resistance against these drugs as observed, it seems necessary to use combinations of aminoglycosides with other antimicrobial agents against P. aeruginosa. A synergistic combination of aminoglycosides (gentamicin, tobramycin and amikacin), fluoroquinolone (ciprofloxacin) and penicillins (carbenicillin) has been used to treat P. aeruginosa infections (30). Moreover, some P. aeruginosa strains have been reported to have resistance to aminoglycoside antibiotics (31, 32).
In the present study, the possible effects of CFS on the bactericidal activities of two antibiotics from aminoglycosides were evaluated. The study of aminoglycoside antibiotics in combination with probiotics might prove the benefit of using a combination with the lower dose of antibiotic alone.
In the present study, we put forward the hypothesis that whether treatment with combination of cell-free supernatant from L. casei and L .rahmnosus with aminoglycoside antibiotics have higher antimicrobial activity against P. aeruginosa or not. Keeping in view the application of probiotics to be used in conjunction with an antibiotic, the first criteria which a Lactobacillus strains needs to fulfill is that it should be resistant to that particular antibiotic to avoid the direct killing of the probiotic strain. After determination of resistance and sensitivity of L. casei and L. rahmnosus and P. aeruginosa to aminoglycosides, the combination of cell-free supernatant from L. casei and L. rahmnosus and aminoglycosides was further tested to evaluate the possible synergistic effect against P. aeruginosa.
Aminoglycosides interfere and affect the bacterial protein synthesis through binding to the ribosomal subunits of the bacterial cell, in addition, an increase of reactive oxygen species in the bacterial cells in response to ciprofloxacin has been shown (33). In previous studies, separation, purification and identification of antimicrobial agents produced by LAB, were conducted by several techniques (17, 34-36) and in this study, the presence of lactic acid, acetic acid and H2O2 in CFS of L. casei and L. rahmnosus was confirmed by RP-HPLC analysis. The organic acid acts by collapsing the electrochemical proton gradient, and H2O2 by peroxidation of membrane lipids thus altering the cell membrane permeability which results in disruption of substrate transport systems (37-39).
Alakomi et al. (40) also found that lactic acid, in addition to its antimicrobial property due to the lowering of the pH, also functions as a membrane-permeabilizing of the Gram-negative bacterial outer membrane and may act as a potentiator of the effects of other antimicrobial substances. In the present study, Synergistic interactions were observed between CFS of L. casei and L. rahmnosus with aminoglycoside antibiotics. These antibacterial mechanisms of H2O2 and aminoglycoside antibiotics to produce reactive oxygen species (ROS) might have acted cooperatively with each other, leads to a higher bactericidal effect of the combination in support of our findings. Goswami et al. (41) have also reported that the involvement of superoxide anion (O2-) and hydrogen peroxide (H2O2) in the antibacterial action of ciprofloxacin was analyzed using superoxide dismutase, catalase, and alkyl hydro peroxide reductase knockout strains of E. coli.
Fractional inhibitory concentration (FIC) index also further substantiated the synergistic effect between the two compounds. We have previously demonstrated that CFS also reduced the MICs of gentamicin and amikacin. This synergistic effect was also confirmed by checkerboard testing (Figure 3). All two aminoglycoside antibiotics had FIC indices less than 0.5, indicating synergetic interaction between CFS and the antibiotic. Probiotics for the prevention and treatment of a wide variety of diseases is supported. Given the strong evidence that the clinical efficacy of probiotics and their increasing use in the treatment of diseases, a thorough understanding of their risks and benefits is imperative (42, 43). There are some theoretical adverse risks that are discussed with respect to the use of probiotics in humans (42, 43). These theoretical risks include the potential for transmigration and the fact that colonization with probiotics may have a negative impact on gastrointestinal physiology and function, including metabolic and physiologic effects (44, 45).
Some of studies have shown that a number of probiotics that have been identified as the cause bacteremia or endocarditis include: L. plantarum, L. rahmnosus, L. casei, L. salivarius, L. paracasei, and L. acidophilus (46, 47).
The most common side effects of Lactobacillus are found in patients with “short bowel syndrome” (or, sometimes, short gut syndrome) (47, 48). These side effects have been seen in a patient who had HIV infection and Hodgkin disease (49) and infection after a bone-marrow transplant (50). The presence of transferable antibiotic resistance genes in probiotics and transfer these genes via horizontal gene transfer as a major area of concern has been the potential for antibiotic-resistance transfer in the gastrointestinal tract that might take place between probiotics and a less innocuous member of the gut microbial community (51, 52).