
1. Background
The development of drug delivery systems has been improved the therapeutic and toxic properties of existing drugs (1). In the past few years, engineered nanoparticles have been investigated for many applications due to the enhanced material properties that result from a reduction in particle dimensions (2). Microemulsion (ME) method is a very versatile technique that enables the preparation of diverse nano-materials on their own or in combination with other techniques (3, 4). The MEs are clear, stable, isotropic mixtures of oil, water, and surfactant, frequently in combination with a co-surfactant. These systems are currently of interest to the pharmaceutical scientist because of their considerable potential to act as drug delivery vehicles by incorporating into a wide range of drug molecules (5).
The MEs have been shown several advantages for drug delivery such as ease of preparation, increasing drug solubility, controlling drug delivery rate, perfect stability, and improving bioavailability of hydrophilic and lipophilic drugs through different delivery routes (6).
Lithium salts were first used to treat gout. It was noted in the 1880s that lithium was somewhat effective in the treatment of depression and in the 1950s, lithium was seen to improve the symptoms of bipolar disease. Despite extensive researches, the underlying mechanisms of its therapeutic actions have not been fully elucidated; however, this is probably related to its effects on other electrolytes such as sodium, potassium, magnesium, and calcium (7, 8).
Today lithium carbonate (LC) is widely used in the treatment and prevention of manic-depressive and bipolar disorders. However, this medication has a low therapeutic index and therefore, many attendant side effects (9-11). A number of clinical studies showed that prolonged treatment with therapeutic levels of LC has a toxic effect on some patients, causing acne form eruptions, sinus node dysfunction, hyperparathyroidism, hypothyroidism, thyrotoxicosis, renal toxicity, and diabetes insipidus (12, 13). Furthermore, acute LC intoxication affects predominantly the central nervous system and the renal system and is potentially lethal (11).
2. Objectives
The goal of the present study was to evaluate potential hepatotoxic and nephrotoxic effects of oral administration of LC microemulsion (LCME) in mice model.
3. Materials and Methods
3.1. Chemicals
The LC powder was purchased from Daroupakhsh company (Iran). Tween 80 and propylene glycol (PG) used for this experiment were obtained from Merck Company, Germany. Sesame oil was obtained from Sabz Kooh, Iran. All chemicals and solvents used in this study were of analytical grade and obtained through commercial sources.
3.2. Animals
Male Swiss albino mice (age, 6 - 8 weeks old; weight, 25 - 30 g), were obtained from the animal house of Jundishapur University of Medical Sciences, Ahvaz, Iran. Mice were maintained in 12/12-hour light/dark cycles and had access to regular chow food and drinking water ad libitum. Animal were acclimated to the environment for a minimum of one week prior to the experiment. All experimental procedures were conducted according to the ethical codes and protocols approved by the Committee of Animal Experimentation of Ahvaz Jundishapur University of Medical Sciences, Iran (Ref. No. B-9333).
3.3. Microemulsion Preparation Method
To examine concentration area of components for the existing boundary of ME dots, pseudo-ternary phase diagrams were constructed using the water titration method. Phase diagram was prepared with the 3:1 weight ratios of Tween 80 Propylene glycol. Oil phase (Sesame Oil) and the surfactant/surfactant mixture were then mixed at the weight ratios of 1:9, 2:8, 3:7, 4:6, 5:5, 6:4, 7:3, 8:2, and 9:1. These mixtures were diluted drop-wise with double distilled water, under moderate agitation. The samples were classified as MEs when they appeared as clear liquids. The components of the convenient formulations are 2.43% oil, 66.55% surfactant/co-surfactant, 31.02% water, and 0.5%, 1%, and 2% of LC, respectively. LC was added to the mixtures of oil and surfactant/co-surfactant and then an appropriate amount of distilled water was added to the mixture drop by drop and the MEs containing LC were obtained by stirring the mixtures at ambient temperature (14).
The stability of MEs was assessed regarding the temperature stability and centrifugation. The LCME were kept in different temperature (4°C, 25°C, and 37°C) and observed for flocculation, precipitation, and phase separation. Moreover, MEs were centrifuged by high-speed centrifuge (MPV-350R, Poland) at 10000 rpm for 30 minute at 25°C and were evaluated for any change in their homogeneity. Finally, the ME with the highest stability and better mean droplet size was selected and used in the experiments (15).
3.3.1. Viscosity Measurement
The viscosities of MEs were measured at 25°C with a Brookfield viscometer (DV-II + Pro Brookfield,) using spindle No. 34 with a shear rate of 100 rpm (14).
3.3.2. Particle Size Determination
The mean droplet size of MEs was determined by Scatter Scope 1 Quidix (South Korea) at 25°C (15).
3.3.3. The pH Measurement
The pH values of the MEs were obtained by pH-meter (Mettler Toledo Seven Easy, Switzerland) at 25°C.
3.4. Experimental Design
Animals were randomly allocated to eight groups of 10 mice to receive assigned treatments orally for ten days. Group 1, as negative control group, received 0.9% saline; group 2 received ME without drug as blank group; groups 3 to 5 received LC solution in doses of 50, 100, and 200 mg/kg, respectively. Groups 6 to 8 received LCME through oral gavage in doses of 50, 100, and 200 mg/kg, respectively. Then on the day 11, 24 hours after the last administration, animals were killed. Blood was withdrawn by cardiac puncture to determine serum glutamate pyruvate transaminase (SGPT), glutamate oxaloacetate transaminase (SGOT), alkaline phosphatase (ALP), blood urea nitrogen (BUN), and creatinine (Cr) levels. Liver and kidney were removed for histopathologic examination.
3.5. Statistical Analysis
The collected data were analyzed using SPSS 18.0 (SPSS Inc, Chicago Illinois, the United States). All results were expressed as the mean ± SD. The data obtained by one-way ANOVA followed by Tukey’s post hoc test. The level of significance was set at P < 0.05.
4. Results
4.1. Microemulsion Results
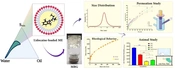
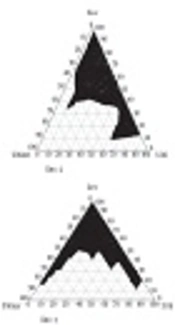
The components of suitable formulation were as follows: Oil, 2.43%; surfactant/co-surfactant, 66.55%; and water, 31.02% (Figure 1). The MEs formulations had the mean droplet size of 34.5 ± 1.2, 6.32 ± 0.7, and 22.1 ± 0.09 nm for 0.5%, 1%, and 2% solutions, respectively. The ME formulations had the mean viscosity of 88.6 ± 4.5 cps and mean pH of 5.7 ± 0.1.
4.2. Biochemical Results
The effects of treatment with different doses of LC and LCME on biochemical parameters of liver and kidney are shown in Table 1. Nephrotoxicity and renal damages is usually associated with increased Cr and BUN levels. Data showed that, there was no difference in the level of Cr between the control group and microemulsion base group. Groups 3 through 8, which were treated with LC and LCME, showed increase in the level of Cr in all doses.
Administration of LC and LCME in all doses resulted a significant increase in the levels of BUN and Serum activity of SGOT and SGPT in comparison to normal saline group (P < 0.05). Serum activity of ALP, SGOT, and SGPT and levels of BUN and Cr in ME base group were greater than those in normal saline group were. However, this difference was not significant.
4.3. Results of Histopathologic Examination
The hepatotoxic and nephrotoxic effect of the LCME was evaluated by the histopathologic examination of the kidney and liver. The histopathologic study of liver in the negative control group with normal saline showed a normal hepatic architecture with distinct hepatic cells, sinusoidal spaces, and a central vein (Figure 2A). The ME base-treated group exhibited ballooning degeneration and hepatocyte swelling (Figure 2B). In LC-treated group (50 mg/kg), cell swelling, several foci of coagulation necrosis, and different stages of necrotic cell nucleus were observed (Figure 2C). Treatment with doses of 100 and 200 mg/kg of LC showed cell swelling with focal coagulation necrosis of hepatocytes (Figure 2D, 2E). LCM-treated group (50 mg/kg) showed cell swelling in the hepatocytes with greater intensity and multiple foci of coagulation necrosis (Figure 2F). The LCM-treated group (100 mg/kg) showed cell swelling with high intensity in hepatocytes (Figure 2G). Cell swelling and necrosis were observed in LCM-treated group (200 mg/kg) (Figure 2H). The histopathologic study of kidney in the negative control group and the second group with only ME base showed a normal architecture. In these groups, the structure of glomuses was clear, capsular space were small, the structure of epithelial cells in proximal convoluted tubules and distal convoluted tubules was normal, and the boundaries of the visceral layer and parietal layer of renal capsule were clear (Figure 3A, 3B). In LC-treated group (50 mg/kg), swelling in the living cells of the proximal tubular and coagulation necrosis were seen (Figure 3C). In LC-treated group (100 mg/kg), cell swelling, associated with protein deposits in the renal tubular lumen, was observed (Figure 3D). In LC-treated group (200 mg/kg), urinary protein, deposits, and glomerulonephritis were seen in the lumen of the tube (Figure 3E). In LCM-treated group (50 mg/kg), cell swelling and coagulation necrosis of proximal tubular cells were observed (Figure 3F). Groups treated with 100 and 200 mg/kg of LCME showed glomerulonephritis and urinary protein deposits (Figure 3G, 3H).

Figure 1.
Dark Area Shows Microemulsion Zone

Figure 2.
Liver sections stained with Hematoxylin and Eosin, magnification × 100. A, Normal saline-treated group; B, microemulsion base-treated group; C, D, and E, respectively showing groups treated with 50, 100, and 200 mg/kg of lithium carbonate; F, G, and H, respectively showing groups treated with 50, 100, and 200 mg/kg of lithium carbonate microemulsion.

Figure 3.
Kidney sections stained with Hematoxylin and Eosin, magnification × 100. A, Normal saline-treated group; B, microemulsion base-treated group; C, D, and E, respectively showing groups treated with 50, 100, and 200 mg/kg of lithium carbonate; F, G, and H, respectively showing groups treated with 50, 100, and 200 mg/kg of lithium carbonate microemulsion.
Table 1.
| Groups | SGPT, µkat/L | SGOT, µkat/L | ALP, µkat/L | BUN, mmol/L | Creatinine, µmol/L |
|---|---|---|---|---|---|
| Normal saline | 0.64 ± 0.05 | 1.58 ± 0.13 | 0.86 ± 0.08 | 3.18 ± 0.77 | 37.13 ± 1.77 |
| Base ME | 0.68 ± 0.13 | 1.84 ± 0.14 | 0.95 ± 0.08 | 4.02 ± 0.42 | 38.90 ± 2.65 |
| LC | |||||
| 50 mg/kg | 1.08 ± 0.11 c | 2.15 ± 0.13 c | 1.08 ± 0.07 | 5.88 ± 0.74 c | 41.55 ± 2.65 |
| 100 mg/kg | 1.28 ± 0.12 c, d | 2.51 ± 0.15 c | 1.15 ± 0.07 c | 6.67 ± 0.54 c | 47.54 ± 2.65 c |
| 200 mg/kg | 1.64 ± 0.16 c | 2.82 ± 0.12 c,d | 1.28 ± 0.10 c | 7.16 ± 0.70 c | 53.92 ± 4.42 c |
| LCME | |||||
| 50 mg/kg | 1.39 ± 0.12 c | 2.42 ± 0.10 c | 1.12 ± 0.09 c | 6.25 ± 0.43 c | 45.08 ± 2.65 c |
| 100 mg/kg | 1.64 ± 0.10 c,d | 2.76 ± 0.13 c | 1.20 ± 0.11 c | 6.82 ± 0.64 c | 50.39 ± 4.42 c |
| 200 mg/kg | 1.94 ± 0.14 c | 3.18 ± 0.16 c,d | 1.34 ± 0.08 c | 8.19 ± 0.38 c | 59.23 ± 2.65 c |
a Abbreviations: ALP, alkaline phosphatase; BUN, blood urea nitrogen; LC, lithium carbonate; LCM, lithium carbonate microemulsion; ME, Microemulsion; SGOT, serum glutamate oxaloacetate aminotransferase; and SGPT, serum glutamate pyruvate aminotransferase.
b Data are presented as mean ± SD for n = 10.
c Significant different with the control (P < 0.05).
d Significant different with the corresponding group (P < 0.05).
5. Discussion
Liver is one of the largest organs in human body and the major site for metabolism and excretion. It has a wide range of functions including detoxification, protein synthesis, and production of biochemicals necessary for digestion (16). On the other hand, kidney plays a primary role in the excretion of metabolic wastes and in the regulation of extracellular fluid volume, electrolyte composition, and acid-base balance (17). Toxic effects medications on the liver and kidney are common and expected, and could disrupt any or all of these functions (18). Very small particles have the ability to enter, accumulate within, and damage living organisms. This ability results primarily from their small size, which allows them to penetrate physiologic barriers and travel within the circulatory systems (19). Earlier studies have shown that nano-forms of different particles are more toxic than their micro-counterparts after acute exposure via the oral route (20). Biodistribution experiments have determined liver, kidney, and spleen as the target organs for engineered nanoparticles after absorption by the gastrointestinal tract (20). This study represented the first attempt to delineate the potential hepatotoxic and nephrotoxic effects of LCME formulations following subacute oral administration. The authors evaluated liver and kidney through biochemical parameters and histopathologic examination to detecting organs abnormalities after LCMEuptake by the gastrointestinal tract. The results of present study indicated that LC- and LCME-induced subacute liver and kidney toxicity in mice, shown by an increase in serum liver enzyme activities and kidney biomarker (Table 1). Moreover, the liver and kidney histopathologic findings confirmed the hepatotoxic and nephrotoxic effects of LC and LCME by demonstrating centrilobular necrosis, fatty changes (steatosis), and scattered lymphocytes infiltrate in hepatic parenchyma as well as glomerulonephritis and urinary protein deposition in kidney. Although the intensity of injury on histopathologic examination was slightly more severe in LCME groups (6-8), there was no significant difference between LC and LCME groups when biochemical parameters were considered (Table 1).
Moreover, group 2 that received only ME base (once daily, for 10 days) did not have any significant differences with negative control group based on biochemical parameters (AST, ALT, ALP, BUN and Cr). In addition, only mild inflammation and hepatocyte swelling were seen in histopathologic observation of liver and there were no histopathologic changes in kidney tissue (Figure 2B, 3B).
In similar study, Pouladi et al. investigated a low dose of LCME to improve motor function and rescues striatal pathology and its toxicity in the YAC128 mouse model of Huntington’s disease. They treated mice with 0, 20, or 40 µg/kg of LC in the form of NP03 ME, for ten months. Their findings demonstrated multiple positive effects of low-dose LC in the form of NP03 ME on behavioral and neuropathologic endpoints in an animal model. Additionally, there were no obvious toxic adverse effects associated with long-term LC treatment in YAC128 or WT animals (21).
In the study by Keown et al. the safety and tolerability of the cyclosporine ME (Neoral), the incidence of acute rejection episodes, and graft survival were compared to the conventional cyclosporine formulation (SIM) in patient with renal transplantation. Their finding revealed no difference between two formulations in the safety profile or tolerability, kidney function, and other laboratory parameters throughout the study. They concluded that the pharmacokinetic characteristics of the cyclosporine ME formulation lead to more efficient immunosuppressant after transplantation without any deleterious effect on clinical safety (22).
In conclusion, our results demonstrated that subacute oral administration of different doses of LCME causes slightly more severe signs of toxicity in comparison to LC. Administration of increasing doses of LC and LCME led to increased levels of biochemical parameters and histopathologic changes. Although the intensity of toxicity was higher in LCME, the difference was not significant. Future studies are suggested, particularly for use of LCME in the pharmaceutical product.