
1. Background
Diabetes mellitus is a chronic disease characterized by persistent hyperglycemia. Recently, the prevention of diabetes and its complications, particularly the associated cardiovascular mortality and morbidity, has become a major health problem worldwide (1, 2). Despite the beneficial effects of anti-hyperglycemic drugs and insulin sensitizers, bothersome side effects remain, including hypoglycemia at high doses, a lower oral bioavailability, and inactivation by several enzymes; therefore, the development or discovery of other alternative medications is necessary (3). The use of phytotherapy, in which different parts of plants, such as the leaves, roots, stems, flowers, bark, or their active compounds, are used to prevent and treat diseases, is increasing globally (4). In fact, the use of traditional medicinal plants that produce a hypoglycemic effect has been increasing in all populations. More than 400 traditional plant treatments for diabetes mellitus have been reported, but only a few of these have been investigated for their medical efficacy (5).
Citrullus colocynthis (C. colocynthis), often known as bitter melon, belongs to the Cucurbitaceae family, which grows in Arab countries, Africa, and the Middle East and is used traditionally as an anti-diabetic medication. A perennial plant that grows in desert and arid conditions, its fruit is initially green and then turns yellow as it ripens (6, 7). C. colocynthis contains different chemical compounds; for example, unripe fruit has parahydroxy benzyl ester, and its roots are rich in hentriacontane elaterium; the seeds have methionine, cysteine, oleic, linoleic, linolenic, fiber, potassium, saponins, phosphorus and iron, but the major component is a tetracyclic terpene named cucurbitacin (8, 9), which is the main biochemical composition from the Cucurbitacin family. It is very bitter and chemically classified as a steroid. A study about the biological effects of cucurbitacin found it has therapeutic properties (10). East African natives use seeds of C. colocynthis for skin diseases; moreover, its dried fruit has been used for constipation, edema, bacterial infections, cancer, and diabetes (11). In addition, it was recently reported that C. colocynthis fruit potentially has anti-tumor, anti-bacterial, anti-inflammatory, and anti-diabetic properties (12).
2. Objectives
In this study, we investigated the effects of the hydroalcoholic leaf extract of C. colocynthis on serum biochemical factors and histopathological changes in the pancreas, liver, and kidneys in streptozotocin-induced diabetic rats.
3. Methods
3.1. Plant Collection and Preparation of the Leaf Extract
C. colocynthis were collected from the Illam province west of Iran from August - September 2014. The plant was identified by a medicinal plant and natural product research center. A voucher specimen of the plant was stored in the herbarium of medicinal plants and natural products research center, Ahvaz Jundishapur University of Medical Sciences, Ahvaz, Iran (No. A140740100FP). First, the plant leaves were separated, allowed to dry in the shade, and then fully powdered and soaked for 48 hours in 70% ethanol. Then, the solution was filtered using filter paper. Finally, it was placed in a freezer dryer to collect the crude extract. For the purposes of this experiment, the extract was dissolved in normal saline before gavage every day (13).
3.2. Animals and Treatments
Twenty-four male Wistar rats weighing 150 - 200 g were purchased from the research center and experimental animal house of Ahvaz Jundishapur University of Medical Sciences (Ahvaz, Iran). The rats were individually housed in cages in a room with standard conditions (light-dark photo cycle, 20 - 24°C, 55% humidity) with free access to regular rodent chow and water. All experimental methods were approved by the laboratory animal’s ethical committee of the Ahvaz Jundishapur University of Medical Sciences in Ahvaz, Iran, and followed national guidelines for the care and use of laboratory animals. Experimental diabetes in animals was induced with a single intraperitoneal injection of STZ dissolved in normal saline (60 mg/kg body weight). Each rat in the control groups was injected with the same volume of normal saline. Before the blood glucose test was performed, rats had been fasting (without food but with drinking water) for 12 hours. To collect blood, a tail vein was punctured, and 1 - 2 drops of blood were transferred onto glucose strips for an ACCU-Check glucometer (Roche, Mannheim, Germany). The rats with a blood glucose level ≥ 250 mg/dL were considered diabetic (14). After a week of acclimatization, these animals were randomly divided into four groups, with six rats in each group. All treatments were given orally to experimental rats using a gavage needle as a single dose daily. The rats were treated for 21 days as follows:
Group 1: Healthy control treated with normal saline.
Group 2: Healthy control treated with extract (75 mg/kg body weight).
Group 3: Diabetic control treated with normal saline.
Group 4: Diabetic treated with extract (75 mg/kg body weight).
3.3. Blood Collection and Biochemical Analysis
At the end of the experimental period, the fasted rats were anesthetized with an intraperitoneal injection of ketamine HCl (40 mg/kg) and xylazin (5 mg/kg). The blood samples were collected by puncturing the heart. The concentrations of fasting blood glucose (FBG), total cholesterol (TC), triglycerides (TG), high-density lipoprotein cholesterol (HDL-c), low-density lipoprotein cholesterol (LDL-c), serum albumin, aspartate aminotransferase (AST), alanine amino transaminase (ALT), bilirubin, serum creatinine, and urea were measured by enzymatic colorimetric methods using commercially available kits (Pars Azmoon, Tehran, Iran) and an automatic analyzer (Biotecnica BT-3000 Plus Chemistry Analyzer, Italy).
3.4. Histopathological Examination
Specimens from the pancreas, liver, and kidneys of the animals were collected and immediately fixed in 10% formalin, dehydrated by increasing the concentration of ethanol, and then were embedded in paraffin. The sections of these specimens at 5 μm thickness were stained with hematoxylin and eosin and were assessed by light microscopy for histological changes.
3.5. Statistical Analysis
All statistical analyses were calculated using SPSS version 15.0 software (SPSS, Inc., Chicago IL, USA). Continuous variables are expressed as mean ± SD and were compared using a one-way analysis of variance (ANOVA); the group means of these different parameters were compared by a Tukey post hoc test. Significance was set at P < 0.05.
4. Results
4.1. Blood Glucose and Lipid Profiles
Tables 1 and 2 show the mean values of the fasting blood glucose and also the full-fasted lipid profile concentrations in all groups. No significant difference was observed in the mean blood glucose concentration between health control rats treated with extract and untreated healthy controls. However, in diabetic rats that received the extract, the blood glucose concentration was decreased compared to that in untreated diabetic rats (P < 0.05) (Table 1).
Table 1.
| Group, N = 6 | Blood Glucose, mg/dL | |
|---|---|---|
| Week 0 | Week 3 | |
| HC | 91.06 ± 14.25 | 100.33 ± 11.37 |
| HC + E | 88.29 ± 17.26 | 99.20 ± 8.92 |
| D | 484.21 ± 10.18 | 464.15 ± 11.41 |
| D + E | 390.71 ± 47.74 | 228.05 ± 11.95f |
Abbreviations: HC, healthy control; HC+E, healthy control treated with the extract; D, untreated diabetic; D + E, diabetic treated with the extract.
aValues are presented as mean ± SD.
bn = 6 in each group.
cOne-way analysis of variance (ANOVA) was followed by a Tukey test.
dDiabetics rats treated with the extract were then compared to the results in the untreated diabetic rats.
fp < 0.05.
| Group, N = 6 | Serum Lipid Profiles, mg/dL | |||
|---|---|---|---|---|
| TG | LDL | HDL | TC | |
| HC | 87.05 ± 11.04 | 85.67 ± 8.47 | 47.15 ± 7.53 | 117.40 ± 14.18 |
| HC + E | 78.83 ± 7.54 | 80.17 ± 9.36 | 48.67 ± 6.12 | 91.10 ± 10.45 |
| D | 156.06 ± 11.73 | 160.67 ± 45.61 | 22.33 ± 6.65 | 198.57 ± 15.42 |
| D + E | 118.67 ± 16.69f | 128.83 ± 6.24f | 34.00 ± 11.43f | 152.83 ± 6.61f |
Abbreviations: HC, healthy control; HC + E, healthy control treated with the extract; D, untreated diabetic; and D + E, diabetic treated with the extract.
aValues are presented as mean ± SD.
bn = 6 in each group.
cA one-way ANOVA was followed by a Tukey test.
dDiabetic rats treated with the extract were compared to the other groups.
fP < 0.05.
These results indicated that the serum levels of triglycerides in untreated diabetic rats were significantly increased compared to the other groups; however, in the diabetic rats treated with this extract, the serum triglycerides were significantly decreased compared to that of the controls (P < 0.05). The LDL level in untreated diabetic rats was significantly increased compared to that seen in controls. Also, the LDL level was significantly decreased after 21 days of treatment (P < 0.05) in diabetic rats treated with extract. In diabetic rats treated with the extract, the HDL level was significantly increased compared to that in untreated diabetic rats (P < 0.05). In addition, the serum level of total cholesterol was significantly decreased in diabetic rats treated with extract compared to untreated diabetic rats (P ≤ 0.05) (Table 2).
4.2. Liver and Kidney Biomarkers
Table 3 indicates the mean values of AST and ALT activities and the serum level of bilirubin (total and conjugated) and albumin in all groups. The mean serum activity of AST, ALT, and bilirubin concentration (total and conjugated) in untreated diabetic rats were significantly increased compared to the untreated control rats. However, serum albumin concentration had decreased at the end of the study. AST, ALT activities and serum bilirubin (total and conjugated) concentration in diabetic rats treated with this extract was decreased compared to untreated diabetics (P < 0.05). The serum levels of creatinine and urea in untreated diabetic rats were significantly increased compared to controls (P < 0.05). We also observed a decrease in the serum level of creatinine and urea in diabetic rats treated with theextract compared with untreated diabetic rats (P < 0.05) (Table 4).
| Liver Biomarkers | |||||
|---|---|---|---|---|---|
| Group, N = 6 | AST, IU/L | ALT , IU/L | Albumin, gr/dL | Total Bilirubin, mg/dL | Conjugated Bilirubin, mg/dL |
| HC | 120.67 ± 14.63 | 78.00 ± 11.90 | 6.50 ± 0.99 | 0.317 ± 0.17 | 0.171 ± 0.026 |
| HC+E | 139.17 ± 14.03 | 80.50 ± 13.83 | 8.20± 0.94 | 0.267 ± 0.12 | 0.263 ± 0.040 |
| D | 241.83 ± 18.53 | 173.05 ± 19.29 | 5.16 ± 2.11 | 1.317 ± 0.39 | 0.573 ± 0.051 |
| D+E | 189.00 ± 12.13f | 122.05 ± 5.36f | 5.56 ± 2.03f | 0.717 ± 0.22f | 0.330 ± 0.063f |
Abbreviations: HC, healthy control; HC + E, healthy control treated with the extract; D, untreated diabetic; and D + E, diabetic treated with the extract.
aValues are presented as mean ± SD.
bn = 6 in each group.
cA one-way ANOVA was followed by a Tukey test.
dDiabetic rats treated with the extract were compared to the other groups.
fP < 0.05.
Table 4.
| Kidney Biomarkers, mg/dL | ||
|---|---|---|
| Group, N = 6 | Serum Creatinine | Serum Urea |
| HC | 0.433 ± 0.36 | 23.383 ± 1.69 |
| HC + E | 0.833 ± 0.21 | 21.867 ± 1.27 |
| D | 1.550 ± 0.28 | 33.350 ± 1.64 |
| D + E | 0.567 ± 0.20f | 26.00 ± 1.69f |
Abbreviations: HC, healthy control; HC + E, healthy control treated with the extract; D, untreated diabetic; and D + E, diabetic treated with the extract.
aValues are presented as mean ± SD.
bn = 6 in each group.
cA one-way ANOVA was followed by a Tukey test.
dDiabetic rats treated with the extract were compared to the other groups.
fP < 0.05.
4.3. Histopathological Findings
Histological studies of the pancreas in untreated controls and also in controls treated with the extracts for those questions that normal Langerhans islets and a normal acinus; there were no pathological changes (Figure 1A and B ). Pancreas sections from the untreated diabetic group revealed a reduction in the number of islets of Langerhans cells and also atrophy or destruction of some Langerhans islets (Figure 1C). However, the pancreas of diabetic rats treated with the extract, showed improvement or restoration of normal cellular population, and their islet cells were similar in size to those of the untreated control rats (Figure 1D). An examination of the liver sections from the untreated controls and controls treated with the extract showed a normal liver histological structure with a lobular hepatic structure, hepatic sinusoids, and a central vein; there were no structural changes in the hepatocytes (Figure 2A and B). In the untreated diabetic rats, dramatic changes in the liver structure were observed. There was a loss of the normal concentric arrangement of hepatocytes, a dilatation of the sinusoids, and infiltration of inflammatory cells (Figure 2C); nevertheless diabetic rats treated with the extract showed improvement in their liver histological structure. In this group, the hepatocytes showed some degree of histological regeneration and less sinusoid dilatation in the absence of inflammatory cells (Figure 2D). Histological examination of the normal kidney in untreated healthy controls and healthy controls treated with the extract indicated a normal glomerulus surrounded by normal urinary space and normal renal tubules (Table 3). However, in the untreated diabetic rats, dramatic changes in the kidney structure were observed, including degeneration of the glomeruli, a reduction in the urinary space, and degenerative changes in some renal tubules (Figure 3C). These histological changes, however, improved in the diabetic rats treated with the extract, which demonstrated a normal glomeruli structure, normal urinary space, and a reduction in tubular damage (Figure 3D).
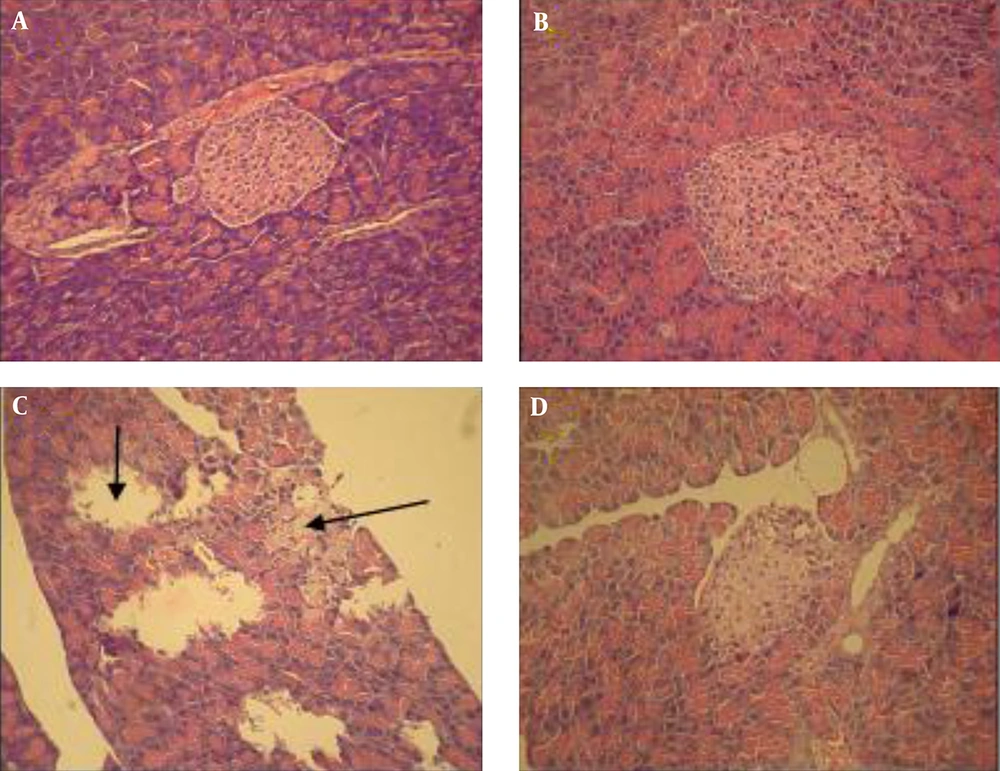
Figure 1.
A, healthy controls; B, healthy controls treated with extract; C, untreated diabetic; D, diabetic treated with the extract. The arrows indicate the destruction of Langerhans islets in untreated diabetic group, but there were no histopathological changes in the other groups (H and E ×300).
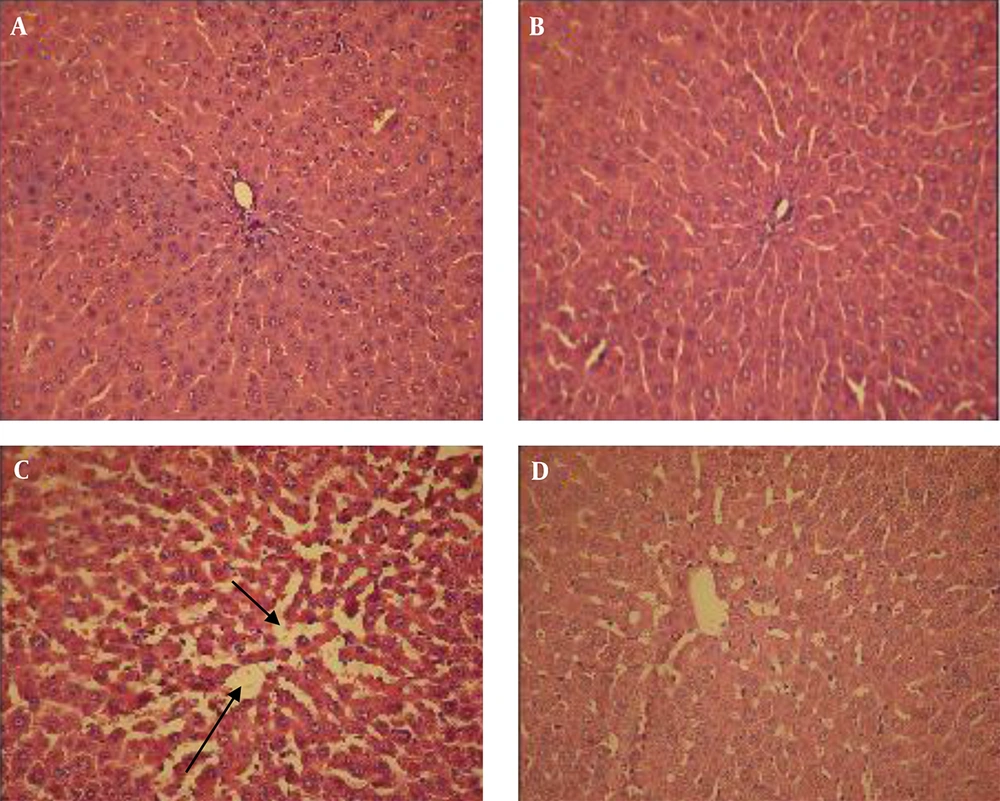
Figure 2.
A, healthy control; B, healthy control treated with extract; C, untreated diabetic; D, diabetic treated with extract. Liver of controls (untreated and treated with extract) shows no histopathological changes. The liver of an untreated diabetic shows a loss of cell arrangement and dilatation of the sinusoids (arrows), but liver in diabetics treated with hydro-alcoholic extract shows amelioration in the histological structure (H and E ×300).
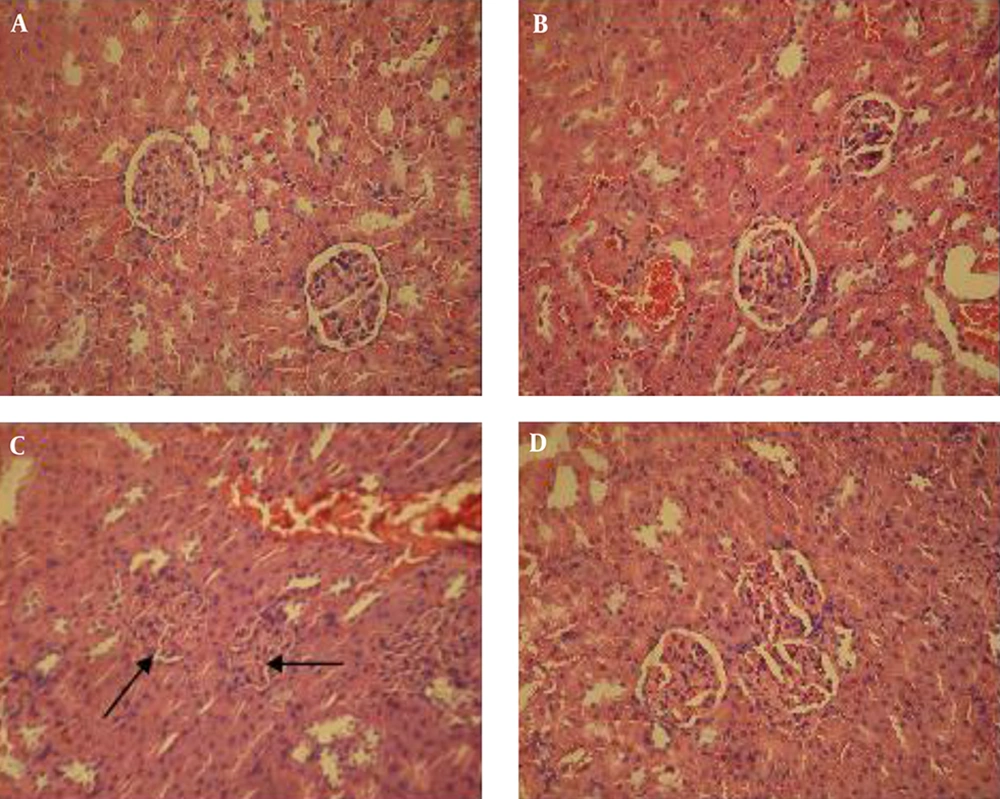
Figure 3.
A, healthys control; B, healthy controls treated with extract; C, untreated diabetic; D, diabetic treated with the extract. Tubules and glomeruli were normal in control rats (untreated and treated with hydro-alcoholic extract). The kidney of diabetic rats represents degenerated glomeruli and reduced urinary space (arrows), but these changes were ameliorated in the diabetic rats treated with hydro-alcoholic extract (H and E X300).
5. Discussion
The results of the current study showed that serum level of glucose significantly increased in STZ-induced diabetic rats compared to controls. This result is consistent with the findings of Augusti et al. and Campos et al.’s study in rats (15, 16). In addition, a daily oral intervention of 75 mg/kg hydroalcholic extract of C. colocynthis can reduce the serum level of glucose in STZ-induced diabetic rats. This result confirmed a finding of other studies, which investigated the effect of seed extract on the blood glucose in rats and fruit extracts of C. colocynthis in humans (7, 9). Hyperglycemia and glycosuria are two common clinical features of diabetes; failure to regulate the level of blood glucose resulted in severe microvascular complications, such as nephropathy, retinopathy, neuropathy, and cardiovascular disease (17, 18). Thus, extracts from different parts of this plant may be useful for reducing diabetes complications in the long-term. Moreover, previous studies have shown that the administration of 500 mg/kg of C. colocynthis extract resulted in a significant reduction in blood glucose (17-20). Also, Dallak et al. confirmed that the administration 20 mg/kg fruit extract of C. colocynthis produced a significant reduction in blood glucose (19). In a study conducted on alloxan-diabetic rats, the results suggested that oral administration leaf extract of C. colocynthis (250 and 500 mg/kg) leads to a reduction in the serum level of glucose after 8 weeks intervention (17). Several mechanisms could be implicated in the antidiabetic effects of C. colocynthis extract, since it has been confirmed the plant not only could stimulate the beta cells and consequently accelerate insulin releasing but it also contributes in the activation of the insulin receptors (20). Moreover, it has been found that the anti-diabetic effect of C. colocynthis may be due to enhanced insulin secretion, reduction of gluconeogenesis, and the inhibition of insulin counter-regulatory hormones, such as glucagon, cortisol, and growth hormone (21).
It has been demonstrated that one of the C. colocynthis compounds is saponin, which could be toxic at high doses (22, 23). Previous studies have been shown saponin how to inhibit platelet aggregation, hemolysis, and increased cell membrane permeability to macromolecules (24, 25). In addition, Diwan et al. found that an excessive level of saponin existing in the high doses of C. colocynthis resulted in a histopathological changes of the liver and lastly increased animal’s mortality (23). In order to evaluate hemolysis in the current study, total and conjugated bilirubin in serum must also been measured. The results showed in diabetic rats treated with extract serum level of bilirubin (total and conjugated) significantly decreased, thus; we used safe dose of extract in the current study.
Disorders in lipid metabolism have a key role in the development of diabetes mellitus complications. The most common disorders of lipid metabolism in diabetes are hypercholesterolemia and hypertriglyceridemia (26). In the current study, significantly increased serum levels of TC, TG, and LDL-C but markedly decreased serum level of HDL-C was observed in STZ-induced diabetic rats. These results are consistent with the previous findings (27-29). Since insulin inhibits the hormone-sensitive lipase, the major reason for disorder of lipid metabolism in diabetic rats is an increased free fatty acid mobilization from adipose tissues into the circulation (30). Excess free fatty acid into the circulation in diabetic rats could participate in phospholipid, TAG, and cholesterol synthesis by the liver. Then, these substances may be transported into the circulation in the forms of lipoproteins (31). We found that the administration of 75 mg/kg leaf extract of C. colocynthis, leading (which are you looking for) improvement of lipid profile in diabetic rats. Dallak et al. have shown that the fruit hydro-alcoholic extract of C. colocynthis may produce a significant reduction in total cholesterol, triglycerides, and free fatty acids (32). However, Huseini et al. in a clinical trial study found C. colocynthis fruit had no changes on serum lipid profile of type 2 diabetic patients (33).
Since C. colocynthis has high level of saponin, thus, could make the histopathological changes on the different tissues (23). In order to reduce the side effects and toxicity in long term, we used safe dose of leaf C. colocynthis extract. Increased aminotransferase activity is commonly considered a biomarker of hepatocyte damage (34). In this study, we used a 75 mg/kg dose of the extract, and the results showed that this dose can leading to significant reduction of AST, ALT activity, and serum albumin as a marker of liver function. In addition, histological studies confirmed an improvement in the liver structure in the diabetic rats treated with extract, but histophatologiacal changes were observed in the untreated diabetic rats. However, the values of serum creatinine and urea in diabetic rats treated with extract were lower than untreated diabetic rats. Changes in glomeruli and tubules of kidney structure in diabetic rats treated with the extract were greatly improved compared to untreated diabetic rats. In addition, the histological study confirmed the improvement of pancreatic tissue changes in diabetic rats treated with extract. These effects may be due to the antioxidant properties of C. colocynthis because it has been found on this plant can increase antioxidant enzymes, such as GSH, SOD, and GPX (35). In addition, she, examined the methanol seed extract of C. colocynthis and extract prepared from Callus cultures from stems, leaves, and roots as scavenger power against H2O2 and DPPH in vitro (22, 24, 36). In addition, previous studies have shown that a hydro-alcoholic extract of C. colocynthis leading to beta cells regeneration and liver tissue improvement (11, 22).
5.1. Conclusion
Our results demonstrated that the administration of 75 mg/kg of hydro-alcoholic leaf extract of C. colocynthis has a significant anti-hyperglycemic and hyperlipidemic effect with accompanied by a protective and beneficial effect on the histopathological changes on the liver, kidneys, and pancreas. These findings confirmed the traditional usage of the C. colocynthis leaf extract for the treatment of diabetic complications.