1. Background
Cardiovascular diseases (CVDs) are considered to be the leading cause of morbidity and mortality among human beings. According to Global Burden of Disease (GBD) report, 9.1 million deaths from CVDs were recorded in 1990s, and about 75% increase is expected by 2020 (1). Similarly, the age-standardized deaths from ischemic heart disease (178 per 1,00,000 persons each year), stroke incidence (154 per 1,00,000 persons each year), cerebrovascular disease (90 per 1,00,000 persons each year) and hypertensive heart disease (18 per 1,00,000 persons each year) were higher in India (2). Risk factors such as smoking, hypertension, hypercholesterolemia, high cholesterol to HDL ratio, type 2 diabetes mellitus (T2DM), and central/ visceral obesity were reported for CVDs (3). Currently, antidyslipidemic- (HMG CoA reductase inhibitors) and antiplatelet/antithrombotic-oriented drugs have been available in the market to control several CVDs (4). the other special strategies such as targeting chemokines, microRNA, and regeneration of cardiomyocytes are new fields of research as it is revealed that they significantly control CVDs (5). On the other hand, the adverse effects of the allopathy-based pharmacotherapy have diverted the attention of scientific community towards herbal- and fungal-based natural products as a treatment for CVDs. Although there is no proof regarding their efficacy and safety, consumption by children and pregnant women, and their specified active ingredients in natural products-based therapy, few medicinal mushrooms (e.g. Agaricus bisporus, Grifola frondosa, Lentinus edodes and Pleurotus ostreatus) with some health beneficial properties such as alteration of lipid metabolism, antioxidant status, antihypertension, and antiplaque formation are marketed to control CVDs (6, 7).
Agaricus bisporus (white button mushroom) belongs to higher Basidiomycota and is a highly-cultivated edible mushroom (accounting for 40% of total mushroom species, which is used as an important nutritional and medicinal source worldwide. It contains high protein, low calories, restricted carbohydrate and lipids, essential fatty acids, fibre, minerals, vitamins (B-complex, C and D), essential amino acids, lectins, indole compounds, and phenolic compounds such as gallic, caffeic, ferulic, p-coumaric, cinnamic, protocatechuic acids, myricetin, and ergothioneine (8-10). Furthermore, A. bisporus possesses numerous ethno-medicinal properties, including antioxidant, anticarcinogenic, antimicrobial, antiviral, anti-inflammatory, immunomodulatory, anticancer, antinociceptive, antihypercholesterolemic antidiabetic, antiparasitic, and cardioprotective ones (11-15).
2. Objectives
Accordingly, the present study aimed to investigate A. bisporus extracts and purified phenolic acids to explore their cardioprotective properties considering in vitro CEase inhibitory activity.
3. Methods
3.1. Sample Collection and Preparation
The fresh white button mushroom (Agaricus bisporus) was procured from a local mushroom cultivator (Coimbatore, Tamil Nadu, India), washed with tap water to remove the dust and dirt, and then rinsed with distilled water. The fruiting body was carefully pruned and used for the experimental analysis.
3.2. Hot Water Extraction (HWE) and Pressurized Hot Water Extraction (PHWE)
A slightly modified procedure adopted by Shakthi Deve et al. (16) was employed for HWE. For this purpose, 1 g of white button mushroom was weighed, sliced into small pieces, and gently homogenized with 20 mL of distilled water using a physical homogenizer for 5 minutes. The resultant mixture was made up to 50 mL with distilled water and kept in a boiling water bath at 90°C for 10 minutes. The extract was filtered using Whatman no. 1 filter paper, and 20% ammonium sulphate was then added. The mixture was centrifuged at 10,000 rpm for 10 min to remove the protein content, and the ions were also removed using dialysis. The resultant supernatant was lyophilized, stored at 4°C, and used for the experimental analysis. The same procedure was adopted for PHWE; however, the contents were incubated in an oil bath at 180°C and 1002 kPa for 10 minutes.
3.3. Organic Solvent Extraction (OSE) by Separating Funnel (SeFM) and Shake Flask (ShFM) Methods
Five grams of the mushroom sample was picked, sliced into pieces, gently homogenized with a physical homogenizer, and transferred into a separating funnel containing 25 mL of organic solvent (a mixture of hexane, chloroform, acetone, ethyl acetate, ethanol, methanol, and distilled water). It was shaken thoroughly for 15 minutes and filtered using Whatman no. 1 filter paper. The residue was then re-extracted using the same solvent for at least thrice, and the mixture was centrifuged at 10,000 rpm for 10 min to remove the protein content. The resultant supernatant was lyophilized, stored at 4°C, and used for the experimental analysis (16). The same procedure was adopted for ShFM; however, the content was shaken in an orbital shaker at 100 rpm for 12 - 16 h (17, 18).
3.4. Estimation of Total Flavonoid Content (TFC) and Total Phenolic Acid (TPA)
3.5. In Vitro Cholesterol Esterase (CEase) Inhibitory Activity
The method described by (Kumar et al.(21)) was adopted to investigate in vitro cholesterol esterase inhibitory activity, and the CEase inhibition was calculated as follows: CEase inhibition (%) = [(Activity of control - activity of test)/activity of control] × 100. In order to detect CEase inhibitory activity, standard markers such as gallic acid, quercetin, rutin and ferulic acid were also analysed.
3.6. 1D Thin Layer Chromatography (TLC) and 2D Preparative Thin Layer Chromatography (2D PTLC) Analyses
The slightly modified method proposed by Sathishkumar et al. (22) was adopted for 1D TLC. Pre-coated and activated silica gel sheet was picked, and about 25 µL of the aqueous extract was spotted 0.8 cm far from the edge of the plate. The chromatogram was developed one dimensionally (1D) in an air-tight chamber in the presence of a mobile phase consisting of hexane: acetone (1:2). The plates were developed and visualized under both short and far UV light (254 nm and 360 nm) to detect the polyphenols. The 2D PTLC technique was performed based on the method described by Shakthi Deve et al. (16), which was slightly modified.
3.7. High Resolution Liquid Chromatogram-Mass Spectrometry (HRLC-MS)
The purified PTLC eluate was subjected for direct HRLC-MS (electron spray ionization (ESI) positive mode; Q-TOF) analysis as per slightly modified procedure proposed by Sathishkumar et al. (23). The mobile phase composed of 0.3% formic acid (pH = 2.2) [phase A] and acetonitrile (Phase B). Gradient elution was performed at 0.9 ml/ min as follows:
1) Phase A: 88% (70 min);
2) Phase B: 9% - 15% (0 - 21 min), 15% - 22% (21 -45 min), 22% - 35% (45 - 60 min), 35% - 90% (60 - 65 min) and 90% (65 - 70 min)
The mass spectra was scanned in the range 100 - 1000 amu from 0 - 49.5 mins to obtain direct peaks.
3.8. Steam Blanching Method and Sensory Analysis
Fresh mushroom soup was prepared using steam blanching method at two different time duration (1 1/2 and 3 1/2 mins, respectively) at the same temperature by sieving and crushing mode of mushrooms. The soup was served by individuals aged between 18 - 40 years (n = 25), and the sensory analysis was performed based on the collected data from a questionnaire addressing variables such as colour, flavour, taste, consistency (physical texture), and overall quality. The questionnaire was scored using a nine-point Likert scale.
3.9. Statistical Analysis
All the numerical findings were expressed as mean ± SD. One way ANOVA, Student’s t-test (paired), simple regression equation, and Karl Pearson correlation coefficient were also performed with MS excel version 10.
4. Results and Discussion
In the present study, the polyphenolic content (TFC and TPA) of A. bisporus was extracted using different methods such as HWE, PHWE, SeFM, and ShFM (Table 1). The results of the paired Student’s t-test between TFA and TPA are presented in Table 2. TFC and TPA were expressed as quercetin equivalents (QAE) and ferulic acid equivalents (FAE), respectively. The standard calibration curve constructed for QAE (r2 = 0.979) and FAE (r2 = 0.956) revealed a strong correlation between the concentration and absorbance of the polyphenolic content. In contrast, Student’s t-test results in terms of different extraction methodologies were not significant at 5% (P = 0.368). Moreover, ShFM was found to be superior in extracting increased amount of flavonoid (ethanol: 32.61 ± 4.1 mg/g tissue) and phenolic acid (aqueous: 12.38 ± 1.32 mg/g tissue), which, has established the importance of selection of solvents and extraction method to leach polyphenolic contents from the raw material. The aqueous and alcoholic solvent-based system extracted higher phenolic content which has endorsed the presence of appreciable polar polyphenolic moieties in the fruiting body. A similar result indicating the impact of aqueous system (ShFM) followed by alcoholic solvents (methanol and ethanol) on the extraction of polyphenol and flavonoid was reported by another researcher (24). The same result in the present study also proved the presence of ample amount of polar polyphenols.
Table 1.
A Comparative Analysis of TFC and TPA of A. bisporus Extracts From HWE, PHWE, SeFM and ShFMa
| Type of Extraction Methodology | Total Flavonoid Content (*QAE mg/g Tissue) | Total Phenolic Acid Content (*FAE mg/g Tissue) |
|---|---|---|
| Hot water extraction (HWE) | 1.391 ± 0.015b | 3.8 ± 0.23b |
| Pressurized hot water extraction (PHWE) | 6.198 ± 0.45b | 3.76 ± 0.039b |
| Separating funnel method | ||
| Hexane | 2.436 ± 0.43b | 2.85 ± 0.049b |
| Chloroform | 0.713 ± 0.003b | 1.103 ± 0.054b |
| Ethyl acetate | 1.327 ± 0.054b | 0.343 ± 0.039b |
| Acetone | 0.04 ± 0.003b | 0.971 ± 0.078a |
| Ethanol | 0.178 ± 0.035b | 0.263 ± 0.056b |
| Methanol | 0.297 ± 0.013b | 0.286 ± 0.078b |
| Distilled water | 0.118 ± 0.034b | 0.691 ± 0.034b |
| Pooled fraction | 0.21 ± 0.098b | 1.333 ± 0.012b |
| Shake flask method | ||
| Hexane | 1.485 ± 0.003b | 0.925 ± 0.056b |
| Chloroform | 0.178 ± 0.065b | 0.891 ± 0.004b |
| Ethyl acetate | 0.336 ± 0.002b | 0.525 ± 0.083b |
| Acetone | 1.287 ± 0.093b | 0.685 ± 0.005b |
| Ethanol | 32.61 ± 4.1b | 2.182 ± 0.089b |
| Methanol | 0.99 ± 0.005b | 6.868 ± 0.8b |
| Distilled water | 0.91 ± 0.034b | 12.38 ± 1.32b |
| Pooled fraction | 0.82 ± 0.045b | 0.027 ± 0.002b |
Abbreviations: FAE, ferulic acid equivalents; QAE, quercetin equivalents.
aValues are expressed as mean ± SD.
bNon-significant at 5% (Paired Student’s t-test).
Table 2.
Paired Student’s t-Test Between TFC and TPA
| t-Test: Paired Samples | TFC | TPA |
|---|---|---|
| Mean | 2.8624444 | 2.216166667 |
| Variance | 57.126311 | 9.456800382 |
| Observations | 18 | 18 |
| Pearson correlation | 0.0378624 | |
| Hypothesized mean difference | 0 | |
| df | 17 | |
| t Stat | 0.3405577 | |
| P (T ≤ t) one-tail | 0.3688044 | |
| t Critical one-tail | 1.7396067 | |
| P (T ≤ t) two-tail | 0.7376088 | |
| t Critical two-tail | 2.1098156 |
The presence of pale yellow flavonoids (Rf = 0.92) and dark blue phenolic acids (Rf = 0.97) was noticed using 1D TLC technique (Figure 1). The previous documentations on the flavonoid obtained from various medicinal mushrooms with Rf values between 0.88 to 0.90 were in a similar vein with this finding in the present study (25). The further attempts to purify the phenolic content using 2D PTLC technique revealed a dark blue single spot (Figure 2). The MS analysis of PTLC purified phenolic acid eluate recorded the presence of four different phenolic acids, including p-hydroxy benzoic acid (RT = 0.786; m/z 136; relative abundance: 3.64 × 10⁶ counts), cinnamic acid (RT = 0.945; m/z 146; relative abundance: 3.37 × 10⁵ counts), protocatechuic acid (RT = 1.214; m/z 154; relative abundance: 4.42 × 10⁵ counts), and ferulic acid (RT = 1.486 min; m/z 194; relative abundance: 1.11 × 10⁷ counts) (Figure 3). According to the findings, there is high concentration of ferulic acid in the fruiting body of A. bisporus. Previous studies on methanolic and ethanolic extracts also revealed the presence ferulic acid, p-hydroxy benzoic acid, cinnamic acid, and protocatechuic acid. The present findings in terms of aqueous extract supported the previous reports (26-28). Moreover, no scientific community has investigated the aqueous extract-based phenolic acid profile as such our study was the first one purifying and reporting its phenolic content using mass spectrometry analysis.
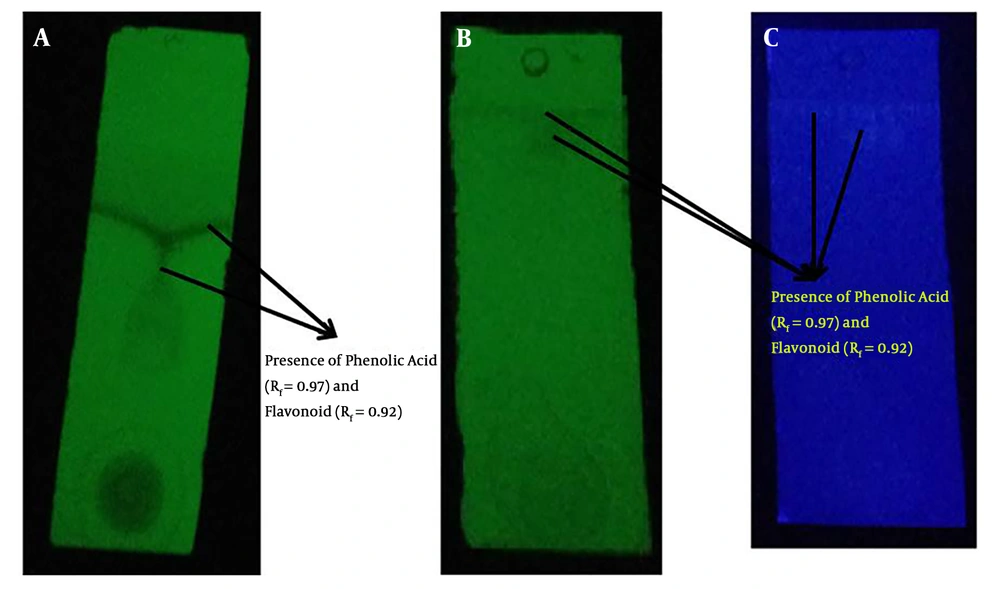
Figure 1.
A and B, Visualization of flavonoid and phenolic acid under short UV light; C, visualization of flavonoid and phenolic acid under far UV light
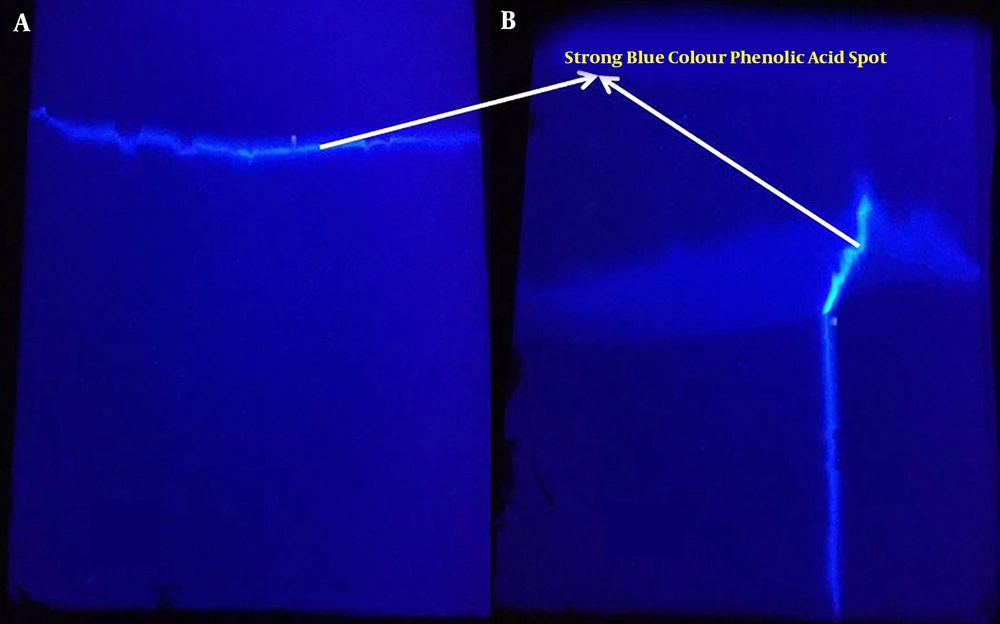
Figure 2.
Purification of phenolic acid content using, A, 1D PTLC; B, 2D PTLC technique
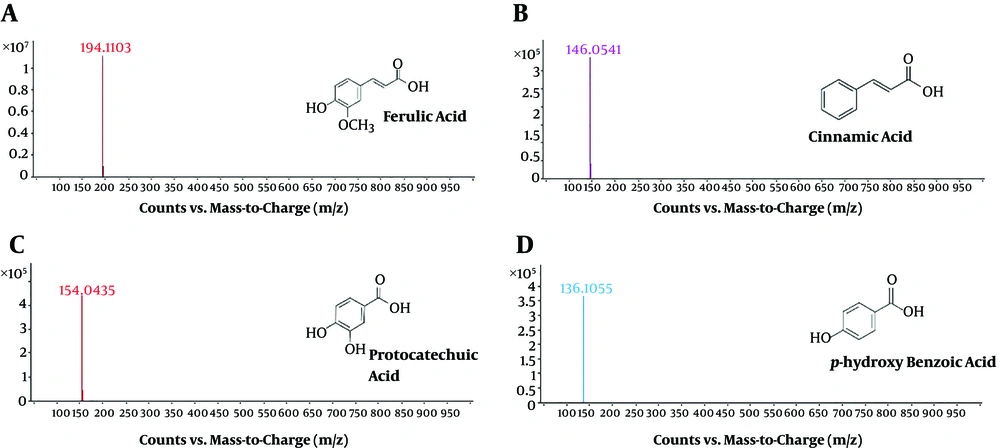
Figure 3.
Direct mass spectral (MS) peak of purified phenolic acids
The study further observed and compared the impact of extracts and purified phenolic acids on the inhibition of CEase. As shown in Figure 4, most of the organic solvent extracts from ShFM (acetone > ethyl acetate > ethanol > hexane > methanol) and SeFM (methanol > distilled water > ethanol > hexane >) revealed similarly high CEase inhibitory activity; however, HWE (15.6 ± 1.1%) and PHWE (1.5 ± 2.3%) showed highly poor activity. Interestingly, the standard phenolic markers exhibited a moderate CEase inhibitory activity. Furthermore, the results of one-way ANOVA showed a significant difference at 1% (P = 0.00136), proving the strong efficacy of A. bisporus extracts against CEase activity, in comparison to the polyphenolic markers. In a same line, paired Student’s t-test between ShFM- and SeFM-based extracts revealed not significant difference at 5% (P = 0.128), indicating the similar role of these two methods in inhibiting CEase activity. Moreover, the purified phenolic acids had a moderate cholesterol esterase inhibitory activity (24.7 ± 1.7%; IC50 = 2.61 µg), implying its significant role in controlling the total cholesterol level.
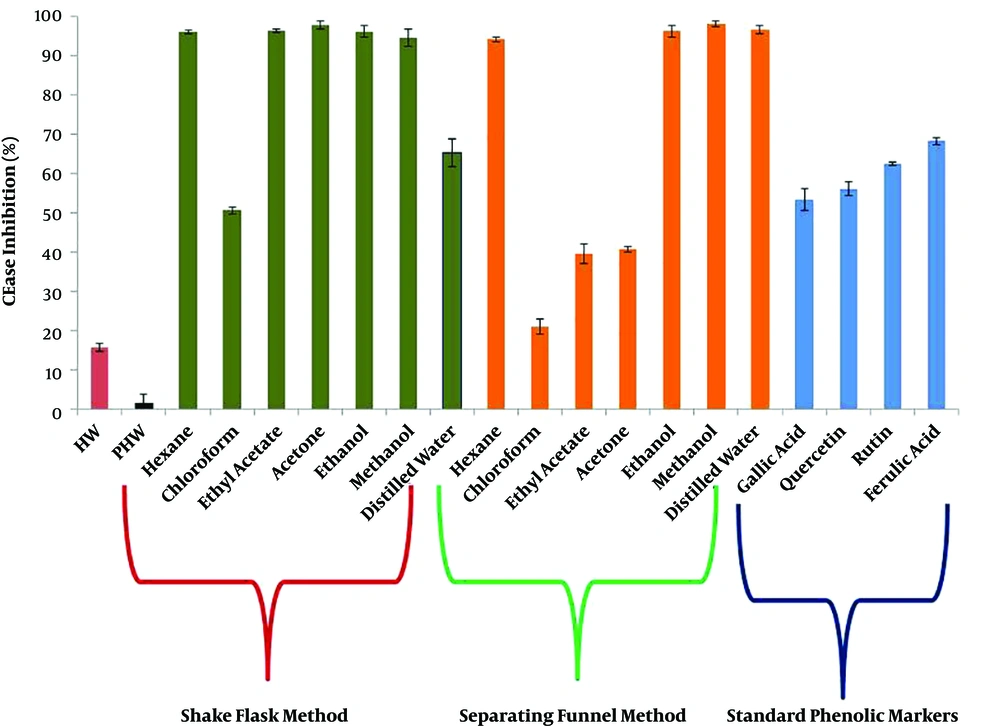
Figure 4.
Comparative analysis of CEase inhibition (exhibited by various extraction methods and standard polyphenolic markers)
CEase belongs to α/β hydrolase family, and the catalytic activity is due to the presence of triad amino acid sequence (Ser194, Asp320 and His435) and oxyanion hole residues (Gly107, Ala108, Ala195). Similarly, residues such as Arg83 and Arg446 are found to be responsible for the activation of bile salt. Ser194 makes a nucleophilic attack on the cholesterol ester bond (carboxyl side), while Asp320 modulates the pKa of the reaction that facilitates the acid base catalysis of His435 upon the carbonyl side of the substrate to form an acyl-enzyme intermediate, and final release of fatty acid and cholesterol (29). Few reports are available, and little is known about the CEase inhibition mechanism, specifically by phenolic acids from mushrooms. Few reports have revealed the inhibitory property of gallic acid, mangiferin, catechin, epicatechin, procyanidins, and saponins from herbal extracts against CEase (30-32). The in silico docking studies on a few flavonoids such as apigenin, curcumin, glycitein, okanin, and rhamnazin also documented the presence of potent CEase inhibitory sites, especially the interaction with the catalytic triad and oxyanion hole residues (33). We assume that an approximately similar mechanism may be adopted by phenolic acids. In this regard, our study successfully proved the potent CEase inhibitory property of A. bisporus for the first time.
Moreover, further studies on the consumer impact of A. bisporus soup based sensory qualities ends with good result. The soup (crushed and sieved) prepared at 3 1/2 minutes was preferred by all the consumers as the best recording an average assessment value of 6 for the selected variables. The soup also recorded an appreciable CEase inhibitory property (24.7 ± 0.3%), which was similar to the activity of purified phenolic acids (24.7 ± 1.7%), the retention of phenolic acid (i.e., tolerance of phenolic acids against thermal decomposition) was recorded during the soup preparation process. The present study concludes the significant inhibitory property of A. bisporus against CEase as such it can be practised as an appropriate traditional medicine to control/ cure several CVDs.