


1. Background
Sexual dysfunction is the most important problem among menopausal women (1, 2). Diagnosis and management of female sexual dysfunction is not much considered and need future research (3). The decision on the treatment of menopausal symptoms is inherently complex. This complexity has risen over the past decade (4), and the use of alternative medicines has been enhanced to treat menopause problems (5). The World Health Organization calls complementary and alternative medicine for preventing disease. It may be effective in improving the symptoms of menopause and increasing the sense of welfare and long-term well-being of women during this period (6-9).
Fennel (F. vulgare) is a plant in the carrot family that is indigenous to the shores of the Mediterranean Sea (10). The main chemical compounds in fennel are trans-anethole and dianethole, which have estrogenic effects (11). The positive effect of fennel on the sexual satisfaction of postmenopausal women has been reported previously (12). Nigella sativa is also a rich source of essential oil and unsaturated fatty acids and contains phospholipids, carotenes, calcium, iron, and potassium (13). The pharmacological effects of Nigella sativa have been reported on the treatment of metabolic syndrome, hyperlipidemia, and depression in postmenopausal women (14, 15). There are many studies on Melissa officinalis, which have shown its antimicrobial, antioxidant (16), anti-anxiety (17), and anti-depression (18, 19) properties, besides its effects on improving cognitive function and mood (20).
Retrospective research showed that there is no trial using Melisa, fennel, and Nigella to evaluate their effects on the decrease of sexual desire in women (21). The presence of various components in a polyherbal formulation may have a synergic effect (22) and might be responsible for the improvement of sexual function.
2. Objectives
Therefore, due to the growth of these plants in many parts of Iran and beliefs about their effectiveness in traditional medicine in Iran and the world, they can be suggested for the treatment of postmenopausal patients. Also, regarding the lack of human studies on the effect of these plants’ combination on sexual function, the current study was designed and conducted.
3. Methods
The sample size was calculated based on the Darvish-Mofrad-Kashani study in 2018 (21), which found a significant improvement in the FSFI score in the intervention group (27.9 ± 6) after four weeks of Melissa use compared to the control group score (21.7 ± 3.9). Thus, with a 95% significance level, 90% power, and 10% loss-to-follow-up estimation, we enrolled 22 cases in each group.
3.1. Patient Enrollment
The participants included the menopausal women referring to the clinic of Gorgan Health centers aged between 41 and 54 years, with natural menopause (amenorrhea for at least 12 months) and discomfort in sexual activity. They were randomized into two treatment groups. The exclusion criteria consisted of hormone use over the past eight weeks, cigarette smoking, alcohol consumption, uterine bleeding from unknown causes, vaginal infection, and phytoestrogen use in the past two months.
3.2. Study Protocol
Written informed consent was obtained from each participant before data collection. Eligible women were randomly assigned into two groups. Each participant in Group 1 (n = 27) received a 1000 mg capsule per day containing M. officinalis extract (300 mg), fennel fruit extract (300 mg), and N. sativa fresh seed powder (400 mg) and each participant in group 2 (n = 21) received one capsule of placebo (1000 mg starch) per day. The treatment continued for eight weeks. Medication or placebo was prescribed once a day in the morning after breakfast, and all women in the study received the same research information. All participants, researchers, and staff during the treatment period were blinded to treatment allocation.
The physical and gynecological examinations were done, and demographic, basal, and medical history data were collected at the beginning of the study. The Female Sexual Function Index (FSFI) was used to assess sexual dysfunction (23). The Persian version of the tool has been translated and validated (24). The FSFI questionnaire and the side-effects questionnaire were filled out at the end of the eighth week.
The 19-item questionnaire has been developed as a multi-dimensional reporting tool for assessing the key dimensions of sexual function in women over the past month. The scale includes six domains namely desire (two questions), subjective arousal (four questions), lubrication (four questions), orgasm (three questions), satisfaction (three questions), and pain (three questions). Libido (sexual desire) or interest is a feeling that includes a desire to have a sexual experience, feeling receptive to a partner’s sexual initiation, and thinking or fantasizing about having sex. Arousal is a desire for sexual activity with sexual stimulation. Orgasm is to reach orgasm after adequate sexual arousal and stimulation. Dyspareunia is a pain in the pelvis or vagina during any normal sexual stage (Table 1) (23).
Table 1.Domains of FSFI and the Scoring System
| Domain | Questions | Score Range | Factor | Min | Max |
|---|---|---|---|---|---|
| Desire | 1, 2 | 1 - 5 | 0.6 | 1.2 | 6 |
| Arousal | 3, 4, 5, 6 | 0 - 5 | 0.3 | 0 | 6 |
| Lubrication | 7, 8, 9, 10 | 0 - 5 | 0.3 | 0 | 6 |
| Orgasm | 11, 12, 13 | 0 - 5 | 0.4 | 0 | 6 |
| Satisfaction | 14, 15, 16 | 1 - 5 | 0.4 | 0.8 | 6 |
| Dysparunia | 17, 18, 19 | 0 - 5 | 0.4 | 1 | 6 |
| Sum | 36 | 2 |
Since the questions of the FSFI are not equal to each other, the scores of the questions in each area were summed up and then multiplied by the number of factors. The scores were 1 to 5 for the questions in the sexual desire domain, 0 to 5 for the orgasm, lubrication, and pain domains, and 5 or 0,1 for the sexual satisfaction domain. A score of zero indicates no sexual activity during the past four weeks.
Based on the weight of the domains, the maximum score for each area of 2 and 36 will be for the total scale. The cutoff scores are 3.3 for sexual desire, 3.4 for sexual orgasm, 3.7 for lubrication, and 3.8 for pain and satisfaction. The minimum score is 23 for the total scale. Accordingly, a score lower than the mentioned ones indicated a disorder. The total FSFI score is the sum of all scores obtained in the six domains, which was 36. The higher the score, the lower the sexuality function. A score of higher than 23 was considered as the cutoff value for the diagnosis of female sexual dysfunction.
3.3. Preparation of Medicine
The plant samples of Melissa leaves, Fennel fruits, and Nigella sativa seeds were purchased from a local market and transferred to the Laboratory of Pharmaceutical Sciences of Islamic Azad University. Then, 600 g of Melissa and fennel powders were transferred to a percolator and extracted using 70% ethanol as a solvent. Extraction was repeated three times, with intervals of at least seven days. Then, the extracts were concentrated using a rotary device at 40°C. The extracts were dried under a hood in an oven and then weighed. Then, Nigella sativa was powdered individually and mixed with the solid extractions. Mixed formulations (Melissa extract 300 mg, Fennel extract 300 mg, and Nigella 400 mg) were prepared in the form of 1000 mg capsules. Both the medicine and placebo (1000 mg capsules) were similar in size, weight, color, and package.
There were 30 capsules per jar for both medicine and placebo. The jars were then sealed and kept at ambient temperature until administration. To investigate complaints, the patients were requested to deliver unused capsules in the follow-up.
3.4. Statistical Analysis
Statistical Package for Social Science (SPSS) version 20 software was used for analyzing the data. The variables in the two groups of treatment and placebo were compared. As the distribution of data was normal, the mean values of quantitative variables were compared between the two groups using the independent t-test. The paired sample t-test was used for within-group comparisons (before/after comparison). The χ2 test was used to compare the categorical variables in both groups. A p value of less than 0.05 was considered statistically significant.
4. Results
No significant differences were observed at baseline between the two groups in terms of sociodemographic characteristics. No complication was reported with weekly phone follow-ups. Of 54 cases that entered the study, 48 patients followed the study protocol and completed the final examination. In both groups, more than 90% of the participants took at least 80% of the medication.
Of the 48 patients examined, 27 in the herbal treatment group, and 21 in the placebo treatment group received treatment for two months. In group 2 (placebo), six patients discontinued the drug use for reasons such as nausea and vomiting and were excluded from the study (Figure 1). The mean age was 46.9 ± 4 years in the herbal therapy group and 47.5 ± 6.43 years in the placebo group. The t-test did not show any difference between the two groups (P = 0.68) (Table 2).
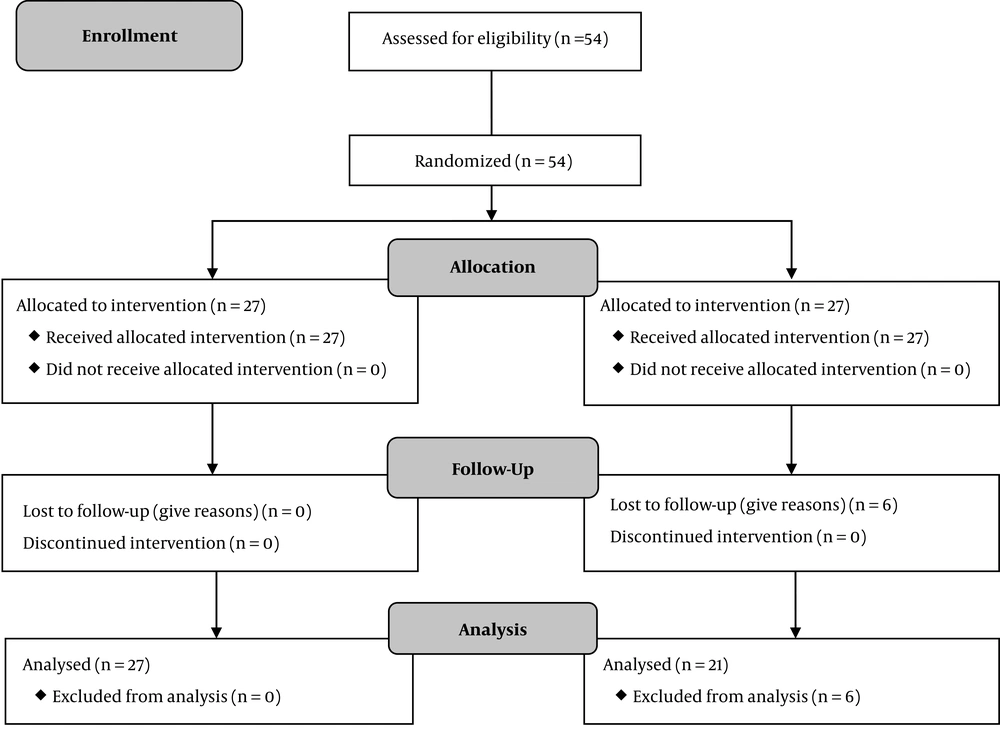
Figure 1.
Study profile
Table 2.Baseline Characteristics and Demographic Data of 46 Participants in Two Groups of Studya
| Variable | Intervention (N = 27) | Control (N = 21) | P Value |
|---|---|---|---|
| Ageb | 46.9 ± 4 | 47.5 ± 6.3 | 0.68 |
| BMIb | 28.7 ± 4.6 | 26.2 ± 3.9 | 0.052 |
| Gravidab | 3.8 ± 1.6 | 3.7 ± 1.3 | 0.75 |
| Parab | 3.7 ± 1.6 | 3.7 ± 1.3 | 0.88 |
| Live Childrenb | 3.6 ± 1.4 | 3.7 ± 1.3 | 0.84 |
| Menarche ageb | 12.7 ± 0.7 | 13 ± 0.7 | 0.15 |
| FBSc | 86.1 ± 6.3 | 86.3 ± 5.3 | 0.87 |
| Total cholesterolc | 160.1 ± 30 | 193.2 ± 33 | 0.87 |
| HDLc | 52 ± 3.5 | 55 ± 11.7 | 0.17 |
| LDL | 110.2 ± 18.5 | 104 ± 12.3 | 0.79 |
| Educationd | 0.30 | ||
| Elementary | 22 (81.5) | 20 (95) | |
| < diploma | 3 (11) | 1 (5) | |
| > Diploma | 2 (7.5) | 0 | |
| Economic status | 0.32 | ||
| Poor | 16 (59) | 11 (52) | |
| Intermediate | 9 (33) | 10 (48) | |
| Good | 2 (8) | 0 |
aValues are expressed as mean ± standard deviation or numbers (%).
bt-test (independent t-test) (normal distribution).
cMann-Whitney.
dChi-square.
The two groups were not significantly different in terms of age (at the time of data collection), menarche age, BMI, parity, education level, economy status (declared by the patient), HDL, and LDL levels. Before the intervention, the differences in the scores were not significant in the domains of orgasm (P = 0.39), satisfaction (P = 0.38), pain (P = 0.13), and total FSFI (P = 0.71) between the two groups (Table 3).
Quantitative variables studied concerning sexual function symptoms in postmenopausal women were compared between the two groups using the t-test as shown in Table 3. Before the intervention, there was a significant difference in the domain of sexual desire between the two groups, and the desire dysfunction was higher in the control group (3.08 ± 0.04 vs. 3.4 ± 0.3, P = 0.02). Therefore, before the intervention, the feeling of desire was higher in group 2 than in group 1, and the intervention had no effect on the reduction of this symptom and other sexual symptoms (P > 0.05). Also, before and after the intervention, the frequency of sexual dysfunction in the domains of arousal, lubrication, orgasm, satisfaction, and pain was not statistically significant between the two groups (P > 0.05) (Tables 3 and 4). The present study showed that the combination of N. sativa, M. officinalis extract, and fennel fruits generally did not reduce sexual dysfunction symptoms in postmenopausal women.
Table 3.Scores of Sexual Function Domains and Total Scores in Menopausal Women Before and After Intervention in Two Groupsa
| Variable FSFI Domains’ Scores | Intervention (N = 27) | Control (N = 21) | P Value |
|---|---|---|---|
| Sexual function of menopausal women before the intervention | |||
| FSFI score | 59.8 ± 10.6 | 61.9 ± 2.7 | 0.94 |
| Desire | 3.08 ± 0.4 | 3.4 ± 0.3 | 0.026 |
| Arousal | 3.4 ± 0.7 | 3.7 ± 0.3 | 0.12 |
| Lubrication | 5.5 ± 1.1 | 5.8 ± 0.3 | 0.55 |
| Orgasm | 4.2 ± 0.9 | 4.3 ± 0.5 | 0.92 |
| Pain | 3.1 ± 0.8 | 2.9 ± 0.7 | 0.22 |
| Satisfaction | 4.2 ± 0.8 | 4.5 ± 0.6 | 0.38 |
| Sexual function of menopausal women after the intervention | |||
| FSFI scoreb | 60.1 ± 10.6 | 62.2 ± 2.8 | 0.71 |
| Desireb | 3.08 ± 0.4 | 3.4 ± 0.4 | 0.026 |
| Arousalb | 3.4 ± 0.7 | 3.7 ± .0.3 | 0.072 |
| Lubricationb | 5.6 ± 1.2 | 5.8 ± 0.3 | 0.45 |
| Orgasmb | 4.2 ± 0.9 | 4.5 ± 0.6 | 0.39 |
| Painb | 3.1 ± 0.8 | 2.8 ± 0.6 | 0.13 |
| Satisfactionc | 4.2 ± 0.8 | 4.4 ± 0.7 | 0.38 |
aValues are expressed as mean ± standard.
bWithin-group comparisons using paired t-test. Mann-Whitney.
cChi-square
| Variable | Intervention (N = 27) | Control (N = 21) | P Value |
|---|---|---|---|
| Frequency of sexual dysfunction in menopausal women before the intervention | |||
| Desire | 8 (22.5) | 12 (57) | 0.051 |
| Arousal | 18 (67) | 16 (76) | 0.47 |
| Lubrication | 26 (96) | 21 (100) | 0.37 |
| Orgasm | 25 (92.5) | 19 (90.5) | 0.79 |
| Pain | 7 (26) | 2 (19.5) | 0.14 |
| Satisfaction | 21 (78) | 18 (86) | 0.48 |
| Frequency of sexual dysfunction in menopausal women after the intervention | |||
| Desire | 8 (22.5) | 12 (57) | 0.051 |
| Arousal | 19 (70) | 17 (81) | 0.40 |
| Lubrication | 26 (96) | 2 (100) | 0.37 |
| Orgasm | 25 (92.5) | 19 (90.5) | 0.70 |
| Pain | 7 (26) | 2 (9.5) | 0.14 |
| Satisfaction | 21 (78) | 18 (86) | 0.48 |
| Sexual function | |||
| Normal | 1 (4) | 0 | 0.37 |
| Dysfunction | 26 (96) | 21 (100) |
aValues are expressed as mean ± standard deviation or numbers (%).
bChi-square.
5. Discussion
This study aimed to assess the effect of M. officinalis and fennel extract combined with N. sativa powder on the sexual function of postmenopausal women. Our results showed that all domains of sexual function did not improve in the study group compared to the placebo group. Yaralizadeh et al. (25) showed that fennel could significantly increase the number of superficial cells of the vagina, decrease vaginal atrophy, and improve sexual satisfaction and sexual function. Another study showed that fennel significantly increased sexual satisfaction in postmenopausal women compared to placebo (12, 26).
Concerning the use of N. sativa alone in postmenopausal women, Parhizkar et al. (27) determined N. sativa effects on the reproductive system of menopausal animal models. The findings indicated the probable beneficial role of N. sativa in the treatment of postmenopausal symptoms and the possibility of using N. sativa as an alternative to hormone replacement therapy (HRT) for post-menopause in humans (27). Also, the sexual function of postmenopausal women did not improve with three-month N. sativa (600 mg/d) treatment (21).
Melissa officinalis may be a safe and effective herbal medicine for the improvement of hypoactive sexual desire disorder in women (28). There has been no trial using the combination of Melisa, fennel, and Nigella to evaluate their effects on the decrease of sexual desire in women (28). However, it is suggested that the presence of various components in one formulation has a synergic effect and might be responsible for the improvement of sexual function. In this study, a combination of three herbal drugs was used, which had no effect on the improvement of symptoms in the sexual function of menopausal women.
5.1. Limitation
The convenience sample was small; thus, there was the risk of selection bias and limited generalizability. Also, there were no similar studies on the combined use of this herbal remedy; thus, there was no possibility to compare the results. It is suggested that the combined use of this herbal be used in larger samples, different statistical populations, different doses, and longer studies.
Another limitation of this research was the lack of controlling all factors affecting sexual satisfaction, including mental and psychological status and individual characteristics of the sample, which could not be controlled for the research group. Also, the lack of a significant effect may be due to the high response of the placebo group. It is suggested that future experiments include designing a sequential, parallel, or long follow-up study with larger sample sizes to reduce the effect of placebo.
In this study, the effect of M. officinalis extracts, N. sativa powder, and F. vulgare fruits was studied on menopausal women who had no other chronic diseases and other medical conditions. It is suggested that, with the cooperation of specialized medical groups, the effects of this herbal medicine be measured on the sexual function of women with chronic diseases. Finally, it must be acknowledged that the stage of the sexual response period in women depends on several factors such as pre-menopausal experience, female sexual competence, the quality of interpersonal relationships, and effective relationships.
5.2. Conclusions
Despite many studies on the effectiveness of Melissa, Foenculum, and Nigella, this study showed that the combination of Foeniculum vulgare, Melissa officinalis extract, and Nigella sativa seed powder generally does not improve the sexual function of postmenopausal women with sexual dysfunction. It might be the synergism effect of this combination and a clinical trial with a larger statistical population is recommended.


