
1. Background
Stomach cancer is one of the most common chronic diseases worldwide. The geographical distribution of stomach cancer incidence is different worldwide (1, 2). Reports have indicated that the incidence of stomach cancer has decreased in recent years in the world (1, 3), but there is an increasing trend in Asian countries (2). The incidence of stomach cancer in Iran, especially in the western and northwestern regions, has been increasing in recent years (4, 5).
Stomach cancer is the second cause of death among cancer patients (1). In addition, stomach cancer has a detrimental effect on the lifestyle of people and their families (6, 7). The unbalanced distribution of stomach cancer among different countries may be caused by different eating patterns and lifestyles of people (2, 8).
Various studies on nutrition have shown that the consumption of salty foods, pickles, and alcohol can damage the stomach mucosa, and their continued use can increase the risk of stomach cancer (6, 9, 10). Doctors and researchers believe that the decrease in stomach cancer in the world is due to developing relations between countries, the increase in public health, and the availability of fresh fruits and vegetables, which are not observed in countries with high incidence (1). Studies conducted in different geographical locations have shown that consuming garlic, vegetables, and fruits in a week reduces the risk of stomach cancer (11-13).
Examining identified factors associated with the incidence of chronic diseases such as cancers often performs an essential role in their evaluation and control (13, 14). On the other hand, the incidence of stomach cancer is increasing in Hamedan, Iran, contrary to the global pattern and aligned with the western cities of Iran (4). Investigating the identified factors related to stomach cancer and planning health and treatment organizations and health policymakers of Hamedan province can help reduce the incidence of stomach cancer.
2. Objectives
The main objective of this study was to report the identified factors associated with gastric cancer in Hamedan, Iran.
3. Methods
3.1. Study Design
This descriptive study was conducted with a retrospective design in the Diagnostic and Treatment Center of Mahdieh in Hamadan (DTCM). Individuals whose gastric cancer pathology test results were confirmed during November 2018 - 2019 and referred to DTCM. A total of 100 patients (male n = 77 and female n = 23) with gastric cancer (case group) were studied. The mean and standard deviation of age in the case group was 63.9 ± 13.0 years. Two matched controls were selected regarding age (± 5 years) and sex (total control n = 200) for each person in the case group. The first control group (n = 100) were people with no family history of cancer and referred to DTCM diseases such as treatment of complications caused by surgery, MRI examination, and ultrasound examination. The second control group (n = 100) was a first-degree family of patients, and most subjects in the control group were accompanied by cancer patients referred to the center.
3.2. Data Collection
The information was collected through a checklist and face-to-face interviews after achieving permission from Hamadan University of Medical Sciences. The checklist questions included demographic information (such as age, sex, weight, height, and education) and diet questions, including bread type, pickle, amount of salt, alcohol, fruit, vegetable, garlic, and onion, hot food, and pepper consumption, and the source of drinking water. The checklist also included blood type questions, a family history of cancer (types of cancers), especially stomach cancer, and smoking history. The inclusion criteria in the case group were approved results of pathology tests in November 2018 - 2019. The exclusion criteria were an incomplete checklist and the non-cooperation of people.
3.3. Statistical Analysis
The data were analyzed in Stata software version 14 after collecting information. The descriptive statistics section used to mean, standard deviation, frequency, and relative frequency to describe the data. The conditional logistic regression model was used to analyze the data and control the matched variables (age and sex). The odds ratio (OR) and confidence interval of 95% (12) was reported for each of the predictors of gastric cancer. A significance level of odds ratio was considered 0.05.
4. Results
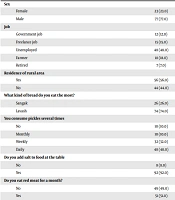
The results showed that the mean and standard deviation of age in the first and second control group were 64.4 ± 13.4 and 64.2 ± 13.3 years, respectively. Daily consumption/cup of black tea in the case group was significantly different from the first (P = 0.001) and second control (P = 0.001) groups (case group: 7.1 ± 2.6 versus first control group: 4.3 ± 2.9 and second control group: 4.1 ± 2.7). Most people in the case group were employees (n = 48, 48.0%), while 37.0% (n = 37) in the first control group were self-employed, and 46.0% (n = 46) in the second control group were retired. Most people in the case group were smokers (number case group = 68, 68% versus number first control group = 37, 37.0%, and number second control group = 27, 27.0%). Significant differences were observed in the consumption of vegetables during the week with the control group (number of case group = 59, 59% versus number of first control group = 80, 80.0% and number of second control group = 81, 81.0%). About 44.0% (n = 44) cases, 21.0% (n = 21) cases in the first control group, and 19.0% (n = 19) cases in the second control group were residents of the village. Moreover, 76.0% (n = 76) of the cases preferred hot food, while 44.0% (n = 44) of the first control group and 49.0% (n = 49) of the second control group preferred to eat hot food (Tables 1 and 2).
Table 1.
Descriptive Characteristics of Stomach Cancer Cases and Controls
| Variables | Cases (N = 100), Mean ± SD | Control Group 1 a, Mean ± SD | Control Group 2 b, Mean ± SD |
|---|---|---|---|
| Age (match) | 63.9 ± 13.0 | 64.3 ± 13.4 | 64.2 ± 13.3 |
| Weight (kg) | 70.8 ± 11.9 | 70.3 ± 11.2 | 63.9 ± 8.9 |
| Height (cm) | 170.4 ± 8.6 | 170.9 ± 7.8 | 165 ± 8.8 |
| Number of cups of tea consumed (daily) | 7.1 ± 2.6 | 4.3 ± 2.9 | 4.1 ± 2.7 |
| Number of eggs consumed (monthly) | 21.7 ± 20.3 | 22.34 ± 24.8 | 21.5 ± 21.1 |
| Number of garlic consumed (monthly) | 16.9 ± 24.7 | 34.7 ± 65.6 | 40.6 ± 82.7 |
| Number of onions consumed (monthly) | 18.8 ± 17.5 | 25.3 ± 18.6 | 26.7 ± 18.9 |
| Do physical activity in week (min) | 12.2 ± 5.5 | 25.1 ± 14.6 | 26.5 ± 16.5 |
a Control group 1: Control group who do not have a family history of cancer.
b Control group 2: The control group has a family history of cancer.
Table 2.
Descriptive Characteristics of Stomach Cancer Cases and Controls
| Variables | Cases; No. (%) | Control Group 1 a; No. (%) | Control Group 2 b; No. (%) |
|---|---|---|---|
| Sex | |||
| Female | 23 (23.0) | 23 (23.0) | 23 (23.0) |
| Male | 77 (77.0) | 77 (77.0) | 77 (77.0) |
| Job | |||
| Government job | 12 (12.0) | 24 (24.0) | 26 (26.0) |
| Freelance job | 15 (15.0) | 37 (37.0) | 19 (19.0) |
| Unemployed | 48 (48.0) | 6 (6.0) | 3 (3.0) |
| Farmer | 18 (18.0) | 7 (7.0) | 6 (6.0) |
| Retired | 7 (7.0) | 24 (24.0) | 46 (46.0) |
| Residence of rural area | |||
| Yes | 56 (56.0) | 79 (79.0) | 81 (81.0) |
| No | 44 (44.0) | 21 (21.0) | 19 (19.0) |
| What kind of bread do you eat the most? | |||
| Sangak | 26 (26.0) | 46 (46.0) | 55 (55.0) |
| Lavash | 74 (74.0) | 54 (54.0) | 45 (45.0) |
| You consume pickles several times | |||
| No | 10 (10.0) | 23 (23.0) | 26 (26.0) |
| Monthly | 10 (10.0) | 31 (31.0) | 28 (28.0) |
| Weekly | 32 (32.0) | 31 (31.0) | 30 (30.0) |
| Daily | 48 (48.0) | 15 (15.0) | 16 (16.0) |
| Do you add salt to food at the table | |||
| No | 8 (8.0) | 16 (16.0) | 19 (19.0) |
| Yes | 92 (92.0) | 84 (84.0) | 81 (81.0) |
| Do you eat red meat for a month? | |||
| No | 49 (49.0) | 81 (83.7) | 84 (84.9) |
| Yes | 51 (51.0) | 17 (17.3) | 15 (15.1) |
| Do you eat fish meat for a month? | |||
| No | 45 (45.0) | 40 (40.0) | 42 (42.0) |
| Yes | 55 (55.0) | 60 (60.0) | 58 (58.0) |
| How do you eat more food? | |||
| Boiled | 27 (27.0) | 66 (66.0) | 54 (54.5) |
| Fried | 73 (73.0) | 34 (34.0) | 45 (45.0) |
| Have you consumed alcohol in a month? | |||
| No | 28 (41.0) | 69 (73.0) | 64 (76.0) |
| Yes | 41 (59.0) | 25 () | 20 (34.0) |
| You ate fruit in your weekly diet | |||
| No | 57 (57.0) | 27 (27.0) | 25 (25.0) |
| Yes | 43 (43.0) | 73 (73.0) | 75 (75.0) |
| You ate vegetables in your weekly diet | |||
| No | 41 (41.0) | 20 (20.0) | 19 (19.0) |
| Yes | 59 (59.0) | 80 (80.0) | 81 (81.0) |
| You had rice in your weekly diet | |||
| No | 63 (63.0) | 81 (81.0) | 73 (73.0) |
| Yes | 37 (37.0) | 19 (19.0) | 27 (27.0) |
| Do you like hot food | |||
| No | 24 (24.0) | 56 (56.0) | 51 (51.0) |
| Yes | 76 (76.0) | 44 (44.0) | 49 (49.0) |
| Do you like spicy food? | |||
| No | 24 (24.0) | 56 (56.0) | 51 (51.0) |
| Yes | 76 (76.0) | 49 (49.0) | 44 (44.0) |
| What is the source of daily drinking water? | |||
| Urban water source | 41 (41.0) | 94 (94.0) | 90 (90.0) |
| Rural water source | 59 (59.0) | 6 (6.0) | 10 (10.0) |
| Eat broccoli for a month | |||
| No | 75 (75.0) | 46 (46.0) | 50 (50.0) |
| Yes | 25 (25.0) | 54 (54.0) | 50 (50.0) |
| Do you consume carbonated beverages such as soft drinks, delights, carbonated buttermilk | |||
| No | 22 (22.0) | 30 (30.0) | 32 (32.0) |
| Yes | 78 (78.0) | 70 (70.0) | 68 (68.0) |
| Type of blood type in case of blood test to determine blood type | |||
| A | 25 (26.3) | 33 (39.8) | 36 (41.9) |
| B | 9 (9.5) | 19 (22.9) | 23 (20.1) |
| O | 59 (62.1) | 29 (34.3) | 30 (34.9) |
| Ab | 2 (2.1) | 00 (00.0) | 7 (8.1) |
| Do you have a family history of cancer (types of cancers) | |||
| No | 42 (42.0) | 100 (100) | 00 (00.0) |
| Yes | 58 (58.0) | 00 (00.0) | 100 (100) |
| If so, what relationship do they have with you? | |||
| None | 42 (42.0) | 100 (100) | 00 (00.0) |
| First-degree relative | 35.0 (00) | 00 (00.0) | 43 (43.0) |
| 2nd-degree relatives | 23 (23.0) | 00 (00.0) | 57 (57.0) |
| Do you have a family history of stomach cancer? | |||
| Yes | 36 (36.0) | 00 (00.0) | 55 (55.0) |
| No | 64 (64.0) | 100 (100) | 45 (45.0) |
| If so, what relationship do they have with you? | |||
| None | 65 (65.0) | 100 (100) | 45 (45.0) |
| First-degree relatives | 22 (22.0) | 00 (00.0) | 13 (13.0) |
| 2nd-degree relatives | 13 (13.0) | 00 (00.0) | 42 (42.0) |
| Level of education | |||
| Illiterate | 62 (62.0) | 14 (14.0) | 11 (11.0) |
| Elementary/middle | 31 (31.0) | 64 (64.0) | 66 (66.0) |
| BSc | 7 (7.0) | 22 (22.0) | 23 (23.0) |
| Have you smoked more than 5 cigarettes a day in the last 10 years? | |||
| No | 32 (32.0) | 63 (63.0) | 73 (73.0) |
| Yes | 68 (68.0) | 37 (37.0) | 27 (27.0) |
a Control group 1: Control group who do not have a family history of cancer.
b Control group 2: The control group has a family history of cancer; first-degree relatives: Parents, siblings, uncles, aunts, uncles, aunts.
The odds ratio (OR, 95% CI) for the association between gastric cancer and prognostic factors is reported in Table 3. The results showed a significant inverse relationship between the monthly consumption of vegetables with gastric cancer versus the first (OR = 0.35, P = 0.001) and second control group (OR = 0.34, P = 0.001) and the consumption of broccoli with gastric cancer versus the first control group (OR = 0.36, P = 0.003) and second control (OR = 0.22, P = 0.001). The results indicated a significant difference of red meat consumption in the case group versus the first control (OR = 5.12, P = 0.001) and the second control (OR = 4.18, P = 0.040), and also consumption of black tea and gastric cancer versus the first control group (OR = 1.47, P = 0.001) and the second control group (OR = 1.44, P = 0.001). There was no significant relationship between pepper food interest (OR = 1.14, P = 0.648) and salt consumption (OR = 2.63, P = 0.069) with gastric cancer in the case group versus the first control group. In the case group versus the second control group, there was a statistically significant relationship between pepper food interest (OR = 1.17, P = 0.003) and salt consumption (OR = 2.38, P = 0.040) with gastric cancer (Table 3).
Table 3.
Association Between Stomach Cancer and Intake Food Groups of Interest Among Cases and Controls (Unadjusted Models)
| Variables | Control Group 1 a OR (95% CI) | P-Value | Control Group 2 b OR (95% CI) | P-Value |
|---|---|---|---|---|
| BMI | 1.06 (0.98, 1.15) | 0.071 | 1.03 (0.95, 1.11) | 0.068 |
| Number tea cups | 1.47 (1.26, 1.72) | 0.001 | 1.44 (1.25, 1.66) | 0.001 |
| Number egg (in month) | 1.00 (0.99, 1.01) | 0.872 | 1.00 (0.99, 1.01) | 0.872 |
| You have garlic intake (in month) | 0.99 (0.98, 0.99) | 0.029 | 0.98 (0.96, 0.99) | 0.005 |
| You have onion (in month) | 0.98 (0.96, 0.99) | 0.012 | 0.98 (0.96, 0.99) | 0.005 |
| Do physical activity in week (min) | 0.99 (0.98, 0.99) | 0.001 | 0.98 (0.98, 0.99) | 0.001 |
| Job | ||||
| Government job | 1 (baseline) | 1 (baseline) | ||
| Self-employ job | 1.84 (0.54, 6.20) | 0.327 | 1.20 (0.31, 5.02) | 0.310 |
| Unemployed | 23.66 (2.17, 25.65) | 0.009 | 12.52 (1.84, 85.59) | 0.010 |
| Farmer | 5.39 (1.24, 23.32) | 0.024 | 4.06 (0.17, 23.15) | 0.114 |
| Retired | 0.60 (0.13, 2.69) | 0.503 | 0.94 (0.28, 3.24) | 0.927 |
| Residence of rural area | 0.001 | 0.001 | ||
| No | 1 (baseline) | 1 (baseline) | ||
| Yes | 4.57 (1.02, 10.36) | 3.55 (1.70, 7.45) | ||
| What kind of bread do you eat the most? | 0.004 | 0.001 | ||
| Sangak | 1 (baseline) | 1 (baseline) | ||
| Lavash | 2.56 (1.33, 4.76) | 1.79 (1.39, 3.44) | ||
| You consume pickles several times | ||||
| No | 1 (baseline) | 1 (baseline) | ||
| Monthly | 1.00 (0.29, 3.39) | 0.998 | 0.48 (0.14, 1.62) | 0.240 |
| Weekly | 2.64 (0.82,8.53) | 0.104 | 2.16 (0.79, 5.86) | 0.132 |
| Daily | 8.59 (2.60, 28.37) | 0.001 | 12.97 (3.76, 44.76) | 0.001 |
| Do you add salt to food at the table | 0.069 | 0.040 | ||
| No | 1 (baseline) | 1 (baseline) | ||
| Yes | 2.36 (0.93, 7.14) | 2.38 (1.04, 5.55) | ||
| Do you eat red meat for a month? | 0.001 | 0.040 | ||
| No | 1 (baseline) | 1 (baseline) | ||
| Yes | 5.12 (2.40, 10.93) | 4.18 (2.17, 8.07) | ||
| Do you eat fish meat for a month? | 0.088 | 0.001 | ||
| No | 1 (baseline) | 1 (baseline) | ||
| Yes | 0.63 (0.37, 1.18) | 0.40 (0.23, 0.78) | ||
| How do you eat more food? | 0.001 | 0.001 | ||
| Boiled | 1 (baseline) | 1 (baseline) | ||
| Fried | 3.70 (1.84, 7.44) | 5.88 (2.78, 12.43) | ||
| Have you consumed alcohol in a month? | 0.613 | 0.010 | ||
| No | 1 (baseline) | 1 (baseline) | ||
| Yes | 1.19 (0.61, 2.31) | 2.88 (1.29, 6.43) | ||
| You ate fruit in your weekly diet | 0.001 | 0.001 | ||
| No | 1 (baseline) | 1 (baseline) | ||
| Yes | 0.33 (0.19, 0.60) | 0.34 (0.14, 0.54) | ||
| You ate vegetables in your weekly diet (mo) | 0.001 | 0.001 | ||
| No | 1 (baseline) | 1 (baseline) | ||
| Yes | 0.35 (0.10, 0.45) | 0.34 (0.14, 0.54) | ||
| You had rice in your weekly diet | 0.118 | 0.006 | ||
| No | 1 (baseline) | 1 (baseline) | ||
| Yes | 1.67 (0.88, 3.13) | 2.63 (1.32, 5.26) | ||
| Do you like hot food | 0.001 | 0.001 | ||
| No | 1 (baseline) | 1 (baseline) | ||
| Yes | 2.94 (1.59, 5.26) | 4.55 (2.22, 9.09) | ||
| Do you like spicy food? | 0.648 | 0.003 | ||
| No | 1 (baseline) | 1 (baseline) | ||
| Yes | 1.14 (0.63, 2.08) | 1.17 (1.13, 1.98) | ||
| What is the source of daily drinking water? | 0.001 | 0.001 | ||
| Urban water source | 1 (baseline) | 1 (baseline) | ||
| Rural water source | 11.33 (3.48, 36.89) | 12.67 (3.91, 14.03) | ||
| Eat broccoli for a month | 0.001 | 0.001 | ||
| No | 1 (baseline) | 1 (baseline) | ||
| Yes | 0.36 (0.19, 0.66) | 0.22 (0.10, 0.46) | ||
| Do you consumecarbonated beverages such as soft drinks, delights, carbonated buttermilk | 0.862 | 0.413 | ||
| No | 1 (baseline) | 1 (baseline) | ||
| Yes | 1.06 (0.54, 2.10) | 0.76 (0.40, 1.46) | ||
| Type of blood type in case of blood test to determine blood type | ||||
| A | 1 (baseline) | 1 (baseline) | ||
| B | 0.60 (0.19, 1.93) | 0.394 | 1.26 (0.41, 3.86) | 0.690 |
| O | 2.49 (1.09, 5.65) | 0.029 | 2.87 (1.33, 5.79) | 0.007 |
| AB | 0.00 (0.00, 0.00) | 1.000 | 0.48 (0.09, 2.53) | 0.391 |
| Level of education | ||||
| Illiterate | 1 (baseline) | 1 (baseline) | ||
| Elementary/middle | 0.35 (0.16, 0.78) | 0.010 | 0.32 (0.14, 0.77) | 0.010 |
| BSc | 0.09 (0.03, 0.33) | 0.001 | 0.98 (0.98, 0.99) | 0.001 |
| Have you smoked more than 5 cigarettes a day in the last 10 years? | 0.001 | 0.001 | ||
| No | 1 (baseline) | 1 (baseline) | ||
| Yes | 4.44 (2.16, 9.16) | 1.05 (1.03, 1.08) |
a Control group 1: Control group who do not have a family history of cancer.
b Control group 2: The control group has a family history of cancer; first-degree relatives: Parents, siblings, uncles, aunts, uncles, aunts; Odds estimation in conditional logistic regression model a significance level of 0.05, unadjusted conditional logistic regression model.
5. Discussion
The results showed that the weekly consumption of vegetables and fruits plays a vital role in preventing gastric cancer, aligning with some meta-analysis studies (11, 15, 16). The main reasons for consuming fruits to avoid stomach cancer are generally unknown. Galan et al. and Bravi et al. showed that low or no fiber in the diet increases the risk of gastric cancer. In addition, vegetables can kill bacteria and Helicobacter pylori infection (17, 18). Natural compounds such as dietary fiber, vitamin C, and chemicals in fruits and vegetables may act as detoxifiers, reducing the risk of stomach cancer.
The monthly consumption of broccoli and the monthly consumption of garlic is inversely related to gastric cancer. Some previous studies have reported an inverse relationship between broccoli consumption and garlic consumption, which was in line with some studies (1, 19). Regular consumption of broccoli and garlic reduces gastritis (20), which affects protection against mucositis (1) and reduces stomach cancer. The results showed that the consumption of red meat has a statistically significant relationship with gastric cancer. The present finding was in line with systematic review and meta-analysis studies (21, 22). Red meat had more sales and consumption than white meat in developing countries (23, 24). Studies have shown that red meat plays a vital role in the formation of endogenous N-nitroso (NOCs), and N-nitroso (NOC) significantly affects cancer formation (24).
Conditional logistic regression results showed that people who smoked and drank alcohol were more likely to develop gastric cancer. Some previous studies have shown a direct link between gastric cancer and alcohol and smoking (3, 25-27). Prolonged smoking and continued alcohol consumption can damage the gastric mucosa and cause stomach ulcers. In addition, a high correlation was reported between gastric cancer and an ulcer (28, 29). The interaction of risk factors for smoking and alcohol consumption with a gastric ulcer significantly affects gastric cancer, which requires further epidemiological and analytical studies.
The results showed that people with blood type O had a higher chance of gastric cancer than blood type A. The present finding was consistent with previous studies (30, 31). Previous studies have shown a strong and direct relationship between H. pylori infection and gastric cancer (32, 33). According to studies, the prevalence of H. pylori infection in blood group O is higher than in other blood groups (30, 34). The expression of H antigen in blood group O may increase the risk of H. pylori infection by expressing the H gene in gastro duodenal mucosal cells (35). Therefore, more studies are needed on the relationship between the expression of different genes with H. pylori infection and gastric cancer.
The results of conditional logistic regression showed that frequent consumption of pickles/daily increased the risk of gastric cancer. Previous studies, in line with the results of the present study, have reported the consumption of secretions as a risk factor for gastric cancer (11, 36, 37). Regular vinegar and salt consumption in pickles caused mucosal ulcers and gastritis (37). Studies have shown a strong relationship between gastric ulcers and gastric cancer (6, 28). Therefore, further studies are needed to determine the relationship between the consumption of pickles and salt with gastric ulcers.
This study showed that people whose jobs were farmers were more likely to develop gastric cancer than employees. Farmers may be more likely to develop stomach cancer because they use chemicals such as chemical fertilizers and sprays, which requires further study. Naghipour et al. evaluated the factors affecting gastric cancer (390 patients and 780 controls) and showed a direct relationship between gastric cancer and the employment status factor (6).
Many studies have accepted family history as a risk factor, including Ellison-Loschmann et al. (3). The results showed a direct relationship between family history and patients. According to Song et al., who examined the risk factors for gastric cancer, family history was introduced as a risk factor (38). The present study divided the control subjects into two groups of people who have a family history and no family history. People with a family history and who have lived in a rural for at least ten years were more likely to get stomach cancer than people who do not have a family history. Rural area is a factor of cancer, so farmers in rural areas may have a greater risk of contracting the disease. Farmers with a family history may have dealt with more toxins and chemicals than those without one. Further study is needed to investigate further for this factor.
Some patients refused to answer the questionnaire due to a lack of conditions. Despite H. pylori being one of the factors influencing gastric cancer, there were no labs for testing H. pylori and gastric ulcers.
5.1. Conclusions
The data were analyzed using conditional logistic regression with control of age and sex variables. The results showed that many variables such as smoking, blood type, job, red meat, pickle, hot food, salt, alcohol, and black tea were risk factors, and variables such as education, vegetables, fruit, fish, physical activity, broccoli, and garlic were the preventive factors for gastric cancer. Therefore, healthcare organizations and policymakers are expected to reduce the incidence of gastric cancer through interventions such as awareness and promoting proper diet in the community.