
1. Background
Cardiovascular disease (CVD) encompasses several conditions, including heart and blood vessel diseases, coronary heart disease, cerebrovascular disease, rheumatic heart disease, and other issues. The causes of death attributed to them account for 17.9 million deaths annually (1). According to studies, infectious agents may potentially have a role in CVD evolution by serving as pro-inflammatory stimuli or infiltrating and destroying cardiovascular tissue. Herpesviruses were initially suggested as potential CVD risk factors. Cytomegalovirus and herpes simplex viruses (HSV) have particular interests in herpesviruses because of their extensive frequency and capacity to infect human vascular endothelial cells and smooth muscle cells (2).
Viral serology is performed by measuring the levels of specific IgG antibodies or virus-specific IgM antibodies. Many point-of-care tests are used in diagnostic settings for antigens and antibodies (3). Asymptomatic individuals in high-prevalence areas may benefit from these serological tests. In addition, type-specific HSV serologies indicate susceptibility to infection by HSV in pregnant women and confirm a diagnosis in a patient with negative HSV cultures (4).
Herpes simplex viruses, double-stranded DNA viruses, are also called human alphaherpesviruses and belong to the family herpesviridae, subfamily Alphaherpesvirinae, and the genus simplexvirus (5). Human herpes virus 1 (HHV-1) and (HHV-2) replicate in the nucleus of infected cells, infect epithelial cells and fibroblasts, and move by retrograde transport to sensory neurons to develop latent infection (6, 7).
Herpes simplex viruses is primarily transferred by direct contact with infected blister fluid, and the initial infection can happen at any age (8). Most commonly, mucocutaneous lesions, also known as cold sores or fever blisters, form on or near the lips as a result of HSV infection. Such lesions might appear everywhere the virus has been infected, Herpes whitlow lesions on the fingers, herpes lesions on the eye’s cornea (keratitis), and herpes genitalis lesions on the genitalia (9). Corneal blindness is most commonly caused by HSV-1 worldwide (10, 11). Herpes simplex viruses-2 causes most genital HSV infections, but HSV-1 rises number of less severe and prone cases (12). The virus can also spread to the central nervous system, causing encephalitis (9).
In 2016, an estimated 491.5 million people were infected with HSV type 2, accounting for 13.2% of the global population aged 15 - 49. Approximately 3.752 billion people were infected with HSV-1 globally, equating to a worldwide incidence of 66.6% in people aged 0 - 49. Herpes simplex viruses type 2 prevalence was highest among women and in the WHO African Region, with different patterns identified by age, sex, and geographical region (13).
HIV infection is three times more likely in people with HSV-2 infection. As a result of abnormalities in the skin and mucosa, genital sores facilitate the transmission of HIV. Herpes simplex viruses-2 infection may hasten HIV illness and increase the viral load. Acyclovir has been demonstrated to reduce HIV progression in those who are HIV and HSV-2 co-infected (12).
Herpes simplex viruses subtypes 1 and 2 are rarely transmitted transplacentally. Microcephaly, intracranial calcifications, intrauterine growth restriction, non-immune fetal hydrops, and intrauterine death are severe fetal abnormalities associated with congenital infection during the first trimester (14). Most newborn HSV infections are acquired after birth, resulting in significant morbidity and mortality, mainly when the infection is spread or affects the central nervous system (15, 16). Herpes simplex viruses is one of the viral agents involved in TORCH syndrome as one of the leading causes of neonatal and infant deaths (17, 18).
No vaccinations are authorized, but viral latency hampers vaccine research (19). Acyclic guanosine analogs, acyclic nucleotide analogs, and pyrophosphate analogs are the three kinds of medications licensed to treat HSV infections, which target viral DNA replication. Valacyclovir (VCV), cidofovir, and foscarnet are examples of drugs from these three types. Herpes simplex viruses has been treated with ACV (9-(2-hydroxyethoxymethyl) guanine) since the 1980s (20). Nonetheless, long-term usage of these anti-herpes medications sometimes results in significant side effects and drug-resistance strains (21).
2. Objectives
This study aims to discover the seroepidemiological relationship between herpes simplex virus type one and two in cardiovascular patients in Mashhad, Iran, through a case-control study.
3. Methods
3.1. Study Samples
The study samples included 236 people aged 35 - 65 in Mashhad, Khorasan Razavi province, Iran. Thus, 118 cardiovascular patients and 118 healthy participants with no signs of cardiovascular disease participated in this study. The cardiovascular patients included those with heart attacks, strokes, or stable angina. Previously, a questionnaire assessed the likelihood of cardiovascular disease, and if it was positive, a specialist examined the patient. Under the expert’s supervision, paraclinical methods such as echocardiography or electrocardiography were used to ensure the disease in urgent cases. Moreover, serum samples of 118 people with no cardiovascular disease symptoms were randomly selected as the control group.
3.2. Data Collection
A questionnaire was used to collect demographic information such as age, gender, employment, cardiovascular disease, and BMI. All participants signed an informed consent form from the Mashhad University of Medical Sciences Ethics Committee.
3.3. Specimen Testing
Peripheral blood was collected using anticoagulant-free tubes. The samples were centrifuged at 3000 RPM for 5 minutes after clotting. The separated serum was kept in labeled tubes at -70°C for testing. The presence of antibodies (IgM, IgG) was determined using the ELISA technology, which was commercially available and followed the guidelines of Euroimmun, Germany. Following the manufacturer’s recommendations, the cut-off value was computed after reading the plates.
The biochemical blood index included fasting blood sugar (FBS), low-density lipoprotein (LDL), high-density lipoprotein (HDL), cholesterol, triglycerides, high-sensitivity C-reactive protein (hs-CRP), and aspartate aminotransferase (AST) were analyzed to examine their relationship to the level of HSV antibodies.
3.4. Statistical Analysis
The data were analyzed in SPSS software version 20. The chi-square test was used to examine the relationship between the frequency of HSV type 1 and 2 and qualitative variables (such as heart disease, occupation, and gender). The quantitative data (age and BMI) were expressed as mean ± standard deviation (SD), and the comparisons of mean values between the groups were performed by t-test. The significance level of the tests was considered less than 0.05
The protocol of this research was confirmed by the Ethics Committee of Mashhad University of Medical Sciences (code: IR.MUMS.fm.REC.1396.72).
4. Results
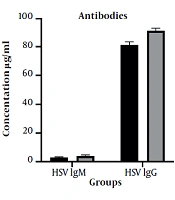
A total of 236 patients were studied, including 118 patients with cardiovascular disease and 118 healthy controls. All participants tested negative for HSV IgM. The prevalence of HSV IgG in the cardiovascular group was 48.8%, while 51.2% was in the control group. Herpes simplex viruses IgG prevalence did not change substantially between the two research groups. The participants were 35 to 65, and the mean age in the case and control groups was 52 ± 5.3 and 50.67 ± 6.98 years, respectively, which was not significant (independent t-test; P = 0.1). Further, 47.5% of the patients were male, while 39% of those in the control group. Both groups had similar gender distributions, and there was no significant difference between them. The prevalence of employment was 31.4% in the case group and 28.8% in the control group. Therefore, the job variable was not significantly different between the two groups and the control (Table 1).
Table 1.
Demographic Information and Antibody Comparison in the Study Groups a
| Factor | Case Group | Control Group | P-Value b |
|---|---|---|---|
| Sex | 0.189 | ||
| Male | 56 (47.5) | 46 (39) | |
| Female | 62 (52.5) | 72 (61) | |
| Occupation | 0.589 | ||
| Employed | 37 (31.4) | 34 (28.8) | |
| Unemployed | 63 (53.4) | 60 (50.8) | |
| Retired | 18 (15.3) | 24 (20.3) | |
| HSV IgG | 0.253 | ||
| Positive | 105 (48.8) | 110 (51.2) | |
| Negative | 13 (61.9) | 8 (31.8) |
Abbreviation: HSV, herpes simplex viruses.
a Values are expressed as No. (%).
b Chi-square test.
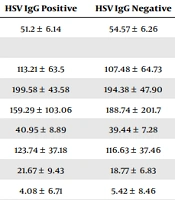
The serum of 215 participants tested positive for HSV IgG, whereas the serum of the remaining 21 subjects tested negative. There was a statistically significant difference between HSV IgG positive and HSV IgG negative people in terms of their mean ages. According to an independent t-test, the frequency of HSV IgG was not significantly connected to any of the variables of the biochemical blood index (Table 2).
Table 2.
The Relationship Between Quantitative Data and Herpes Simplex Viruses IgG Presence a
| Factor | HSV IgG Positive | HSV IgG Negative | P-Value b |
|---|---|---|---|
| Age | 51.2 ± 6.14 | 54.57 ± 6.26 | 0.012 |
| Biochemical index | |||
| FBS | 113.21 ± 63.5 | 107.48 ± 64.73 | 0.694 |
| Cholesterol | 199.58 ± 43.58 | 194.38 ± 47.90 | 0.606 |
| Triglyceride | 159.29 ± 103.06 | 188.74 ± 201.7 | 0.516 |
| HDL | 40.95 ± 8.89 | 39.44 ± 7.28 | 0.452 |
| LDL | 123.74 ± 37.18 | 116.63 ± 37.46 | 0.404 |
| AST | 21.67 ± 9.43 | 18.77 ± 6.83 | 0.285 |
| hs-CRP | 4.08 ± 6.71 | 5.42 ± 8.46 | 0.397 |
| BMI | 28.75 ± 4.76 | 29.42 ± 4.6 | 0.535 |
Abbreviations: HSV, herpes simplex viruses; FBS, fasting blood sugar; HDL, high-density lipoprotein; LDL, low-density lipoprotein; AST, aspartate aminotransferase; hs-CRP, high-sensitivity C-reactive protein.
a Values are expressed as mean ± SD.
b Independent t-test.
There was no significant variation in the prevalence of HSV IgG in persons with various work statuses. In addition, the frequency of HSV IgG in men and women was comparable with no statistical differences (Table 3).
Table 3.
The Relationship Between Qualitative Data and Herpes Simplex Viruses IgG Presence a
| Factor | HSV IgG Positive | HSV IgG Negative | P-Value b |
|---|---|---|---|
| Sex | 0.67 | ||
| Male | 92 (42.8) | 10 (47.6) | |
| Female | 123 (57.2) | 11 (52.4) | |
| Occupation | 0.866 | ||
| Employed | 65 (30.2) | 6 (28.6) | |
| Unemployed | 111 (51.6) | 12 (57.1) | |
| Retired | 39 (18.1) | 3 (14.3) |
Abbreviation: HSV, herpes simplex viruses.
a Values are expressed as No. (%).
b Chi-square test.
5. Discussion
This study showed that HSV IgG was found in 48.8% of the cardiovascular and 51.2% of the control groups with no significant differences between the two research groups. In addition, persons with heart disease are 0.587 times more likely than controls to have HSV IgG positive (odds ratio (OR) = 0.587). Furthermore, only the mean age of HSV IgG positive and HSV IgG negative persons had a significant difference among the variables analyzed. In contrast, the other variables in this comparison showed no statistical difference.
Consistebt with the present study, Sorlie et al. investigated the link between CMV and HSV-1 antibody levels and risk of cardiovascular disease. There was no significant relationship between anti-HSV-1 antibodies and the incidence of coronary heart disease (CHD) (relative risk (RR) = 0.77) for five years for cardiovascular disease. However, there was an essential link between CMV anti-virus antibody levels in the blood and CHD (RR = 1.76) (22).
Vahdat et al. examined the relationship between IgG antibodies against HSV-1 or increased CRP and electrocardiogram-defined coronary artery disease (CAD) in 1,754 patients aged 25 and up in Bushehr, Iran. Herpes simplex viruses-1 did not show a significant relationship with electrocardiogram-defined CAD after controlling for sex and age. In addition, concurrent elevated CRP levels and HSV-1 IgG were related to the prevalence of electrocardiogram-defined CAD in the general population after adjusting for multiple risk factors such as age, sex, and metabolic syndrome components (23).
As reported in Chiu et al., HSV-1, CMV, and chlamydia pneumoniae was detected in atherosclerotic plaques. The avidin-biotin-peroxidase method was used to stain endarterectomy specimens from 76 individuals with carotid artery stenosis for C. pneumoniae, CMV, and HSV-1. Chlamydia pneumoniae was found in 71% of the atherosclerotic plaques studied, CMV 35.5 %, and HSV-1 10.5%. However, no significant association was found between HSV-1 presence and atherosclerosis plaques (P = 0.09) (24).
Jafarzadeh et al. evaluated HSV-antibodies in 160 ischemic heart disease patients (60 unstable angina (UA) patients and 60 acute myocardial infarction (AMI) patients) in Rafsanjan, Iran. Anti-HSV-1 antibody seroprevalences were significantly more remarkable in the sick group than in the healthy control group. Anti-HSV-2 seroprevalence, on the other hand, was similar in both ill and healthy people. There was no discernible difference between the AMI and UA groups (25).
Siscovick et al. investigated the link between serology against HSV-1 and CMV cardiovascular disease in a cohort study in the United States of people aged ≥ 65 years. The presence of IgG antibodies to HSV-1 was related to a 2-fold increase in the risk of incident myocardial infarction (MI) and CHD death in older individuals ((OR) 2.0), but the presence of IgG antibodies to CMV was not linked to risk (26). In comparison, people with heart disease are 0.587 times more likely than those in the control group to have HSV IgG positive in this odds ratio (OR = 0.587).
Chiang et al. in a Taiwanese population-based dataset looked into the relationship between HSV infection and atrial fibrillation (AF). Over the period of January 2000 to December 2003, 15,180 patients with HSV infection in the study group and 73,197 patients were studied without HSV infection in the control group. A total of 240 patients in the study group (1.6%) and 801 patients in the comparator group (1.1%) experienced new AF throughout the 3-year follow-up period. The log-rank test revealed that patients who had HSV had a significant risk of developing AF than those who did not (P < 0.001) (27).
Mendy et al. studied 14,415 participants with an average of 34.3 from 1999 to 2010 in the USA. Enzymatic immunodot assays were used to assess serum IgG-antibodies to HSV, and CVD was self-reported. The frequency of CVD was 1.8%; 51.3% of individuals had HSV-1 infection, 7.5% had HSV-2 infection, and 15.2% had both. According to the findings, positive serology to HSV-2 (OR: 2.00) but not to HSV-1 is related to CVD before age 50 (2).
Wu et al. conducted a similar study with a comprehensive structure review and meta-analysis. HSV-1 and HSV-2 infection with the risk of atherosclerosis were evaluated in China. The meta-analysis included 17 papers on HSV-1 infection at risk of atherosclerosis, and seven papers on HSV-2 infection at risk of atherosclerosis. Patients infected with HSV-1 have a significantly increased risk of atherosclerosis (OR = 1.77). Patients with HSV-2 disease are also significantly at risk for atherosclerosis (OR = 1.37). This meta-analysis concluded that any type of herpes simplex infection increases the risk of atherosclerosis (28).
However, the concept that HSV plays a role in CVD is still debatable. The reason for the conflict between the findings of this comprehensive review and the present study is the small sample size. However, the conclusions of the mentioned studies differ. Several factors may affect the results, including the type of cardiovascular disease included in the sample, the sample size, and the distribution of HSV-1 and HSV-2 in every region. This study did not consider time or environmental factors that may influence a virus's ability to cause CVD, as well as its life cycle.
5.1. Conclusions
A significant difference was not observed between study groups regarding the prevalence of IgG antibodies against herpes simplex. Although patients with positive IgG antibodies had lower mean ages than those with negative IgG antibodies, they did not differ in gender or occupation.