
1. Background
Preterm birth (birth before 37 weeks of pregnancy) is divided into very early preterm birth (before 32 weeks), early preterm birth (32 - 34 weeks), and late preterm birth (34 - 37) (1). The preterm birth rate is increasing worldwide; 15 million preterm births are reported annually worldwide, with 1.1 million deaths as the main side effect. Every year in Iran, nearly 14,000 neonates are lost, among whom maternal age of above 35 years, premature rupture of the membranes, bleeding, gestational hypertension, history of premature birth, abortion, multiple pregnancy, and preeclampsia is more significantly observed compared with term neonates (2). Premature birth is one of the leading causes of perinatal mortality. The prevalence of premature birth ranges from 5 to 18% worldwide (3). As a developing country, Iran has a high prevalence of premature birth, ranging between 5.4% in Bam to 19.85% in Tehran (4, 5). Some medical conditions, such as gestational hypertension and preeclampsia, are among the risk factors for premature birth (6). On the other hand, blood pressure disorders in pregnancy are also related to premature birth, fetal growth restriction, placental abruption, intrauterine death, and maternal mortality and morbidity (7). Preterm birth is one of the common complications of preeclampsia.
As a result of placental insufficiency during pregnancy, preeclampsia affects the fetus, putting it at risk of intrauterine growth restriction (5). Severe preeclampsia is defined as high blood pressure (i.e., BP > 160-170/100-110), heavy proteinuria of > 3 – 5 g/24 h, and/or the presence of symptoms, such as headache or visual disturbances (8). Severe preeclampsia is associated with maternal and neonatal health consequences (9).
In a study on 17,933 stillbirths, 9.2% of pregnancies were associated with gestational hypertension. In addition, a meta-analysis study in 2016 showed that the overall prevalence of preeclampsia in Iran was estimated at 0.05 (95% CI: 0.05, 0.06) (10). Studies suggest continuous prenatal care in the hospital prevents premature delivery in pregnancies with hypertension disorders. Moreover, providing specialized care to these women’s infants reduces complications and infant mortality in the case of their premature birth (11). The neonatal mortality rate is a vital health index, which directly affects the mortality indices of infants and children under 5 (12). The infant mortality rate is often a standard indicator for assessing countries' health and social care development. Premature birth imposes significant and adverse effects on the economy, the health care system, and society (13). The worldwide incidence of neonatal and maternal mortality due to severe preeclampsia ranges between 50,000 to 100,000. The highest prevalence is observed in developing countries due to insufficient care during pregnancy (14).
Neonatal outcomes seem to be more severe in the presence of gestational hypertension in women with preterm birth. Studies have shown a higher incidence of disorders, such as respiratory distress syndrome, necrotizing enterocolitis, and other adverse outcomes in neonates born to hypertensive mothers with preterm labor (15, 16). The findings indicate that more research is necessary to improve neonatal outcomes.
2. Objectives
This study aims to evaluate the effect of severe preeclampsia on the mortality and morbidity of neonates under 34 weeks at discharge.
3. Methods
This study was conducted at Alzahra Tertiary Care Hospital from October 2019 to 2021. The hospital is in a densely populated city, where high-risk pregnancies are often admitted. The pediatrics department had two central wards: The Premature Neonates Unit and the Neonatal Intensive Care Unit. There are 50 patient beds in the two wards, and the neonatal intensive care unit has 10 beds.
Participants were selected through convenient sampling. The minimum sample size was calculated to be 91 neonates in each group based on Saadat et al. (the rate of cesarean section in two groups) (17) using the following formula (P1 = 0.3, P2 = 0.13, α = 0.05, β = 0.2).
All singleton neonates between the gestational age of 25 weeks to 33 weeks + 6 days, whose medical records were registered on the neonatal registry book from October 2019 to 2021 in the hospital, were included. The exclusion criteria included infants older than 28 days and revisit and multifetal pregnancies.
In the current study, severe preeclampsia is defined as preeclampsia in combination with at least one of the following criteria:
(1) Clinical symptoms including headache or visual disturbances and/or epigastric pain,
(2) Abnormal Laboratory tests, including thrombocytopenia (< 100 × 109/L) and/or abnormal liver function tests aspartate transaminase/alanine transaminase ≥ 40 U/L, and lactate dehydrogenase ≥ 600 U/L,
(3) Severe hypertension (systolic blood pressure ≥ 160 mm Hg and/or diastolic blood pressure ≥ 110 mm Hg).
The data were collected by three trained healthcare personnel with working experience in the hospital. The data collection form included demographic information, maternal and fetal risk factors, delivery mode, gestational age, birth weight, sex, preterm birth cause (iatrogenic, spontaneous), fetal growth restriction, fetal distress (impaired biophysical profile, impaired Doppler, meconium excretion), placental abruption, corticosteroid injection history before birth, Apgar scores, respiratory distress syndrome, mechanical ventilation, surfactant administration, brain ultrasound findings (e.g., bleeding in the germinal matrix, intraventricular hemorrhage, cerebral parenchymal hemorrhage, periventricular leukomalacia, hydrocephalus), prematurity retinopathy, prematurity anemia (hematocrit < 30%), neonatal death and short-term neonatal complications, such as pulmonary hemorrhage, hyperglycemia (blood sugar > 200 mgr./dL), hypoglycemia (blood sugar < 47 mgr./dL), electrolyte disorders, necrotizing enterocolitis. Experts assessed the content validity of the data collection form, and the content validity ratio and content validity index were 0.90 or above.
Data for some variables was missing because of incomplete medical records. Cases with the missing data were omitted, and the remaining data were analyzed. The collected data were imported into SPSS software version 25. Descriptive statistics were expressed as mean ± standard deviation and frequency (%). The Chi-square and Fisher's exact tests were used to analyze the relationships between nominal scale variables. The neonatal outcomes of severe preeclampsia were examined using multivariate logistic regression.
4. Results
A total of 373 preterm neonates were eligible for analysis, 62 of whom were excluded, 57 due to multifetal pregnancies, three due to revisiting, and two due to admission from outside the hospital. Finally, 311 neonates were analyzed, of whom 113 neonates were born to mothers with preeclampsia (Group 1), and 198 were born to mothers without preeclampsia (Group 2). The mean maternal age was 32.22 ± 6.43 years in Group 1 and 30.25 ± 6.16 years in Group 2. Group 1 and Group 2's mean gestational age was 30.52 ± 2.47 and 30.81 ± 2.22 weeks, respectively. The mean birth weight of neonates was 1473.63 ± 597.08g in Group 1 and 1700.80 ± 465.82g in Group 2 (i.e., mean difference 227g, P = 0.001). The neonatal mortality rates in Group 1 and Group 2 were 17.7% and 7.6%, respectively. Table 1 shows the Maternal and neonatal characteristics of preterm neonates with and without maternal preeclampsia. Bold values represent the significant results (Table 1).
Table 1.
Maternal and Neonatal Characteristics of Preterm Neonates of Mothers with and Without Preeclampsia a
| Variables and Categories | Severe Preeclampsia (Group 1) (N = 113) | No Preeclampsia (Group 2) (N = 198) | P-Value b |
|---|---|---|---|
| Maternal age c | 0.025 | ||
| < 35 | 70 (32.6) | 145 (67.4) | |
| ≥ 35 | 40 (46.5) | 46 (53.5) | |
| Infertility | 0.017 | ||
| Yes | 30 (50) | 30 (50) | |
| No | 83 (33.1) | 168 (66.9) | |
| History of in vitro fertilization | 0.006 | ||
| Yes | 19 (59.4) | 13 (40.6) | |
| No | 94 (33.7) | 185 (66.3) | |
| History of abortion | 0.894 | ||
| Yes | 31 (37.3) | 52 (62.7) | |
| No | 82 (36) | 146 (64) | |
| History of stillbirth | 0.677 | ||
| Yes | 11 (40.7) | 16 (59.3) | |
| No | 102 (35.9) | 182 (64.1) | |
| Diabetes | 0.343 | ||
| Yes | 32 (41) | 46 (59) | |
| No | 81 (34.8) | 152 (65.2) | |
| Gestational age | 0.287 | ||
| ≤ 28 weeks | 27 (42.9) | 36 (57.1) | |
| 29 – 32 weeks | 50 (32.3) | 105 (67.7) | |
| ≥ 33 weeks | 36 (38.7) | 57 (61.3) | |
| Mode of delivery | < 0.001 | ||
| Vaginal birth | 20 (20) | 76 (80) | |
| Cesarean section | 93 (43) | 122 (57) | |
| Sex | 0.056 | ||
| Female | 59 (41.7) | 81 (58.3) | |
| Male | 54 (30.8) | 117 (69.2) | |
| Birth weight | 0.095 | ||
| < 2500 gr | 104 (34.7) | 192 (65.3) | |
| ≥ 2500 gr | 9 (57.1) | 6 (42.9) | |
| Congenital malformation | 0.366 | ||
| Yes | 10 (45.5) | 12 (54.5) | |
| No | 103 (35.6) | 186 (64.4) | |
| Fetal growth restriction | < 0.001 | ||
| Yes | 34 (64.2) | 19 (35.8) | |
| No | 79 (30.6) | 179 (69.4) | |
| Fetal distress | 0.004 | ||
| Yes | 28 (54.9) | 23 (45.1) | |
| No | 85 (32.7) | 175 (67.3) | |
| Meconium | 0.672 | ||
| Yes | 10 (40) | 15 (60) | |
| No | 103 (63) | 183 (64) | |
| 1-min Apgar score | 0.138 | ||
| < 7 | 46 (42.2) | 63 (57.8) | |
| ≥ 7 | 67 (33.2) | 135 (66.8) | |
| 5-min Apgar score | 0.103 | ||
| < 7 | 15 (51.7) | 14 (48.3) | |
| ≥ 7 | 98 (34.8) | 184 (65.2) | |
| Admission | 0.476 | ||
| Premature unit | 61 (34.5) | 116 (65.5) | |
| NICU | 52 (38.8) | 82 (61.2) | |
| Oligohydramnios | 0.257 | ||
| Yes | 15 (45.5) | 18 (54.5) | |
| No | 98 (35.3) | 180 (64.7) | |
| Polyhydramnios | 0.715 | ||
| Yes | 2 (25) | 6 (75) | |
| No | 111 (36.6) | 192 (63.4) | |
| Electrolyte disorder c | 0.082 | ||
| Yes | 47 (37) | 106 (69.3) | |
| No | 53 (40.8) | 77 (59.2) | |
| Hyperglycemia c | 0.490 | ||
| Yes | 5 (55.6) | 4 (44.4) | |
| No | 53 (40.8) | 77 (59.2) | |
| Hypoglycemia c | > 0.999 | ||
| Yes | 6 (42.9) | 8 (57.1) | |
| No | 53 (40.8) | 77 (59.2) | |
| Magnesium sulfate administration | < 0.001 | ||
| Yes | 81 (54.4) | 68 (45.6) | |
| No | 32 (19.8) | 130 (80.2) | |
| Surfactant administration | 0.272 | ||
| Yes | 32 (42.1) | 44 (57.9) | |
| No | 81 (34.5) | 154 (65.5) | |
| Mechanical ventilation | 0.340 | ||
| Yes | 70 (38.7) | 111 (61.3) | |
| No | 43 (33.1) | 87 (66.9) | |
| Retinopathy of prematurity c | 0.508 | ||
| Yes | 5 (50) | 5 (50) | |
| No | 52 (61.9) | 32 (38.1) | |
| Necrotizing enterocolitis | > 0.999 | ||
| Yes | 2 (33.3) | 4 (66.7) | |
| No | 111 (36.4) | 194 (63.6) | |
| Neural tube defect | 0.138 | ||
| Yes | 3 (75) | 1 (25) | |
| No | 110 (35.8) | 197 (64.2) | |
| Sepsis | 0.807 | ||
| Yes | 6 (31.6) | 13 (68.4) | |
| No | 107 (36.6) | 185 (63.4) | |
| Anemia of prematurity c | 0.159 | ||
| Yes | 41 (40.2) | 61 (59.8) | |
| No | 62 (31.6) | 134 (68.4) | |
| Cerebral hemorrhage c | 0.047 | ||
| Yes | 9 (22.5) | 31 (77.5) | |
| No | 75 (39.9) | 113 (60.1) | |
| Neonatal mortality | 0.009 | ||
| Survived | 93 (33.7) | 183 (66.3) | |
| Dead | 20 (57.1) | 15 (42.9) |
Abbreviation: NICU, Neonatal Intensive Care Unit.
a Values are presented as No. (%).
b Chi-square or Fisher exact test.
c Variables with missing data.
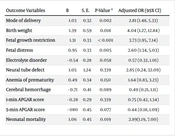
Logistic regression analysis showed that the risk of cesarean section (P = 0.002, OR = 2.81), low birth weight (P = 0.018, OR = 4.04), Fetal growth restriction (FGR) (< 0.001, OR = 3.73), Fetal distress (FD) (P = 0.005, OR = 2.60), and mortality (P = 0.019, OR = 2.89) was significantly higher in neonates of mothers with preeclampsia following the adjustment of maternal age, history of in vitro fertilization, neonate sex, and gestational age (Table 2).
Table 2.
Logistic Regression Analysis for Neonatal Outcomes
| Outcome Variables | B | S. E. | P-Value a | Adjusted OR (95% CI) |
|---|---|---|---|---|
| Mode of delivery | 1.03 | 0.32 | 0.002 | 2.81 (1.48, 5.33) |
| Birth weight | 1.39 | 0.59 | 0.018 | 4.04 (1.27, 12.84) |
| Fetal growth restriction | 1.31 | 0.33 | < 0.001 | 3.73 (1.95, 7.14) |
| Fetal distress | 0.95 | 0.33 | 0.005 | 2.60 (1.34, 5.03) |
| Electrolyte disorder | - 0.54 | 0.28 | 0.058 | 0.57 (0.32, 1.01) |
| Neural tube defect | 1.05 | 1.24 | 0.339 | 2.85 (0.24, 32.09) |
| Anemia of prematurity | 0.49 | 0.34 | 0.150 | 1.64 (0.83, 3.23) |
| Cerebral hemorrhage | - 0.71 | 0.41 | 0.089 | 0.49 (0.21, 1.11) |
| 1-min APGAR score | - 0.28 | 0.29 | 0.339 | 0.75 (0.42, 1.34) |
| 5-min APGAR score | - 080 | 0.45 | 0.077 | 0.44 (0.18, 1.09) |
| Neonatal mortality | 1.06 | 0.45 | 0.019 | 2.89(1.19, 7.00) |
a Multivariate logistic regression.
5. Discussion
The results showed higher rates of cesarean section, low birth weight, fetal growth restriction, and fetal distress among preterm neonates after adjusting for potential confounding variables (maternal age, history of In vitro fertilization, neonate sex, and gestational age). Moreover, fetal distress and mortality were associated with severe preeclampsia.
In this study, women with preeclampsia were 2.8 times more likely to have cesarean section than non-preeclamptic women, which is consistent with previous studies (18-20). In a recent study in Iran, the prevalence of cesarean section in women with preeclampsia was higher than those without preeclampsia (80.65% vs. 70.49%) (20). Similarly, the present study showed that cesarean section is more common in women with preeclampsia in preterm births. A survey in Chania showed that in early and moderate preterm births, the cesarean section rate is higher in women with gestational hypertension (21) since, in such situations, the physicians try to save the mother and the neonate by cesarean section. In addition, failure to respond to labor induction due to an unripe cervix in preterm births causes an increased rate of cesarean sections.
The mean birth weight of neonates of preeclamptic mothers was nearly 227 g less than neonates of non-preeclamptic mothers. In line with this finding, a study on severe preeclampsia showed that almost 40% of neonates of preeclamptic mothers had low birth weight (22). As gestational age at birth significantly affects birth weight, preeclampsia results in an earlier delivery, resulting in a lower birth weight rate.
The present study showed that FGR is much more prevalent in the preeclamptic group than in the preeclamptic group (30.1% vs. 9.6%). In this study, neonates of preeclamptic mothers were 3.7 times more likely to have FGR than neonates of non-preeclamptic mothers, consistent with a recent cohort study in Germany (22), resulting from impaired uteroplacental blood flow. Preeclampsia and FGR are known to be associated with placental infarctions; therefore, they are likely to be related (23, 24).
Respiratory distress syndrome is among the most common complications of preterm birth. According to the present findings, neonates of preeclamptic mothers had respiratory distress 2.6 times more than neonates of non-preeclamptic mothers. Consistent with the present study, previous studies have also shown that neonates of preeclamptic mothers more commonly suffer from respiratory distress syndrome (25-27). However, conflicting findings on the effect of preeclampsia on respiratory distress syndrome have been reported (14, 28).
The neonatal mortality rate is an essential indicator, which determines the neonatal health status of a country (29). The neonatal mortality rate at discharge in the preeclamptic and non-preeclamptic groups was 17.7% and 7.6%, respectively. This result is consistent with a retrospective study in Italy, which found neonatal mortality higher in hypertensive mothers (7). However, despite the same gestational age as Lu et al., they did not report a significantly different mortality rate in neonates of hypertensive and normotensive mothers (30). Due to different study populations, they might have considered pregnant women with gestational hypertension instead of mothers with preeclampsia.
5.1. Strengths and Limitations
This study examined neonatal outcomes in severe preeclampsia, for which there was little documentation. However, essential limitations should be considered when interpreting the findings. Since the study is retrospective, some confounding factors may not have been identified. However, it is still possible to detect significant differences between preterm neonates born to preeclamptic mothers compared to non-preeclamptic mothers. In addition, the status of the neonates was not followed until the age of 28 days. Therefore, the findings about neonatal mortality are inaccurate.
5.2. Conclusions
Based on the results, preeclampsia increased the risk of neonatal morbidity and mortality in preterm neonates under 34 weeks. Neonates of preeclamptic mothers were at higher risk for cesarean section, low birth weight, fetal growth restriction, fetal distress, and mortality. Therefore, early identification of mothers at risk of preeclampsia is crucial. Future studies are recommended to investigate the long-term neonatal outcomes of preeclampsia.