
1. Background
As the global population continues to age, the likelihood of experiencing illness and chronic conditions increases for older individuals. The number and proportion of individuals aged 60 years and older are growing at an unprecedented rate, especially in developing countries. In 2019, the global population included 1 billion individuals aged 60 years and older, a number projected to rise to 1.4 billion by 2030 and 2.1 billion by 2050. This rapid aging of the world’s population is accompanied by a significant increase in the number of the oldest. Iran, like many other nations, is also witnessing substantial growth in its elderly population. Recent census data reveals that the proportion of the elderly population in Iran increased from 7.2% in 2006 to 8.2% in 2011. Notably, older adults (aged 65 years and older) represent the largest consumers of healthcare (1-3).
The escalating prevalence of health issues underscores the heightened demand for health information among older adults. Many older individuals actively seek health information to make informed decisions about their well-being. Further research is essential to comprehend the specific challenges faced by older adults in accessing and utilizing health information, ultimately enabling better support for their health information needs (4, 5). Access to pertinent, timely, accurate, and persuasive health information is pivotal in motivating individuals to adopt healthier lifestyles and actively engage in their healthcare, both at home and within the healthcare system (6). In recent decades, in alignment with international attention to health promotion, addressing patients’ health information needs has gained increasing significance (7).
Health information-seeking behavior (HISB) encompasses the process of obtaining information about various health-related topics, including healthy living, alternative medicine, nutrition, and other health-related subjects (8). Health information-seeking behavior signifies the meaningful behavior of individuals as they seek to fulfill their health information needs, encompassing how they search for, find, and utilize disease-related information (9). The studies included in the search results investigate diverse facets of HISB, including the factors influencing it, the effects of social support and risk perception, and the perspectives of public health professionals. Overall, these findings underscore the significance of understanding the reasons driving individuals to seek health information and how this behavior can be influenced by a multitude of factors (4, 10, 11). Additionally, the studies suggest that communication disparities can exacerbate health inequalities, even when internet access is available (4, 11, 12).
A study conducted by Mansour on the information needs and behavior of elderly individuals living in care homes in Egypt offers valuable insights into the unique challenges encountered by this demographic. The aforementioned study can serve as a foundation for developing targeted interventions aimed at improving their health outcomes (13).
The existing literature reviews reveal a scarcity of research dedicated to exploring the health information needs and information-seeking behaviors of elderly individuals. Consequently, there exists a clear need for further investigations in this specific domain. The primary objective of this study was to examine the health information requirements and seeking behaviors of older patients undergoing treatment in educational and therapeutic hospitals located in Sari, Iran. By primarily identifying the obstacles faced by these individuals when attempting to access health information, this study can contribute to the formulation of effective strategies by healthcare providers. Ultimately, these strategies aim to enhance the accessibility of health information for older patients in hospitals and clinics situated in Sari.
2. Objectives
This study aimed to investigate the information needs and information-seeking behavior of elderly patients in educational and therapeutic hospitals and to identify the barriers that impede their access to relevant information sources.
3. Methods
3.1. Study Design
This study employed a cross-sectional survey design, utilizing a convenience sample of community-dwelling older adults in educational and therapeutic hospitals in Sari (2018 - 2020).
3.2. Sample and Settings
The study focused on older patients (N = 200) admitted to educational and therapeutic hospitals in Sari between 2018 and 2020. The sampling method used was non-probability (sequential or consecutive sampling, which involves increasing the sample size until sufficiency is reached). The inclusion criteria for patients were being 65 years old or older, having a hospital stay longer than three days, and not having hearing or mental disorders. For illiterate patients, a researcher provided assistance in completing the questionnaire.
3.3. Data Collection and Measurement
Data collection involved the use of a researcher-designed questionnaire developed based on various Persian and English resources (10, 14-21). The content validity of the questionnaire was confirmed by obtaining input from 10 academic staff members experienced in information needs assessment. The questionnaire comprised four sections as follows:
3.3.1. Section 1
Demographic information (age, gender, level of education, employment status, living situation, place of residence, physical condition, underlying diseases, and frequency of hospitalization); the primary objective of this study was to ascertain the demographic characteristics of older patients.
3.3.2. Section 2
Health information needs among older patients, consisting of 14 items rated on a five-point scale, ranging from “not important” (1), “slightly important” (2), “moderately important” (3), “important” (4), and “very important” (5); the second objective was to identify the information needs of older patients.
3.3.3. Section 3
Health information-seeking behavior among older patients, featuring 11 items assessed using a five-choice Likert scale (a great deal: 5, much: 4, somewhat: 3, little: 2, and never: 1); the third objective was to identify the HISB of older patients when fulfilling their information needs.
3.3.4. Section 4
Barriers to finding information among older patients, containing 13 items evaluated using five-option criteria (a great deal: 5, much: 4, somewhat: 3, little: 2, and never: 1); the fourth objective was to identify barriers hindering access to the identified information sources.
3.4. Data Analysis
Statistical analysis was performed using IBM SPSS Statistics for Windows, version 24.0. Quantitative and qualitative variables were presented using mean, standard deviation, participant counts, frequencies, and percentages.
3.5. Ethical Considerations
This study received approval from the Ethics Committee of Mazandaran University of Medical Sciences, Mazandaran, Iran (IR.MAZUMS.92-839 on 16.6.1393). Participants provided written informed consent after receiving an explanation of the study’s objectives and assurances of privacy and confidentiality.
4. Results
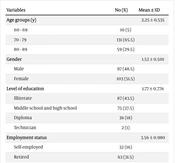
The present study underscored the importance of understanding the specific demographic characteristics of older patients and their impact on HISB. The findings revealed that the majority of participants fell within the age range of 70 - 79 years (65.5%), with approximately half of them being female (51.5%). Most participants had an educational background of illiteracy (43.5%), and their primary employment status was being a housewife (33%). Furthermore, a significant proportion of participants resided in urban areas (59.5%), and cardiovascular disease was the most common underlying health condition (31.5%). Additionally, a substantial portion of participants had experienced hospitalization at least four times (26.5%) or more (Table 1).
Table 1.
Frequency Distribution of Demographic Variables
| Variables | No (%) | Mean ± SD |
|---|---|---|
| Age groups (y) | 2.25 ± 0.535 | |
| 60 - 69 | 10 (5) | |
| 70 - 79 | 131 (65.5) | |
| 80 - 89 | 59 (29.5) | |
| Gender | 1.52 ± 0.501 | |
| Male | 97 (48.5) | |
| Female | 103 (51.5) | |
| Level of education | 1.77 ± 0.776 | |
| Illiterate | 87 (43.5) | |
| Middle school and high school | 75 (37.5) | |
| Diploma | 36 (18) | |
| Technician | 2 (1) | |
| Employment status | 3.56 ± 0.980 | |
| Self-employed | 32 (16) | |
| Retired | 63 (31.5) | |
| Housewife | 66 (33) | |
| Unemployed | 39 (19.5) | |
| Living situation | 2.44 ± 1.416 | |
| With spouse | 67 (33.5) | |
| With family | 50 (25) | |
| With children | 47 (23.5) | |
| Single | 36 (18) | |
| Place of living | 1.41 ± 0.492 | |
| Urban | 119 (59.5) | |
| Rural | 81 (40.5) | |
| Physical status | 1.01 ± 0.100 | |
| Healthy | 198 (99) | |
| Defective | 2 (1) | |
| Underlying diseases | 2.91 ± 1.645 | |
| None | 27 (13.5) | |
| Diabetes | 18 (9) | |
| Hypertension | 25 (12.5) | |
| Asthma | 39 (19.5) | |
| Cardiovascular disease | 63 (31.5) | |
| Hypercholesterolemia | 23 (11.5) | |
| Hypertension and cardiovascular disease | 5 (2.5) | |
| Number of hospitalization | 2.44 ± 1.137 | |
| Once | 51 (25.5) | |
| Twice | 63 (31.5) | |
| Three times | 33 (16.5) | |
| Four times and more | 53 (26.5) |
Abbreviation: SD, standard deviation.
Table 2 shows the health information needs of elderly patients, emphasizing the significance of various types of health information for this population. Among the 14 categories of health information needs, the highest percentages, in descending order, were related to the category “location of health care centers”, rated as “very important” (87.5%), the category “health information and special diseases”, rated as “important” (42%), the category “dental and dental information”, rated as “moderately and slightly important” (23.5%), and the category “injury prevention”, rated as “unimportant” (4.5%). Additionally, Table 2 shows that the highest average score is associated with injury prevention (4.85 ± 0.422); nevertheless, the lowest average score pertains to nutrition (3.05 ± 0.725).
Table 2.
Health Information Needs Among Older Patients
| No. | Information Needs | No (%) | Mean ± SD | ||||
|---|---|---|---|---|---|---|---|
| 5 | 4 | 3 | 2 | 1 | |||
| 1 | Current health news | 45 (22.5) | 57 (28.5) | 9 (4.5) | 9 (4.5) | 1 (0.5) | 4.83 ± 0.430 |
| 2 | Health Information | 46 (23) | 84 (42) | 60 (30) | 10 (5) | 0 | 4.77 ± 0.521 |
| 3 | Specific diseases | 45 (22.5) | 84 (42) | 66 (33) | 5 (2.5) | 0 | 3.33 ± 0.575 |
| 4 | Nutrition | 33 (16.5) | 60 (30) | 80 (40) | 26 (13) | 1 (0.5) | 3.05 ± 0.725 |
| 5 | Physicians’ locations and contact information | 66 (33) | 52 (26) | 73 (36.5) | 8 (4) | 1 (0.5) | 4.02 ± 0.705 |
| 6 | Injury prevention | 39 (19.5) | 60 (30) | 49 (24.5) | 43 (21.5) | 9 (4.5) | 4.85 ± 0.422 |
| 7 | Drugs and possible side-effects | 92 (46) | 63 (31.5) | 43 (21.5) | 2 (1) | 0 | 4.15 ± 0.916 |
| 8 | Complementary and alternative medicine | 91 (45.5) | 56 (28) | 44 (22) | 9 (4.5) | 0 | 4.23 ± 0.817 |
| 9 | Locations of healthcare centers | 175 (87.5) | 20 (10) | 5 (2.5) | 0 | 0 | 3.39 ± 1.155 |
| 10 | Choices of treatment, waiting time, and care | 50 (25) | 104 (52) | 45 (22.5) | 1 (0.5) | 0 | 3.87 ± 0.942 |
| 11 | Information about teeth and dentistry | 1 (0.5) | 54 (27) | 98 (49) | 47 (23.5) | 0 | 3.49 ± 0.935 |
| 12 | Information to enable participation in decision-making | 3 (1.5) | 67 (33.5) | 122 (61) | 8 (4) | 0 | 3.85 ± 0.796 |
| 13 | Sports and physical activity | 161 (8.5) | 32 (16) | 6 (3) | 1 (0.5) | 0 | 3.83 ± 0.839 |
| 14 | Support group locations and contact information | 169 (84.5) | 27 (13.5) | 4 (2) | 0 | 0 | 3.84 ± 0.843 |
Abbreviation: SD, standard deviation.
a Very important: 5; Important: 4; Moderately important: 3; Slightly important: 2; and Not important: 1.
Table 3 shows a list of 11 different sources of health information and their respective percentages. The most common sources of health information included physicians (86%), radio television (61%), nurses and allied science staff (41%), and support groups (11.5%). The least common source of health information was SMS (0.5%). Table 3 also shows that the highest mean score is attributed to physicians (4.86 ± 0.348); nonetheless, the lowest mean score is linked to the Internet (1.34 ± 0.881).
Table 3.
Health Information-Seeking Behavior Among Older Patients a
| Sources | f (%) | Mean ± SD | ||||
|---|---|---|---|---|---|---|
| 5 | 4 | 3 | 2 | 1 | ||
| Health specialists | ||||||
| Nurses, allied science staff | 82 (41) | 90 (45) | 25 (12.5) | 3 (1.5) | 0 | 4.26 ± 0.730 |
| Physicians | 172 (86) | 28 (14) | 0 | 0 | 0 | 4.86 ± 0.348 |
| Interpersonal | ||||||
| Support groups | 0 | 18 (9) | 23 (11.5) | 44 (22) | 115 (57.5) | 1.72 ± 0.988 |
| Family | 7 (3.5) | 144 (72) | 37 (18.5) | 12 (6) | 0 | 3.73 ± 0.624 |
| Relatives and friends | 11 (5.5) | 148 (74) | 37 (18.5) | 4 (2) | 0 | 3.83 ± 0.541 |
| Printed materials | ||||||
| Brochures | 15 (7.5) | 6 (3) | 14 (7) | 65 (32.5) | 100 (50) | 1.86 ± 1.162 |
| Newspapers and magazines | 19 (9.5) | 7 (3.5) | 50 (25) | 45 (22.5) | 79 (39.5) | 2.21 ± 1.266 |
| Books | 12 (6) | 7 (3.5) | 24 (12) | 75 (37.5) | 82 (41) | 1.96 ± 1.102 |
| Non-printed materials | ||||||
| Internet | 2 (1) | 12 (6) | 7 (3.5) | 9 (4.5) | 170 (85) | 1.34 ± 0.881 |
| SMS | 1 (0.5) | 14 (7) | 12 (6) | 25 (12.5 | 148 (74) | 1.48 ± 0.924 |
| Radio and television | 122 (61) | 66 (33) | 12 (6) | 0 | 0 | 4.55 ± 0.608 |
a A Great deal: 5; Much: 4; Somewhat: 3; Little: 2; and Never: 1.
Table 4 shows a list of 13 different barriers and their corresponding percentages. The most prevalent barriers were a lack of mastery of the English language (60.5%), inability to use the Internet (72.5%), and illiteracy (85.5%). Conversely, the least common barriers were lack of access to radio and television (72.5%) and physical barriers (25%). The highest mean score for barriers to accessing health information among older patients pertained to illiteracy (4.82 ± 0.512); however, the lowest mean score was associated with the lack of access to radio and television (1.39 ± 0.728).
Table 4.
Barriers to Finding Health Information Among Older Patients a
| Items and Statement | f (%) | Mean ± SD | ||||
|---|---|---|---|---|---|---|
| 5 | 4 | 3 | 2 | 1 | ||
| 1. Lack of access to radio and television | 0 | 6 (3) | 11 (5.5) | 38 (19) | 145 (72.5) | 1.39 ± 0.728 |
| 2. Physical barriers | 2 (1) | 7 (3.5) | 61 (30.5) | 80 (40) | 50 (25) | 2.16 ± 0.875 |
| 3. Do not have enough time/lack of time | 0 | 26 (13) | 75 (37.5) | 66 (33) | 33 (16.5) | 2.47 ± 0.918 |
| 4. Lack of support in the family | 8 (4) | 50 (25) | 103 (51.5) | 31 (15.5) | 8 (4) | 3.10 ± 0.848 |
| 5. Lack of internet access | 10 (5) | 69 (34.5) | 98 (49) | 18 (9) | 5 (2.5) | 3.68 ± 1.374 |
| 6. Inability to provide resources | 10 (5) | 63 (31) | 82 (41) | 15 (7.5) | 30 (15) | 3.04 ± 1.093 |
| 7. Lack of motivation | 8 (4) | 44 (22) | 115 (57.5) | 33 (16.5) | 0 | 3.14 ± 0.728 |
| 8. Lack of library access | 62 (31) | 54 (27) | 26 (13) | 28 (14) | 30 (15) | 3.45 ± 1.434 |
| 9. Lack of mastery of the English language | 121 (60.5) | 60 (30) | 16 (8) | 3 (1.5) | 0 | 4.50 ± 0.709 |
| 10. Lack of knowledge of various sources of information | 2 (1) | 143 (71.5) | 52 (26) | 3 (1.5) | 0 | 3.72 ± 0.503 |
| 11. Lack of internet access | 76 (38) | 54 (27) | 18 (9) | 33 (16.5) | 19 (9.5) | 3.68 ± 1.374 |
| 12. Not being able to use the Internet | 145 (72.5) | 23 (11.5) | 11 (5.5) | 19 (9.5) | 2 (1) | 4.45 ± 1.026 |
| 13. Illiteracy | 171 (85.5) | 24 (12) | 2 (1) | 3 (1.5) | 0 | 4.82 ± 0.512 |
Abbreviation: SD, standard deviation.
a A Great deal: 5; Much: 4; Somewhat: 3; Little: 2; and Never: 1.
Table 5 shows the relationship between demographic factors (age groups, gender, level of education, and employment status) and HISB. Significant correlations were observed between age groups and printed materials sources, such as newspapers and magazines (P = 0.000, df = 8, χ² = 28.737), gender and non-printed materials sources, such as SMS (P = 0.022, df = 4, χ² = 11.456), level of education and printed materials sources, such as books (P = 0.000, df = 12, χ² = 125.504), and employment status and printed materials sources, such as newspapers and magazines (P = 0.000, df = 12, χ² = 49.469).
When examining the association between demographic factors and HISB in older patients, the level of education was significantly associated with both printed materials sources, such as books (P = 0.000, df = 12, χ² = 125.504), newspapers, and magazines (P = 0.000, df = 12, χ² = 80.588) and non-printed materials sources, such as the Internet (P = 0.000, df = 12, χ² = 86.148) and SMS (P = 0.000, df = 12, χ² = 66.035).
Table 5.
Association Between Demographic and Health Information-Seeking Behavior
| Sources | P | df | χ2 |
|---|---|---|---|
| Health Specialists | |||
| Nurses, allied science staff | |||
| Age groups | 0.062 | 6 | 12.012 |
| Gender | 0.399 | 3 | 2.955 |
| Level of education | 0.559 | 9 | 7.759 |
| Employment status | 0.636 | 9 | 7.013 |
| Physicians | |||
| Age groups | 0.404 | 2 | 1.812 |
| Gender | 0.519 | 1 | 0.415 |
| Level of education | 0.100 | 3 | 6.261 |
| Employment status | 0.814 | 3 | 0.948 |
| Interpersonal | |||
| Support groups | |||
| Age groups | 0.022 | 6 | 14.771 |
| Gender | 0.331 | 3 | 3.423 |
| Level of education | 0.000 | 9 | 48.516 |
| Employment status | 0.004 | 9 | 24.283 |
| Family | |||
| Age groups | 0.053 | 6 | 12.428 |
| Gender | 0.933 | 3 | 0.435 |
| Level of education | 0.022 | 9 | 19.417 |
| Employment status | 0.000 | 9 | 32.051 |
| Relatives and friends | |||
| Age groups | 0.011 | 6 | 16.606 |
| Gender | 0.369 | 3 | 3.150 |
| Level of education | 0.026 | 9 | 18.905 |
| Employment status | 0.014 | 9 | 20.641 |
| Printed Materials | |||
| Brochures | |||
| Age groups | 0.028 | 8 | 17.165 |
| Gender | 0.913 | 4 | 0.979 |
| Level of education | 0.000 | 12 | 73.205 |
| Employment status | 0.003 | 12 | 29.905 |
| Newspapers and magazines | |||
| Age groups | 0.000 | 8 | 28.737 |
| Gender | 0.100 | 4 | 7.779 |
| Level of education | 0.000 | 12 | 80.588 |
| Employment status | 0.000 | 12 | 49.469 |
| Books | |||
| Age groups | 0.12 | 8 | 12.771 |
| Gender | 0.168 | 4 | 6.451 |
| Level of education | 0.000 | 12 | 125.504 |
| Employment status | 0.000 | 12 | 39.880 |
| Non-printed Materials | |||
| Internet | |||
| Age groups | 0.181 | 8 | 11.372 |
| Gender | 0.541 | 4 | 3.1 |
| Level of education | 0.000 | 12 | 86.148 |
| Employment status | 0.006 | 12 | 27.933 |
| SMS | |||
| Age groups | 0.157 | 8 | 11.879 |
| Gender | 0.022 | 4 | 11.456 |
| Level of education | 0.000 | 12 | 66.035 |
| Employment status | 0.021 | 12 | 23.868 |
| Radio and television | |||
| Age groups | 0.568 | 4 | 2.937 |
| Gender | 0.400 | 2 | 1.832 |
| Level of education | 0.000 | 6 | 33.009 |
| Employment status | 0.000 | 6 | 35.733 |
5. Discussion
The present study aimed to explore the health information needs, seeking behavior of older patients, and barriers to accessing information in educational and therapeutic hospitals. The study involved a sample of 200 participants and was conducted between 2018 and 2020 in Sari.
5.1. Health Information Needs of Older Patients
In a study conducted by Harrington et al., it was observed that Black elders sought information on a wide range of topics, including managing chronic health conditions, medication dosage, home remedies, and diet and nutrition (22). The present study recognized the importance of specific topics, namely drugs and their potential side effects, locations of healthcare centers, support group locations, and contact information.
Based on the obtained findings of the present study, it was concluded that the most crucial health information needs for older patients include injury prevention, current health news, general health information, complementary and alternative medicine, drugs and their potential side effects, and the locations and contact information of physicians. However, McGilton et al. identified several key areas of need, such as the requirement for information, coordination of services and supports, preventive, maintenance, and restorative strategies, training for older adults, caregivers, and healthcare providers to effectively manage complex conditions, and the need for person-centered approaches (23).
5.2. Health Information-Seeking Behavior Among Older Patients
Based on the findings of the current study, it was observed that older patients have a preference for healthcare information provided by physicians, as opposed to the Internet, which is the least preferred source. This finding supports the role of information professionals in providing resources and training (14).
The current study’s findings align with previous research, which indicates that older patients tend to rely on medical providers for healthcare information (21, 24-26). This finding aligns with other research findings suggesting that the Internet is not a preferred source of health information for older patients (26). Additionally, the study supports the notion that discussing health information with physicians enhances the patient-provider relationship, leading to better communication and potentially increased patient satisfaction (27). Nevertheless, the present study contradicts other findings that suggest older adults are open to using online health information (11, 22).
5.3. Barriers to Finding Health Information Among Hospitalized Older Patients
The search results revealed that among older patients, illiteracy had the highest mean score as a barrier to finding health information; nonetheless, the lack of access to radio and television had the lowest mean score. These results underscore the importance of understanding patients’ information-seeking behavior and identifying the barriers that affect their ability to seek, find, and use health information to improve their health outcomes.
The most significant barrier to finding health information among older patients is “not being able to use the Internet”, consistent with other studies that have identified the lack of Internet skills as a significant barrier to accessing health information among older adults (11). The results suggest that interventions aimed at improving internet skills among older adults could be effective in reducing this barrier and improving access to health information (8, 28).
Based on the results of this study, the “barrier of lack of support in the family and financial matters” can limit the ability of older adults to access health information, which can also have negative consequences for their health outcomes. This finding aligns with the results of Kurichi et al., who observed that older adults face various barriers to receiving healthcare, such as financial reasons, transportation issues, and the lack of a usual source of care (29). These barriers can negatively impact the timely receipt of recommended medical care and have adverse consequences for the health outcomes of older adults. Identifying the barriers to healthcare access among older adults can help policymakers and healthcare providers develop policies and programs to improve healthcare access and health outcomes for this population. By addressing these barriers, policymakers and healthcare providers can enhance the timely receipt of recommended medical care and HISB among older adults. The search results provide additional evidence to support these findings and underscore the importance of understanding the barriers to healthcare access among older adults.
These studies highlight the importance of addressing the barriers to healthcare access and HISB among older adults to improve their health outcomes. By developing policies and programs that address these barriers, policymakers and healthcare providers can enhance the timely receipt of recommended medical care and HISB among older adults.
Chen et al. identified practical barriers to data collection, such as the lack of standardized fields in EHR systems, which hindered the collection of data on race, ethnicity, and language. Chen et al. also observed that lower health literacy was associated with a lower likelihood of using medical websites for health information and a higher likelihood of using television (30).
5.4. Association Between Demographic Characteristics and Health Information-Seeking Behavior
The study findings demonstrated the association between demographic factors and HISB among older patients. The results indicated that age groups have a significant association with nurses and allied science staff, support groups, families, and brochures as sources of health information. Level of education has a significant association with all sources of health information except for the Internet and SMS. Employment status has a significant association with all sources of health information except for physicians, and gender has no significant association with any of the sources of health information. These findings align with a scoping review that examined the care and support needs of older individuals and observed that demographic factors, such as age, education, and employment status, could influence their HISB (31).
Understanding HISB, which focuses on how individuals obtain information about health, disease, and various health risks, is a growing research area. It is an example of ongoing research in this field.
5.5. Limitations
The present study was limited to educational and therapeutic hospitals in Sari; therefore, the findings might differ in other regions or healthcare settings. Self-reported data might introduce bias and affect accuracy. Not investigating the reasons for barriers to accessing health information is a missed opportunity. The study did not explore the impact of health literacy on information-seeking behavior.
5.6. Conclusions
The practical utility of the study results for nurses and doctors is evident through the opportunities they provide for enhancing practice, optimizing patient care, and contributing to better health outcomes. By incorporating the study’s findings into their daily clinical practice, healthcare professionals can align their interventions with the best available evidence, ultimately benefiting their patients. Therefore, it is recommended that policymakers and health managers pay special attention to increasing health programs and social media programming to educate older adults about health information in different formats and access to the right media for accurate health information. This can help address some of the barriers to finding health information among older adults, ultimately improving their health outcomes.
5.7. Recommendations
To ensure the applicability of research findings, it is recommended to conduct comparable studies across regions and healthcare contexts. Using mixed methods can enhance the robustness of data. Exploring the underlying causes of barriers to health information and developing targeted strategies can help improve health outcomes. It is also important to study the impact of health literacy on older adults’ information-seeking behaviors and investigate the information-seeking behaviors of very low-income older adults for tailored strategies. Finally, investigating the role of technology in facilitating health information seeking can provide valuable insights into how to improve access to health information.