
1. Background
Many survivors of COVID-19 who were discharged from intensive care units (ICUs) reported problems such as shortness of breath, fatigue, reduced muscle strength, impaired lung function, and ultimately decreased quality of life (1-3). Due to the high level of disability after COVID-19, these patients need to participate in the rehabilitation process (4, 5), especially respiratory rehabilitation. This type of rehabilitation is applied to improve symptoms of shortness of breath, relieve anxiety and depression, prevent an increase in dysfunction and disability, maintain and improve physical performance, and enhance the quality of life in these patients. It should be applied as soon as possible after the patients pass the acute stage of the disease (6). However, in the context of the COVID-19 pandemic and its highly contagious nature, challenges such as patients' isolation after discharge and social distancing have prevented many patients from receiving these rehabilitation programs, which are the most effective measures to eliminate the mentioned complications (7, 8). In such situations, indirect training methods are a suitable alternative to face-to-face training (9). The American College of Sports Medicine recommended a creative program incorporating regular communication via telephone, Internet, or mail as an alternative for patients unable to participate in traditional rehabilitation programs for various reasons such as program location, accessibility, transportation, and personal schedules (10).
Telerehabilitation, which includes advising specific physical exercises, monitoring, training, and evaluation, can reduce obstacles, improve lung capacity, and decrease fatigue and shortness of breath (9, 11). During online communication, it is possible to connect directly with patients, which can be considered a positive point in the implementation of telerehabilitation programs (8). For instance, a telerehabilitation program tested on four SARS-CoV-2 infected patients, aged 19 - 66, from the Diamond Princess Cruise ship. This remote rehabilitation approach utilized an Android tablet, a Bluetooth-connected pulse oximeter, and a desktop computer for the therapist. The program facilitated a 20-minute exercise routine via videoconferencing (Zoom) and remote control software (TeamViewer)—the program aimed to provide effective rehabilitation while adhering to isolation requirements during the COVID-19 pandemic. The study highlights the increasing need for such telerehabilitation systems amidst the SARS-CoV-2 pandemic, primarily to support vulnerable groups like the elderly and disabled (8).
In another study, a one-month telerehabilitation program was conducted for patients with specific pulmonary conditions. Patients participated in daily exercises and bi-weekly physiotherapist video calls. The results indicated that a telerehabilitation program for COVID-19 pneumonia survivors is feasible and safe, improving exercise tolerance and dyspnea in most patients, with no adverse events. However, about 20% of patients did not respond to the treatment, so the authors recommended further research with randomized control trials (12). A recent systematic review showed the promising effect of telerehabilitation in cardiac, cancer, and musculoskeletal patients, as well as on the quality of life and depression of patients (11). However, the evidence for a general conclusion is insufficient (11, 13), indicating the need for further research on telerehabilitation in various diseases.
Considering the widespread impact of COVID-19, its residual complications can affect people's individual and social functioning. On the other hand, there is not enough evidence to provide an effective program that can be easily implemented at home to restore the respiratory function of recovered patients. In this research, we explore the potential benefits of a telerehabilitation program as a response to the difficulties encountered in accessing traditional rehabilitation services. This program, which leverages technology for remote healthcare delivery, aims to improve patient compliance with treatment regimens, facilitate the early resolution of complications, and empower patients in their self-care routines. Additionally, it offers the prospect of reducing overall healthcare expenses.
Against the backdrop of the COVID-19 pandemic, this study specifically seeks to examine the effects of respiratory telerehabilitation on the pulmonary function and overall quality of life of these patients. By doing so, it hopes to provide insights into how telehealth initiatives can be harnessed to enhance patient outcomes in a post-pandemic healthcare landscape.
2. Objectives
This study aimed to investigate the impact of respiratory telerehabilitation on pulmonary function and the quality of life of patients with COVID-19.
3. Methods
3.1. Study Design and Participants
In this randomized controlled clinical trial, 60 patients aged 18 - 80 were admitted to Imam Reza (AS) and Qaem (AS) hospitals in Mashhad, Iran, during 2021 - 2023, with a definite diagnosis of COVID-19 and a positive COVID test showing lung lesions (confirmed by radiographic report or CT scan by an infectious disease specialist), were included. These patients entered the study after signing informed consent forms, following an introduction to the study's objectives and confirmation of their inclusion criteria, including access to online communication facilities (such as suitable internet speed and communication devices like laptops, tablets, or smartphones), either by themselves or through direct caregivers. Patients with a history of movement-limiting diseases (such as severe heart, musculoskeletal, or neurological diseases affecting their ability to perform spirometry) and those who decided not to continue cooperation or had more than two absences during the study sessions were excluded.
To estimate the sample size, a pilot study with 20 patients was conducted, considering the mean and standard deviation of the 6-Minute Walk Test (6MWT) as the primary outcome. With a power of 90% and a confidence level of 95%, at least 25 samples per group were calculated. Finally, the sample size was increased to 30 individuals per group to account for a 20% dropout rate. Potential participants were selected from patients admitted to the largest hospitals in Mashhad using convenience sampling. However, random allocation of study units into two groups was conducted using a sequence generated by randomization.com, with each sequence marked as ‘A' or ‘B' and sealed in envelopes. When a unit met the study criteria, an envelope was opened, and it was assigned to the respective group based on the code. This process continued until all units were allocated to both groups.
This study was conducted in a triple-blind manner. The statistical consultant responsible for the random patient allocation, the study outcome evaluator, and the patients themselves were unaware of the group allocation.
3.1.1. Control Group
On the day of discharge, patients in this group were instructed to first complete the quality of life questionnaire and then perform the 6MWT. During this test, their distance traveled, heart rate (HR), and blood oxygen saturation (SPO2) were measured. Maximum inspiratory pressure (MIP) was also measured for all patients. Additionally, at discharge, they received the necessary instructions, a training booklet, and a volumetric incentive spirometer. The booklet contained guidelines for implementing a respiratory telerehabilitation program, including instructions on spirometer use, diaphragmatic breathing, arm exercises, sit-to-stand exercises, step-ups, calf muscle exercises, wall swimming, and lateral walking. They were then asked to honestly record their fatigue, shortness of breath, and the number of breathing exercises completed on a checklist provided to them.
3.1.2. Intervention Group
On the day of discharge, these patients completed the quality of life questionnaire and the 6MWT, and their vital signs, SPO2, and MIP were checked. Subsequently, they were instructed on how to continue the rehabilitation program at home using two-way audio and video communication.
3.2. Intervention
Respiratory rehabilitation exercises were conducted daily, with one 30-minute session per day, for four weeks online using the Skyroom platform to establish a two-way audio and video connection. These sessions were conducted under the direct guidance of the lead researcher and members of the rehabilitation team. Each 30-minute session comprised two 10-minute sets, separated by a 10-minute break for rest and hydration. The program for each set included diaphragmatic breathing exercises (one minute), utilization of the volumetric incentive spirometer (5 minutes), sit-to-stand exercises (30 seconds), stepping (30 seconds), arm muscle exercises (30 seconds), leg muscle exercises (30 seconds), lateral walking exercises (30 seconds), wall swimming (30 seconds), and a one-minute rest period. At the beginning of each online session, following an initial examination of the patient's condition, the lead researcher (Ph.D. in Nursing) explained the rehabilitation and physical exercise program for the day, after which the patients followed her guidance. Following the completion of the daily exercises, the patient's levels of fatigue and shortness of breath were assessed using the Borg Rating of Perceived Exertion (RPE) Scale. The number of repetitions of each physical exercise, SPO2, HR (measured using a handheld pulse oximeter), and any issues encountered during the exercise were recorded for each patient by the lead researcher, a PhD in nursing. Patients were instructed to halt the exercises and inform their caregivers if they experienced symptoms such as chest pain, heart palpitations, fatigue, dizziness, or light-headedness (6-14).
3.3. Outcome Measurement
On three occasions—initially at the start of the study, then two weeks after enrollment, and finally four weeks after enrollment—the patients were visited by a specialist physician at the hospital, where they completed the quality of life questionnaire. HR and SPO2 were measured using a handheld pulse oximeter, known for its high measurement accuracy, ease of use, and portability. Additionally, measurements of MIP and the 6MWT were conducted, and the patients' fatigue and shortness of breath were evaluated and recorded based on the BORG Scale by the lead researcher.
The 6MWT is a straightforward exercise evaluation that measures the distance an individual can walk on a flat, hard surface within a six-minute period to gauge aerobic capacity and endurance. Previous research has established the validity and reproducibility of the 6MWT, showing a correlation coefficient (R) of 0.638 and an intra-class correlation coefficient (ICC) of 97% (15).
The Borg RPE 6 - 20 Scale is a scale used to gauge the level of effort and degree of stress or heaviness experienced during physical activity. The original scale, introduced by Gunnar Borg, utilizes a 15-point scale (the Borg 6 - 20 RPE Scale), expressing effort levels on a scale of 6 - 20 (16). Its validity and reliability have been widely reported (17-20). The correlation coefficient between the RPE scale and HR was found to be 0.85 (P < 0. 001) (16).
The measurement of inspiratory muscle strength using the maximum inspiratory index (IMT) was conducted using the PowerBreathe K1, a reliable and validated tool (21).
SPO2 and HR were monitored using handheld digital pulse oximeters. To ensure the accuracy and precision of these measurement tools, we conducted a series of calibration tests for each instrument after confirming their technical documentation and certifications.
SF-36 was used to measure QOL of patients. This scale has two main subscales including: (1) Physical health score (PCS) with four subscales (physical functioning, role limitations due to physical health (role physical), pain, and general health); and (2) Mental Health Score (MCS) with four subscales (role limitations due to emotional problems (role emotional), energy/fatigue (vitality), emotional well-being, and social functioning).
A content and face validation process was undertaken for the patients' checklist. Initially, a preliminary version of the checklist was developed through a literature review and then evaluated by a panel of five experts, with subsequent revisions and adjustments made by the research team. The test-retest method was employed to assess the reliability of the checklist. In a pilot study, the checklist was administered to 10 patients and then again two weeks later. The Cronbach's alpha correlation coefficient was calculated to be 0.89, indicating a high level of reliability.
3.4. Statistical Analysis
Statistical analysis was conducted using IBM SPSS Statistics software 28 (IBM SPSS Statistics, Armonk, NY, USA). The normality of numeric variables was assessed using the Kolmogorov-Smirnov test. Data were presented as mean (SD) for normally distributed variables, median (min-max) for non-normally distributed variables, and frequency (percent) for categorical variables. The internal consistency reliability of the QOL measures was evaluated using Cronbach’s alpha, demonstrating a good level of internal consistency for subscales, as well as for physical and mental scales and the total score (all > 0.7). Between-group comparisons of baseline measures and demographic variables were conducted using independent t-tests, and Fisher-Freeman-Halton Exact tests were used where appropriate. Within-group comparisons among the three measurements utilized repeated measures analysis of variance (RMANOVA). The assumption of sphericity was assessed using the Mauchly test, and Greenhouse-Geiser-based correction was applied to correct for deviations from this assumption. Significant RMANOVA results were followed by Sidak post hoc tests. To assess the effect of the intervention, analysis of covariance (ANCOVA) was utilized in two models: model 1, controlling for baseline measures (baseline adjusted), and model 2, controlling for baseline measures plus confounders including age, sex, BMI, length of stay, smoking, comorbidity, respiratory disease, and economic level of the participants (fully adjusted). Two-way ANOVA with repeated measures was conducted to assess the interaction effect of measurements by study groups. The effect of the intervention on all QOL 8 subscales and on the 2 scales simultaneously was evaluated using multivariate analysis of covariance, considering baseline measurements and the aforementioned confounders as covariates. The significance of multivariate differences was determined using the Wilks lambda test. All analyses were performed using a per-protocol approach, with P-values less than 0.05 considered significant.
3.5. Ethics Approval
This study was conducted in accordance with the principles outlined in the Declaration of Helsinki. Confidentiality and informed consent principles were meticulously observed, and informed consent was obtained from all individual participants included in the study. Approval was granted by the Regional Research Ethics Committee (Mashhad University of Medical Sciences: MUMS) was obtained under the code IR.MUMS.NURSE.REC.1399.052, 2020-10-06. Also this trial was registered at Iranian Registry of Clinical Trials (code: IRCT20200711048077N1).
4. Results
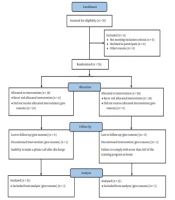
A total of 102 patients were enrolled in this study. During the initial eligibility evaluation, 50 patients were excluded, with 30 not meeting the inclusion criteria and 20 declining to participate. Subsequently, 60 patients were allocated to either the intervention (n = 30) or control (n = 30) groups. No participants in either the intervention or control groups discontinued the intervention. Therefore, the final analysis included 60 patients, evenly distributed between the intervention and control groups (Figure 1).
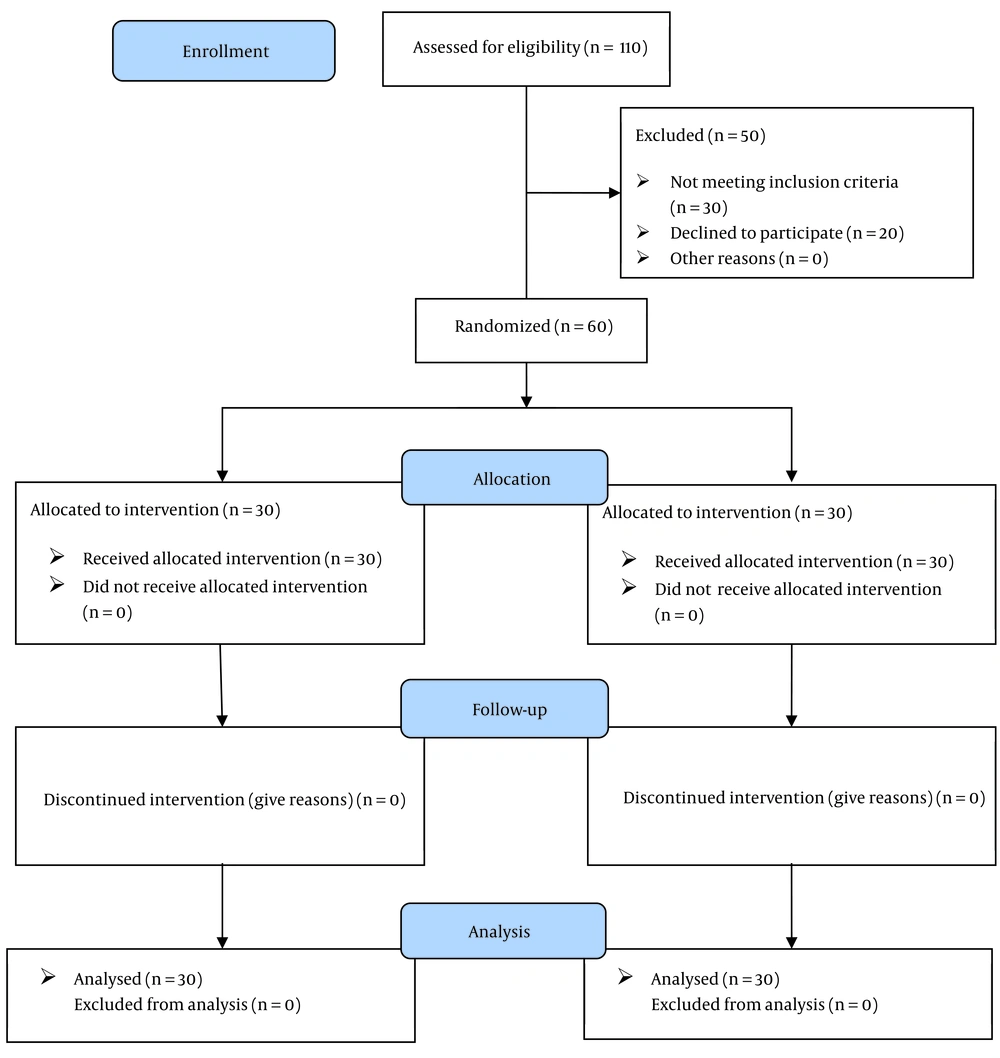
Figure 1.
CONSORT flow diagram
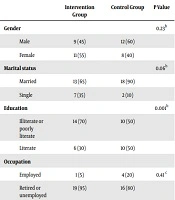
Table 1 presents the profile of the patients. The results indicated no significant differences between the intervention and control groups regarding age, weight, height, BMI, length of stay, gender, education level, marital status, occupation, residence place, economic level, smoking status, clinical symptoms, comorbidity, or respiratory disease (all P > 0.05).
Table 1.
Profile of Participants a
| Variables | Intervention (n = 30) | Control (n = 30) | P-Value |
|---|---|---|---|
| Age, y | 54.5 ± 12.0 | 50.4 ± 12.3 | 0.199 b |
| Weight, kg | 81.0 ± 15.1 | 80.3 ± 13.0 | 0.774 b |
| Height, cm | 170.3 ± 9.3 | 169.2 ± 18.0 | 0.834 b |
| Body mass index, kg/m2 | 28.1 ± 5.2 | 27.6 ± 3.8 | 0.698 b |
| Length of stay, d | 6.6 ± 2.8 | 6.5 ± 2.9 | 0.893 b |
| Gender, male | 23 ± 76.7 | 23 ± 76.7 | > 0.999 c |
| Education level | 0.699 c | ||
| Primary | 4 (13.3) | 3 (10.0) | |
| Secondary | 11 (36.7) | 12 (40.0) | |
| Diploma | 5 (16.7) | 2 (6.7) | |
| Academic | 10 (33.3) | 13 (43.3) | |
| Marital status (married) | 25 (83.3) | 29 (96.7) | 0.195 c |
| Occupation | 0.433 c | ||
| Retired | 3 (10.0) | 3 (10.0) | |
| Worker | 8 (26.7) | 4 (13.3) | |
| Governmental employee | 12 (40.0) | 10 (33.3) | |
| Housekeeper | 3 (10.0) | 8 (26.7) | |
| Others | 4 (13.3) | 5 (16.7) | |
| Residence place (urban) | 27 (90.0) | 29 (96.7) | 0.612 c |
| Economic level (moderate and high) | 23 (76.7) | 20 (66.7) | 0.399 c |
| Smoking (yes) | 4 (13.3) | 1 (3.3) | 0.353 c |
| Comorbidity (yes) | 13 (43.3) | 14 (46.7) | 0.360 c |
| Respiratory disease (yes, asthma) | 8 (26.7) | 2 (6.7) | 0.080 c |
a Values are expressed as mean ± standard deviation, or No. (%).
b Independent t-test
c Fisher-Freeman-Halton exact test.
4.1. Pulmonary Function
4.1.1. Baseline Comparisons of Pulmonary Function
Furthermore, there were no significant differences between the intervention and control groups for pulmonary function variables (all P > 0.05), indicating the similarity of the groups at baseline measurements of these variables (Table 2).
| Variables | Intervention (n = 30) | Control (n = 30) | P-Value c | P-Value d | P-Value e |
|---|---|---|---|---|---|
| MIP | 0.029 | ||||
| Before intervention | 37.70 a ± 9.62 | 35.83 a ± 6.81 | 0.389 f | - | |
| 2 weeks after intervention | 46.70 b ± 13.40 | 44.97 b ± 9.86 | 0.589 | 0.837 | |
| 4 weeks after intervention | 73.43 c ± 5.77 | 64.77 c ± 6.44 | < 0.001 | < 0.001 | |
| P-value g | < 0.001 | < 0.001 | |||
| RR | < 0.001 | ||||
| Before intervention | 28.30 a ± 4.15 | 28.10 a ± 3.29 | 0.922 f | - | |
| 2 weeks after intervention | 24.80 b ± 2.98 | 26.90 a ± 2.90 | 0.314 | 0.485 | |
| 4 weeks after intervention | 21.30 c ± 2.96 | 24.30 a ± 2.53 | 0.001 | 0.003 | |
| P-value g | < 0.001 | 0.135 | |||
| HR | < 0.001 | ||||
| Before intervention | 128.13 a ± 7.33 | 128.40 a ± 8.03 | 0.938 f | - | |
| 2 weeks after intervention | 120.20 b ± 9.83 | 123.30 a ± 9.41 | 0.343 | 0.361 | |
| 4 weeks after intervention | 106.20 c ± 6.72 | 117.37 b ± 8.90 | < 0.001 | < 0.001 | |
| P-value g | < 0.001 | < 0.001 | |||
| SPO2 | 0.281 | ||||
| Before intervention | 88.13 a ± 3.38 | 87.27 a ± 3.15 | 0.882 f | - | |
| 2 weeks after intervention | 93.87 b ± 1.63 | 93.27 b ± 1.82 | 0.147 | 0.161 | |
| 4 weeks after intervention | 96.90 c ± 1.21 | 95.20 c ± 2.22 | < 0.001 | < 0.001 | |
| P-value g | < 0.001 | < 0.001 | |||
| Borg scale | < 0.001 | ||||
| Before intervention | 17.33 a ± 1.47 | 17.73 a ± 1.20 | 0.001 f | - | |
| 2 weeks after intervention | 14.33 b ± 1.92 | 14.40 b ± 1.81 | 0.928 | 0.868 | |
| 4 weeks after intervention | 9.77 c ± 1.59 | 13.87 b ± 2.39 | < 0.001 | < 0.001 | |
| P-value g | < 0.001 | < 0.001 | |||
| MWT6 | < 0.001 | ||||
| Before intervention | 72.00 a ± 43.14 | 58.77 a ± 47.32 | 0.068 f | - | |
| 2 weeks after intervention | 199.23 b ± 60.66 | 168.83 b ± 49.22 | 0.066 | 0.076 | |
| 4 weeksafter intervention | 454.90 c ± 37.70 | 347.97 c ± 70.35 | < 0.001 | < 0.001 | |
| P-value g | < 0.001 | < 0.001 |
Abbreviations: MIP, maximum inspiratory pressure; RR, respiratory rate; HR, heart rate; SPO2, blood oxygen saturation; 6MWT, the 6-minute walk test.
a Values are expressed as mean ± standard deviation.
b P-values are significant at < 0.05.
c Model 1: P-values for between-group comparisons at 2 and 4 weeks after the intervention were computed using analysis of covariance (ANCOVA) after adjustment for baseline measures.
d Model 2: P-values for between-group comparisons at 2 and 4 weeks after the intervention were computed using ANCOVA after adjustment for baseline measures and confounders (including age, sex, BMI, length of stay, smoking, comorbidity, respiratory disease, and economic level).
e P-value based on two-way analysis of variance (ANOVA) with repeated measures.
f P-values for between-group comparisons at baseline were computed using an independent t-test.
g P-values for within-group comparisons were computed using repeated-measures analysis of variance followed by the Sidak post hoc test (different letters show significantly different means of the variable in that column (P < 0.05)).
4.1.2. Within-Group Comparisons of Pulmonary Function Variables
Table 2 displays the results of within-group comparisons of pulmonary function variables in each group. A significant time effect was observed for both respiratory rate (RR) and HR within both intervention and control groups (all P < 0.05). Additionally, the Sidak post hoc test revealed significant differences between the 2-week and 4-week intervention periods compared to baseline measurements in both intervention and control groups for HR (all P < 0.05). However, for RR, the within-group differences in the control group were not significant (all P > 0.05).
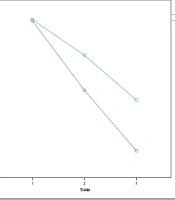
Generally, a decreasing trend was observed for RR and HR within both the intervention and control groups; however, the trend was sharper in the intervention group (Figure 2).
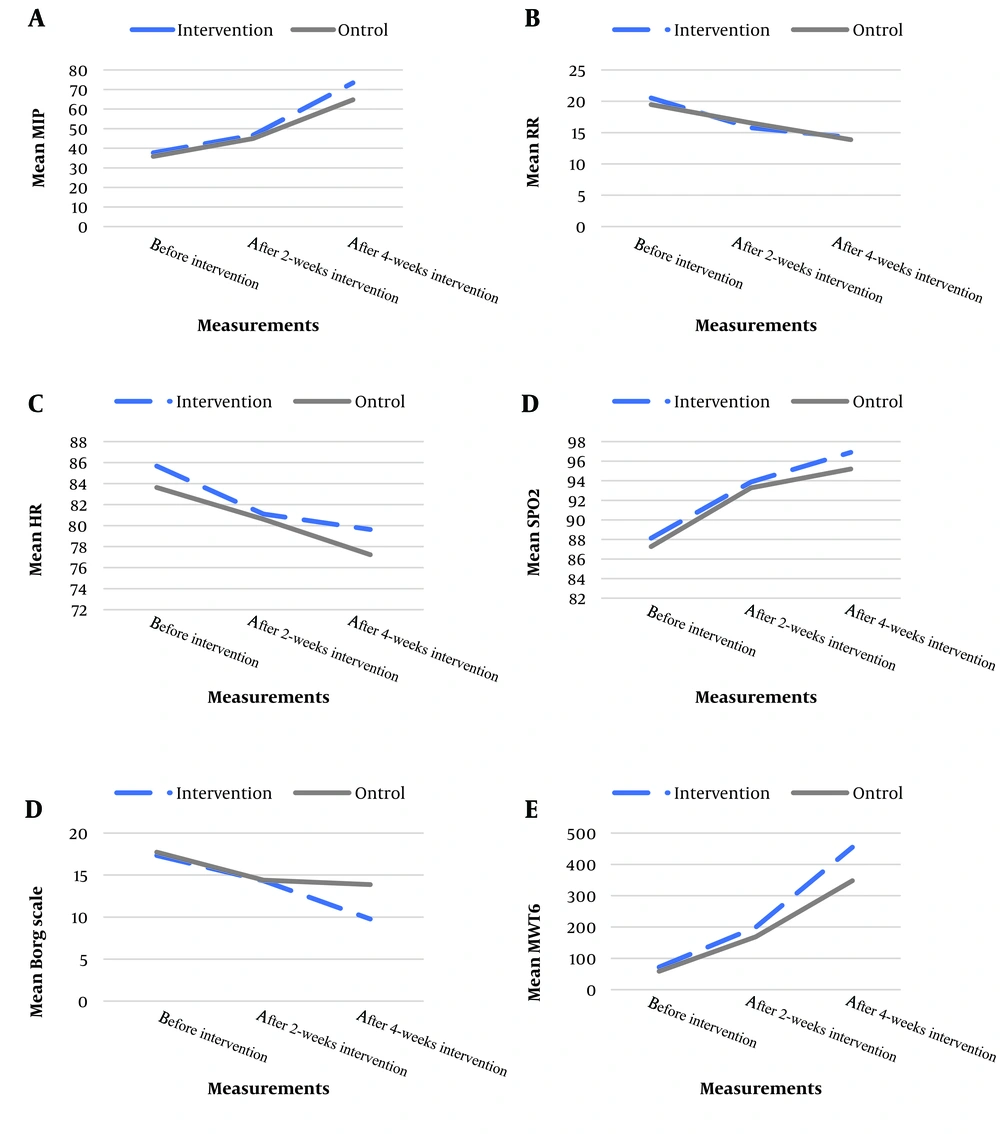
Figure 2.
Pulmonary function measurements in the intervention and control groups.
4.1.3. The Results of Interaction between Measurements and Groups
Table 2 reveals the results of the interaction between measurements and groups. Significant interactions were observed between measurements and groups for RR and HR (both P < 0.05), indicating a significantly different time trend of these measurements across the intervention and control groups.
4.1.4. The Intervention Effect
The results of ANCOVA in two models are presented in Table 2. In both models, the results indicated a significant intervention effect after 4 weeks for RR and HR based on both model 1 (baseline adjusted) and model 2 (fully adjusted) (all P < 0.05).
Generally, the results presented significantly higher changes in RR and HR after 4 weeks in the intervention group than in the control group.
4.1.5. The Results of Interaction between Measurements and Groups
Table 2 also reveals the results of the interaction between measurements and groups. Significant interactions were observed between measurements and groups for MIP, Borg scale, and MWT6 variables (all P < 0.05), indicating a significantly different time trend of these measurements across the intervention and control groups.
4.1.6. The Intervention Effect
The results of ANCOVA in two models are presented in Table 2. In both models, the results indicated a significant intervention effect after 4 weeks for MIP, SPO2, Borg scale, and MWT6 variables based on both model 1 (baseline adjusted) and model 2 (fully adjusted) (all P < 0.05). However, the results showed that no significant intervention effect after either 2 weeks or 4 weeks was observed for RR and HR based on both models (all P > 0.05).
Generally, the results presented significantly higher changes in MIP, SPO2, Borg scale, and MWT6 after 2 weeks as well as after 4 weeks in the intervention group than in the control group.
Generally, the results showed significantly higher changes in MIP, SPO2, Borg scale, and MWT6 after 2 weeks as well as after 4 weeks in the intervention group compared to the control group.
4.2. Quality of Life
4.2.1. Baseline Comparisons of QOL Score, Scales and Subscales
The results showed significant differences between the intervention and control groups in physical function, body pain, vitality, mental health, Mental Health Scale, and QOL score (all P < 0.05). Nevertheless, these differences were adjusted in the final model when assessing the intervention effect. On the other hand, the difference in baseline measurements was not significant for role physical, general health, social functioning, role emotional, and physical function scale (all P > 0.05), indicating the similarity of the groups at baseline measurement of these variables (Table 3).
| Variables and Time | Intervention (n = 30) | Control (n = 30) | P-Value c | P-Value d | P-Value e |
|---|---|---|---|---|---|
| Physical functioning | < 0.001 | ||||
| Before intervention | 20.17 a ± 10.38 | 7.67 a ± 8.88 | < 0.001 f | - | |
| 2 weeks after intervention | 40.33 b ±24.21 | 19.67 b ± 9.99 | < 0.001 | < 0.001 | |
| 4 weeks after intervention | 73.17 c ± 11.56 | 26.50 b ± 18.30 | < 0.001 | < 0.001 | |
| P-value R g | < 0.001 | < 0.017 | |||
| Role physical | 0.099 | ||||
| Before intervention | 20.17 a ± 42.24 | 6.67 a ± 11.24 | 0.100 f | - | |
| 2 weeks after intervention | 58.33 b ± 45.64 | 19.17 a,b ± 38.66 | < 0.001 | 0.013 | |
| 4 weeks after intervention | 69.17 b ± 23.38 | 32.50 b ± 40.55 | < 0.001 | < 0.001 | |
| P-value R g | 0.005 | < 0.001 | |||
| Body pain | < 0.001 | ||||
| Before intervention | 63.53 a ± 12.10 | 77.97 a ± 13.76 | < 0.001 f | - | |
| 2 weeks after intervention | 61.10 a ± 26.27 | 63.53 b ± 12.10 | 0.550 | 0.996 | |
| 4 weeks after intervention | 74.33 b ± 12.23 | 65.27 b ± 17.49 | 0.064 | 0.143 | |
| P-value g | 0.014 | 0.014 | |||
| General health | 0.019 | ||||
| Before intervention | 61.10 a ± 8.88 | 58.67 a ± 6.99 | 0.243 f | - | |
| 2 weeks after intervention | 56.20 b ± 8.20 | 53.20 b ± 11.96 | 0.363 | 0.200 | |
| 4 weeks after intervention | 54.70 c ± 10.27 | 47.77 a,b ± 19.38 | 0.067 | 0.033 | |
| P-value g | < 0.001 | 0.049 | |||
| Vitality | 0.069 | ||||
| Before intervention | 41.83 a ± 9.51 | 51.50 a ± 11.83 | < 0.001 f | - | |
| 2 weeks after intervention | 47.17 b ± 9.26 | 42.50 b ± 9.35 | 0.023 | 0.015 | |
| 4 weeks after intervention | 55.50 c ± 15.16 | 47.00 a,b ± 9.06 | 0.012 | 0.042 | |
| P-value g | < 0.001 | 0.002 | |||
| Social functioning | < 0.001 | ||||
| Before intervention | 65.17 a ± 18.30 | 58.07 a ± 12.52 | 0.085 f | - | |
| 2 weeks after intervention | 47.23 b ± 15.30 | 61.40 a ± 17.42 | 0.002 | 0.008 | |
| 4 weeks after intervention | 64.07 a, c ± 23.93 | 48.47 b ± 14.60 | 0.006 | 0.022 | |
| P-value R g | < 0.001 | 0.026 | |||
| Role emotional | 0.280 | ||||
| Before intervention | 21.03 a ± 34.48 | 8.80 a ± 14.84 | 0.080 f | - | |
| 2 weeks after intervention | 67.80 b ± 63.39 | 34.40 b ± 35.66 | 0.014 | 0.022 | |
| 4 weeks after intervention | 52.17 b, c ± 25.99 | 28.87 b, c ± 40.83 | 0.030 | 0.033 | |
| P-value g | < 0.001 | 0.006 | |||
| Mental health | 0.010 | ||||
| Before intervention | 51.60 a ± 7.15 | 44.13 a ± 6.60 | < 0.001 f | - | |
| 2 weeks after intervention | 50.27 a ± 8.77 | 51.60 b ± 7.15 | 0.696 | 0.337 | |
| 4 weeks after intervention | 47.47 a ± 12.72 | 49.33 b, c ± 7.67 | 0.777 | 0.623 | |
| P-value g | 0.278 | 0.002 | |||
| Physical Health Scale | < 0.001 | ||||
| Before intervention | 41.27 a ± 8.90 | 40.40 a ± 5.46 | 0.651 f | - | |
| 2 weeks after intervention | 52.53 b ± 10.27 | 39.53 a ± 8.08 | < 0.001 | < 0.001 | |
| 4 weeks after intervention | 63.93 c ± 8.17 | 45.23 b ± 10.30 | < 0.001 | < 0.001 | |
| P-value g | < 0.001 | 0.012 | |||
| Mental Health Scale | 0.491 | ||||
| Before intervention | 48.17 a ± 5.53 | 44.23 a ± 5.17 | 0.006 f | - | |
| 2 weeks after intervention | 53.77 b ± 13.16 | 48.60 a ± 6.66 | 0.070 | 0.045 | |
| 4 weeks after intervention | 53.33 b ± 10.27 | 45.80 a ± 8.66 | 0.027 | 0.072 | |
| P-value g | 0.001 | 0.100 | |||
| Total SF36 score | < 0.001 | ||||
| Before intervention | 43.17 a ± 8.28 | 39.20 a ± 4.57 | 0.025 f | - | |
| 2 weeks after intervention | 53.57 b ± 13.40 | 43.23 a, b ± 7.21 | < 0.001 | 0.003 | |
| 4 weeks after intervention | 60.37 c ± 6.93 | 44.13 b ± 11.38 | < 0.001 | < 0.001 | |
| P-value g | < 0.001 | 0.025 |
a Values are expressed as mean ± standard deviation.
b P-values are significant at < 0.05.
c Model 1: P-values for between-group comparisons at 2 and 4 weeks after intervention were computed using analysis of covariance (ANCOVA) after adjustment for baseline measures.
d Model 2: P-values for between-group comparisons at 2 and 4 weeks after intervention were computed using ANCOVA after adjustment for baseline measures and confounders (including age, sex, BMI, length of stay, smoking, comorbidity, respiratory disease, and economic level).
e P-value based on two-way analysis of variance (ANOVA) with repeated measures.
f P-values for between-group comparisons at baseline were computed using an independent t-test.
g P-values for within-group comparisons were computed using repeated measures analysis of variance followed by Sidak post hoc test (different letters show significantly different means of the variable in that column (P < 0.05)).
4.2.2. Within-Group Comparisons of Measurements for QOL Score, Scales and Subscales
Table 3 presents the results of within-group comparisons of measurements for QOL scores, scales, and subscales within both intervention and control groups. There was a significant time effect for the QOL score and all scales and subscales within both intervention and control groups (all P < 0.05), except for the Mental Health Scale in the control group (P > 0.05).
Generally, an increasing trend was observed for physical function, role physical, vitality, Physical Health Scale, and total SF36 score, while a decreasing trend was observed for general within both intervention and control groups so that the increase in the QOL after intervention was more enhancing in the intervention group than the control group. Besides, for body pain, social functioning, role emotional, and mental health, no increasing/decreasing trend could be inferred (Figure 3).
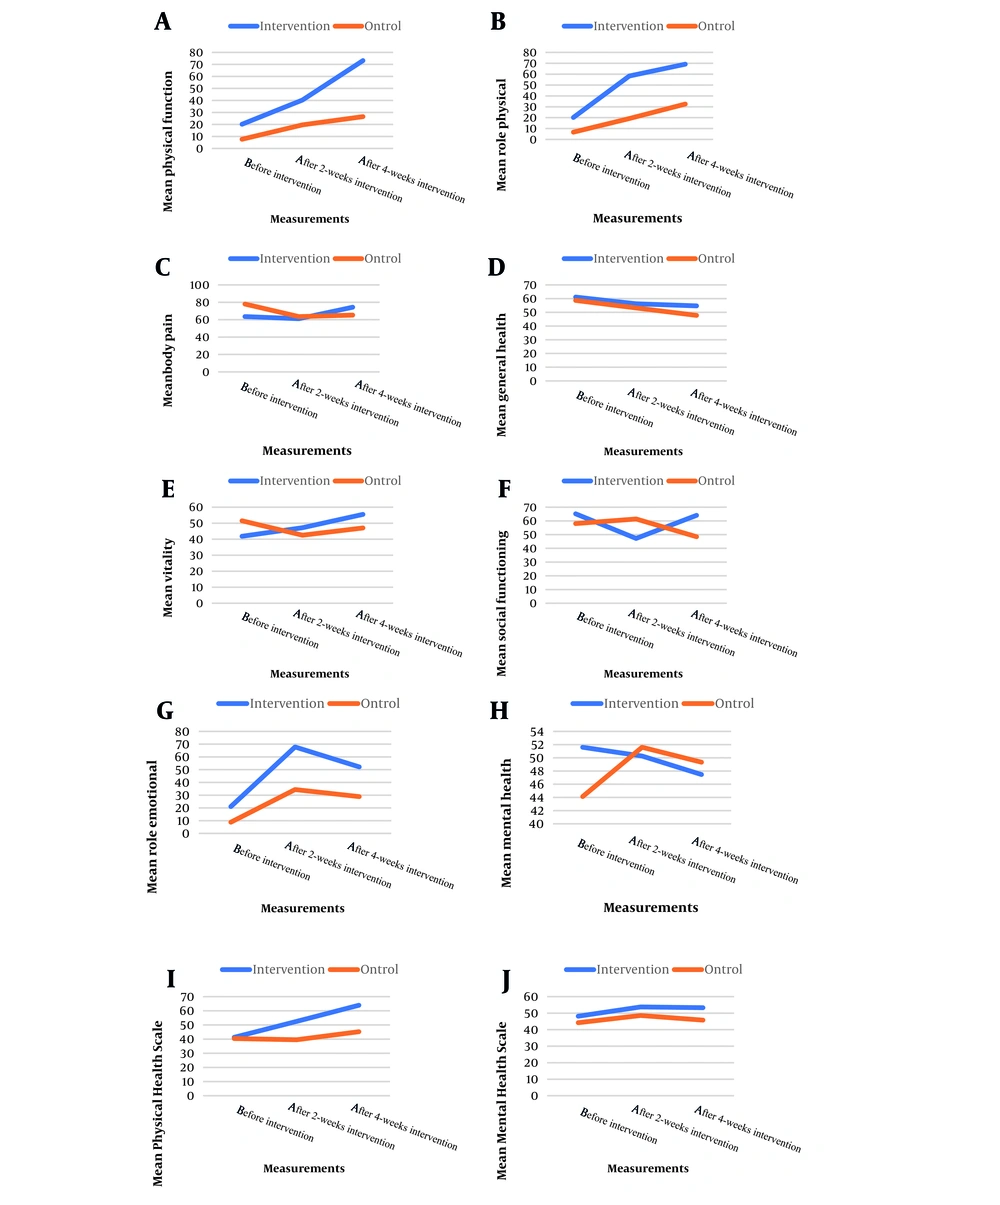
Figure 3.
Quality of life score and its scales and subscales in the intervention and control groups.
4.2.3. The Results of Interaction Between Measurements and Groups
Table 3 reveals the results of the interaction between measurements and groups. Significant interactions were observed between measurements and groups for physical function, body pain, general health, social functioning, mental health, Physical Health Scale, and total SF36 score (All P < 0.05), indicating a significantly different time trend of measurements across intervention and control groups. However, the interactions were not significant for the physical, vitality, role emotional, and Mental Health Scale (P > 0.05).
4.2.4. The Intervention Effect
The results of ANCOVA based on baseline- and fully-adjusted models are presented in Table 3. In both models, the results indicated a significant intervention effect after 2 weeks as well as 4 weeks for physical function, role physical, vitality, social functioning, emotional functioning, Physical Health Scale, and total SF36 score (all P < 0.05). Additionally, the fully adjusted model displayed a significant intervention effect after 4 weeks for general health and after 2 weeks for the Mental Health Scale (both P < 0.05). However, the interaction did not significantly affect body pain and mental health (both P > 0.05).
Generally, the results presented significantly higher changes in physical function, physical role, general health, vitality, social functioning, emotional role, Physical Health Scale, Mental Health Scale, and total SF36 score after 2 weeks as well as after 4 weeks in the intervention group compared to the control groups.
4.2.5. The Results of Multivariate Analysis of Covariance
The results indicate a significant difference for all 8 QOL subscales simultaneously after 2 weeks (Wilks' Lambda = 0.491, F(8,43) = 5.6, P < 0.001), and after 4 weeks (Wilks' Lambda = 0.279, F(8,43) = 13.9, P < 0.001), as well as a significant difference for both 2 QOL scales simultaneously after 2 weeks (Wilks' Lambda = 0.615, F(2,55) = 17.2, P < 0.001), and after 4 weeks (Wilks' Lambda = 0.541, F(2,55) = 23.4, P < 0.001).
5. Discussion
5.1. Main Findings
The COVID-19 pandemic compelled various health services, including rehabilitation, to adopt remote service delivery despite the challenges in implementation and practice. For instance, the necessity for COVID-19 patients to isolate themselves post-discharge and the imperative of maintaining social distance posed obstacles to receiving respiratory rehabilitation programs. However, despite these challenges, the training, rehabilitation, and monitoring of patients after discharge couldn't be overlooked. Hence, this study was conducted to assess the impact of respiratory telerehabilitation through web-based online sessions on the pulmonary function and quality of life of COVID-19 patients. Utilizing the Internet in this manner made the program simple, convenient, and accessible to all participants in the study.
The findings revealed improvements in heart rate, respiratory rate, respiratory muscle strength scores, arterial blood oxygenation levels, distance covered in the 6MWT, and quality of life scores. Additionally, a reduction in shortness of breath and fatigue was observed in both the intervention and control groups one month after the intervention. However, the magnitude of these improvements was significantly higher in the intervention group compared to the control group. Furthermore, no significant complications were reported in the intervention group, and the patient participation rate in online sessions was deemed satisfactory.
The aim of this intervention was to enhance pulmonary function parameters, such as maximum inspiratory pressure (MIP), and quality of life through telerehabilitation. Our study revealed an augmentation in inspiratory muscle strength and an enhancement in overall quality of life, as assessed by the SF-36 questionnaire (with the exception of dimensions related to body pain, social functioning, emotional role, and mental health). Similarly, Li et al. employed a mobile application for delivering physical exercise programs via telerehabilitation (22). Alongside the 6MWT test as the primary outcome, Li et al. evaluated various parameters of pulmonary function, lower limb muscle strength, and quality of life among patients, using the SF-12 questionnaire to measure both the physical and mental components. Their study demonstrated a positive impact of telerehabilitation on the physical dimension of quality of life. Despite differences in measurement tools, study duration, and pulmonary parameters between their study and ours, the results were akin in terms of the lack of improvement observed in the psychological dimension of quality of life in both groups. This suggests that short-term interventions lasting 4 to 6 weeks may not suffice to enhance the psychological and social aspects of affected individuals. It appears that the substantial decline observed in the scores of psychological dimensions of quality of life persists for up to 90 days post-discharge (23), indicating the necessity for longer rehabilitation periods for these individuals.
The findings of a recent systematic review also highlight the positive impact of telerehabilitation solely on the physical dimensions of quality of life, without any adverse effects (24). However, in a study by Nopp et al., the implementation of a personalized 6-week outpatient rehabilitation program led to improvements in lung function, increased inspiratory muscle strength, and positively affected secondary outcomes such as shortness of breath, fatigue, and quality of life (25). Similarly, in a study by Liu et al., a 6-week respiratory rehabilitation program for COVID-19 patients over 65 years old conducted in a rehabilitation center resulted in enhanced quality of life across all dimensions. This discrepancy may stem from the limitations inherent in remote health programs compared to in-person ones, or the advantages of personalized rehabilitation over more generalized approaches (26). Additionally, factors like age, concurrent diseases, length of ICU stay, and ventilation can influence quality of life scores (27).
Another significant outcome of our study was the results of the 6MWT, which demonstrated a notable increase in the distance covered by patients in the intervention group compared to those in the control group following the implementation of the telerehabilitation program via video conference. Moreover, there was a reduction in reported levels of shortness of breath and fatigue, as measured by the Borg scale. In a study implementing a similar one-week telerehabilitation program for patients with mild to moderate COVID-19, utilizing web-based video conferencing, a significant improvement in walking distance during the 6MWT was observed in the intervention group. Consistent with our findings, this study also noted improvements in shortness of breath and fatigue following telerehabilitation intervention (based on the Borg Scale) (28).
Amaral et al. initiated their rehabilitation intervention four to six weeks after discharging COVID-19 patients, which lasted for 12 weeks. They utilized the WhatsApp application and YouTube website as supplementary tools for in-home physical exercise training alongside face-to-face sessions. Their findings demonstrated a significant increase in maximum inspiratory pressure (MIP) and SPO2 levels in the intervention group (29). Their study, to our knowledge, boasted the longest follow-up duration of COVID-19 patients post-telerehabilitation intervention. From their results, one could infer that prolonged implementation of a monitored rehabilitation program, even within patients' homes, can positively impact patient outcomes.
In a recent systematic review, the effectiveness and feasibility of telehealth for rehabilitation during COVID-19 were analyzed and deemed satisfactory. Common modalities included video/audio calls and hybrid approaches incorporating texts and educational resources. Technologies such as smartphones, PCs, and free videoconferencing platforms (e.g., Google Meet, Zoom, Skype, WhatsApp) played a pivotal role, rendering telerehabilitation accessible and pragmatic for both patients and clinicians (30). Similarly, Cox et al. arrived at analogous conclusions, asserting that telerehabilitation for chronic respiratory diseases is on par with traditional methods in terms of efficacy and safety, yet advocating for further research to evaluate long-term effects and consider cost implications (31).
Patient adherence to telerehabilitation programs emerges as a crucial factor and has been subject to evaluation in various studies (32-35). As reported in Varnfield et al.'s study, the increased adherence is credited to the innovative utilization of smartphone and internet technologies, which facilitate self-management and clinical support (34). Furthermore, in another study, the integration of WhatsApp messenger for remote patient follow-up and training post-discharge fostered ongoing communication between the treatment team and patients, proving to be a cost-effective method for training and follow-up across different stages of rehabilitation (36).
5.2. Limitations and Strengths
The present study has several limitations, including the short follow-up period of patients and the lack of examination of patients with extensive pulmonary involvement. Additionally, we encountered various challenges during this research, such as low or no awareness and skills among patients and healthcare providers regarding telerehabilitation technologies, infrastructure-related issues, concerns about private data security, and elderly patients lacking sufficient knowledge about using smart devices.
Despite these limitations, the implementation of telerehabilitation programs has facilitated easier access to services like respiratory rehabilitation for many patients, especially those who are medically and socially isolated due to COVID-19. Furthermore, employing conference communication approaches in this study helped maintain ongoing communication between medical staff and patients, facilitating the exchange of necessary information for managing the post-discharge period and enhancing patient compliance with rehabilitation programs. However, it is advisable to conduct more comprehensive studies with larger sample sizes to validate these results or design studies to identify potential obstacles and challenges of telerehabilitation and develop strategies to address them to maximize the benefits of this approach.
5.3. Conclusions
Telerehabilitation, particularly through videoconferencing platforms, has the potential to improve heart rate, respiratory rate, respiratory muscle strength, arterial blood oxygenation levels, distance traveled in the 6MWT, and quality of life scores in patients with COVID-19. This method offers a simple, easy, and accessible means of two-way audio and video communication between healthcare team members and COVID-19 patients, significantly enhancing pulmonary function parameters and quality of life. Consequently, this study underscores the importance of incorporating respiratory telerehabilitation as a vital component in rehabilitation programs for COVID-19 patients. Given these findings, collaboration among health policymakers, rehabilitation managers, and technology developers is recommended to improve access to respiratory rehabilitation services, especially for isolated patients and in challenging situations where face-to-face services are not readily available.