
1. Background
COVID-19 caused by severe acute respiratory syndrome coronavirus 2 (SARS‑CoV‑2) was first reported in Wuhan, China, in December 2019 as a cluster of atypical pneumonia with high mortality (1-3). It was declared by the World Health Organization as a Public Health Emergency of International Concern on 30 January and a pandemic on 11 March (4, 5). As of 31 May 2020, more than 6.09 million cases of COVID-19 have been reported in more than 188 countries and territories, causing more than 369,000 deaths while more than 2.58 million people have recovered (6).
Human-to-human transmission of the virus is predominantly via the inhalation of infectious droplets produced in the process of sneezing, coughing, and talking when people are in close contact (7-9). The droplets typically fall to the ground or on surfaces instead of traveling through air over long distances due to its size, hence hand contact with these infectious fomites on hard surfaces and subsequent translocation to the mouth, nose, and eye is an equally important means of transmission (7, 8). The virus is mostly infectious during the first three days after the onset of symptoms, though its spread is feasible before symptoms appear and from individuals who are asymptomatic (7, 8). The incubation period ranges from 2 to 14 days with an average of five days, and the common clinical features include cough, fever, fatigue, shortness of breath, and anosmia (7, 10, 11). Extrapulmonary symptoms may occur singly as the presenting complaint or with the aforementioned common symptoms (12, 13).
Currently, there are no known vaccine or specific antiviral treatment (7), and emphasis is therefore on the prevention of infection. Non-pharmaceutical interventions (NPI) are strategies taken at the personal, community, and environmental levels to help slow the spread of the disease pandemic. They are a group of methods to reduce the spread of an epidemic without the use of drugs (14). This strategy has been previously used in the control of the 2009 swine flu pandemic influenza, and the Center for Disease Control advocates its use in curbing the coronavirus pandemic. Non-pharmaceutical interventions are among the best ways of controlling the flu pandemic when vaccines are not yet available (15).
As such, several NPIs have been implemented globally to control the COVID-19 pandemic, among which is social distancing (SD) (16). Social distancing, also called physical distancing, is a set of NPI aimed at preventing the spread of a contagious disease by increasing and maintaining the physical distance between people and reducing the frequency of close contact among people to decrease the risk of disease transmission (15, 17). The social distancing measures applied so far include school closures, ban on large gatherings for religious purposes or celebrations, closure of all non-essential business outfits, and restrictions on vehicular intra and intercity movement (16). These measures, when used in combination with good respiratory hygiene and the use of personal protective equipment, such as face masks and hand hygiene, are the most feasible way to reduce or delay a pandemic (18).
Governments all over the world have responded to the current COVID-19 pandemic by employing travel restrictions, city lockdowns, workplace hazard controls, and non-essential facility closures. These restrictions are gradually being eased systematically across the globe, and Nigeria is not an exemption. However, since the easing of lockdown in many parts of Nigeria, there have been instances of non-compliance with safety measures such as maintaining social distancing and consistent and correct use of face masks when in public places (19).
2. Objectives
It is against this backdrop that this study was conducted to determine the knowledge of the study population about social distancing, assess the level of practice of social distancing, determine the attitude towards the use of face masks, and determine the likely factors influencing the adoption of these NPI. The attitude of participants was graded using a 5-point Likert scale, ranging from strongly disagree to strongly agree. Marks were allotted to each response as stated below: Strongly disagree was allotted 5 marks, disagree 4 marks, undecided 3 marks, agree 2 marks, and strongly agree 1 mark. Hence, the least score obtainable was 10 marks, while the highest was 50 marks. Converting the score to percentage, 10% - 50% was graded negative attitude, while 51% - 100% was considered positive attitude. The level of knowledge displayed will be graded by allocating 20 marks to each correct answer, while zero was allotted to each wrong answer. Grading of correct scores will be done by converting the total obtainable correct score to percentage. Annotation for grading will be 0% - 100%, such that 0% - 49% will be described as poor knowledge and 50% - 79% as fair knowledge, while 80% - 100% will be described as good knowledge.
3. Methods
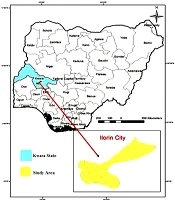
The study was conducted in Taiwo area, which is the Central Business District (CBD) of Ilorin, the capital city of Kwara State, North Central Nigeria (20). This area has a population of 777,667 people, making it the 7th largest city by population in Nigeria (21). Taiwo road is a dual carriage road located at the heart of Ilorin city, connecting the city center to other parts of the city. The majority of the main business activities of the city take place here (Figure 1).
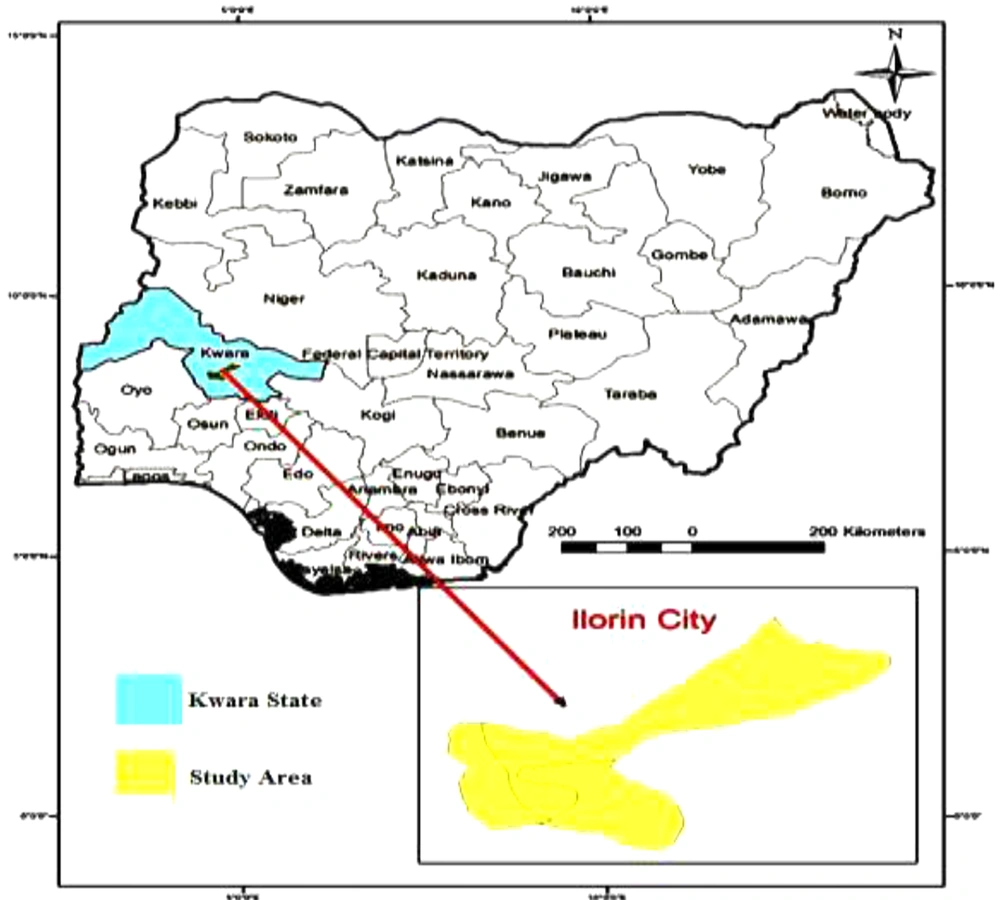
Figure 1.
Map of Nigeria showing Kwara State and Ilorin the Study Area (shaded) (22)
Located within this CBD are commercial banks, hospitals, boutiques, fuel filling stations, eateries, telecommunication outlets, offices, stadiums, schools, computer business centers, residential buildings, shopping malls, mini-markets, and religious houses, amongst others. It is usually densely populated in the daytime due to its numerous business activities, nightlife there is equally substantial. People from all walks of life, across various social classes and strata, with varying educational backgrounds and of different ethnicities can be found there at every point in time transacting.
A total of 300 participants selected through a simple random sampling technique participated in the study. Consenting men and women aged 18 years and above met at the CBD were interviewed. Research assistants were strategically located at various points in the CBD, interviewing businessmen and their prospective customers simultaneously. Individuals not up to the requisite age were excluded as well as those who could not converse in English and Yoruba, the prevalent native tongue. The concept of the study was explained to the participants in a language they could understand, and a written and verbal informed consent was obtained from them before the interview. The information retrieved through the interviewer-administered structured questionnaire was analyzed using SPSS, version 20. Variables were tested with chi-squared test, and information was presented in frequency tables and simple percentages.
4. Results
The sociodemographic characteristics of the participants is as depicted in Table 1. Male gender predominated (59.0% of all participants), most of whom were aged ≤ 30 years (49.0%). Other age distributions were 31 - 40 years (35.7%), 41 - 50 years (10.7%), 51 - 60 years (2.7%), and > 60 years (2.0%). Ethnicity likewise varied as 157 (52.3%) were Yoruba, the major language of the study area, and 104 (34.7%) were Igbo. Other ethnic groups represented included Hausa (4.3%), Nupe (4.3%), Ebira (2.7%), and Igala (1.3%). Educational attainment ranged from completing primary school education (15.0%) to attending a tertiary institution of learning in the country (60.7%). The respondents interviewed for the study were traders/businessmen and women who had their business outlets at the CBD (42.7%), public servants (7.7%), self-employed (10.3%), students (29.7%), and unemployed people (5.3%).
Table 1.
Sociodemographic Characteristics of the Respondentsa
| Sociodemographic Characteristics (N = 300) | No. (%) |
|---|---|
| Gender | |
| Male | 177 (59.0) |
| Female | 123 (41.0) |
| Age, y | |
| ≤ 30 | 147 (49.0) |
| 31 - 40 | 107 (35.7) |
| 41 - 50 | 32 (10.7) |
| 51 - 60 | 8 (2.7) |
| > 60 | 6 (2.0) |
| Religion | |
| Christianity | 219 (73.0) |
| Islam | 81 (27.0) |
| Ethnicity | |
| Yoruba | 157 (52.3) |
| Igbo | 104 (34.7) |
| Hausa | 13 (4.3) |
| Ebira | 8 (2.7) |
| Nupe | 13 (4.3) |
| Igara | 4 (1.3) |
| Tiv | 1 (0.3) |
| Edo | 8 (2.7) |
| Educational background | |
| None | 24 (8) |
| Primary | 45 (15.0) |
| Secondary | 73 (24.3) |
| Tertiary | 158 (52.7) |
| Occupation | |
| Business/trader | 128 (42.7) |
| Civil servant | 23 (7.7) |
| Public servant (political office holders) | 13 (4.3) |
| Self-employed | 31 (10.3) |
| Student | 89 (29.7) |
| Unemployed | 16 (5.3) |
aSource: Researchers’ survey, 2020.
What is known about social distancing was tested, and findings are reported in Table 2. The majority (93.3%) of the participants had heard about social distancing previously. Many were knowledgeable about what it entails, as 232 (77.3%) knew it involves keeping a physical distance of at least 6 feet from other people, 265 (88.3%) knew it involves avoiding gatherings, and 251 (87%) knew it involves staying out of crowded places and avoiding mass gatherings. The essence of social distancing, which is to reduce the likelihood of transmission of COVID-19, was known to 251 (83.7%) participants.
Table 2.
what is Known About Social Distancinga
| Knowledge on Social Distancing | No. (%) |
|---|---|
| Ever heard of social distancing | |
| Yes | 280 (93.3) |
| No | 20 (6.7) |
| social distancing can prevent spreading of covid-19 | |
| Yes | 251 (83.7) |
| No | 49 (16.3) |
| Social distancing is staying at least 6 feet (about 2 arms’ length) from other people | |
| Yes | 232 (77.3) |
| No | 68 (22.7) |
| Social distancing is avoiding gatherings | |
| Yes | 265 (88.3) |
| No | 35 (11.7) |
aSource: Researchers’ survey 2020.
Findings regarding the practice of social distancing by the participants is shown in Figure 2. Few participants (6.7%) practiced social distancing consistently, 30.7% had never practiced it, while 62.7% occasionally practiced it.
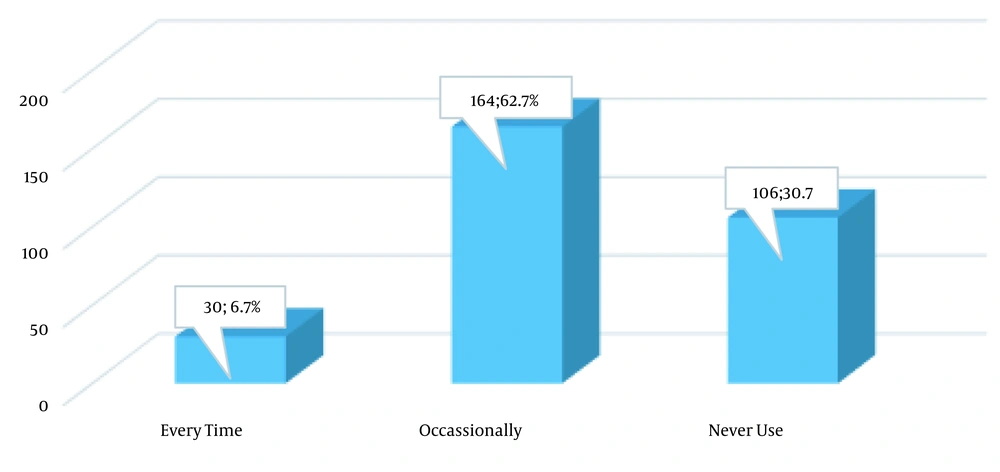
Figure 2.
The practice of social distancing by participants
All the participants knew what the face mask is and its use. Data regarding its usage is presented in Figure 3. Many were occasional users (54.7%), while a sizeable percentage did not use face masks at all (35.3%). In general, the participants displayed a positive attitude towards the use of the face masks (Figure 4). Questions asked to decipher the participants’ attitudes, which were scored using a 5-point Likert scale, included (Table 3) if the face mask makes one uncomfortable, if it disfigures the face, if it negatively affects the individual's dressing if it impairs normal breathing, if the individual is confident that its usage can prevent infection with the coronavirus, and if its use connotes infection in the user.
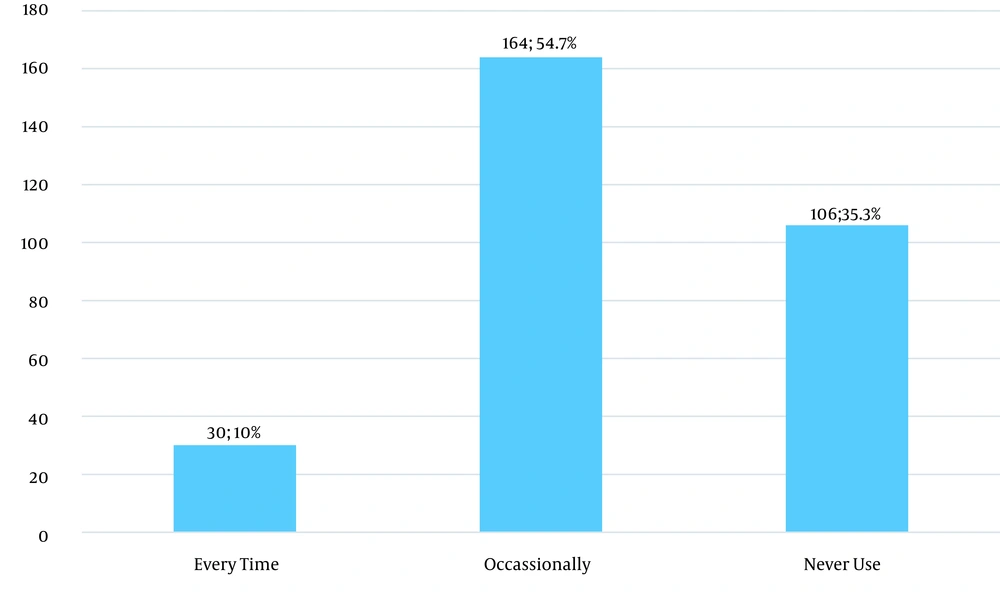
Figure 3.
Participant’s practice of face mask usage
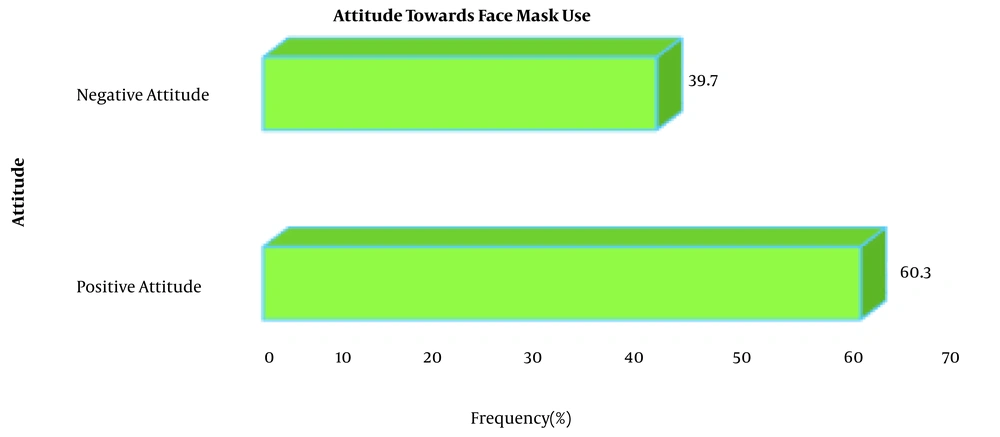
Figure 4.
Grading of participants’ attitude towards face mask
Table 3.
Attitude of the Participants Towards the Use of Face Masksa
| Attitude | Strongly Agree (%) | Agree (%) | Undecided (%) | Disagree (%) | Strongly Disagree (%) |
|---|---|---|---|---|---|
| I don’t like wearing face mask | 135 (45.0) | 73 (24.3) | 15 (5.0) | 23 (7.7) | 54 (18.0) |
| Face mask makes me feel uncomfortable | 165 (55.0) | 61 (20.3) | 5 (1.7) | 29 (9.7) | 40 (13.3) |
| Face mask disfigures my face | 103 (34.3) | 36 (12.0) | 45 (15.0) | 20 (6.7) | 96 (32.0) |
| Face affects my dressing | 95 (31.7) | 30 (10.0) | 25 (8.3) | 31 (10.3) | 119 (39.7) |
| Face mask affects my breathing | 134 (44.7) | 64 (21.3) | 9 (3.0) | 21 (7.0) | 72 (24.0) |
| Face mask is evil | 34 (11.3) | 22 (7.3) | 37 (12.3) | 44 (14.7) | 163 (54.3) |
| Face mask is just for fashion | 48 (16.0) | 52 (17.3) | 18 (6.0) | 43 (14.3) | 139 (46.3) |
| Those that wear face mask have corona virus | 13 (4.3) | 8 (2.7) | 15 (5.0) | 33 (11.0) | 231 (77.0) |
| I don’t have confidence in face mask | 61 (20.3) | 32 (10.7) | 35 (11.7) | 35 (11.7) | 137 (45.7) |
| I can never wear face mask | 50 (16.7) | 56 (18.7) | 36 (12.0) | 39 (13.0) | 119 (39.7) |
aSource: researcher’s survey.
Relating sociodemographic characteristics with knowledge on social distancing (Table 4) and attitude towards the use of face masks (Table 5), we found a statistically significant relationship between gender, age, education, and occupation of participants and the practice of social distancing (Figure 5). Male participants had a better knowledge than females (81.4%), and those < 30 years of age demonstrated a better knowledge than other age groups. Educational background likewise had a significant effect on the knowledge, as the majority of those with no formal education had poor knowledge (50%), unlike those with tertiary level of education whose majority had good knowledge (96.7%).
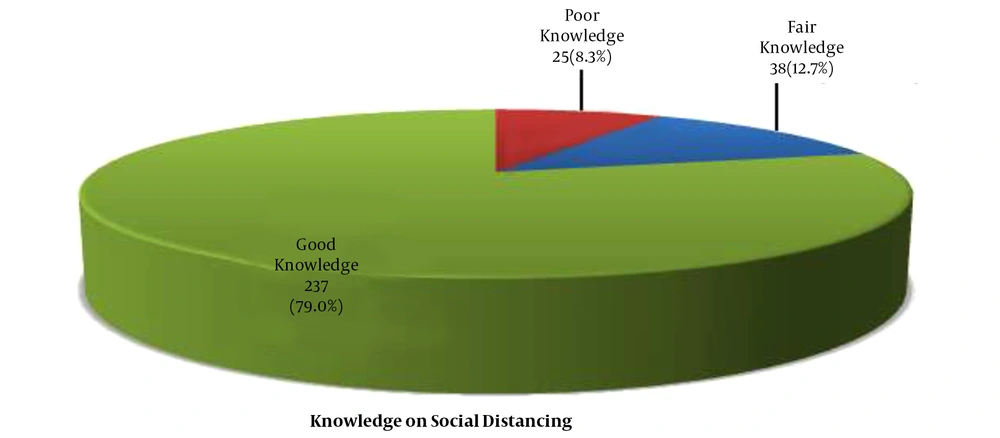
Figure 5.
Participants’ knowledge on social distancing
Table 4.
Relating Sociodemographic Characteristic with Knowledge on Social Distancing
| Sociodemographic Characteristics | Knowledge on Social Distancing | P-Value | |||
|---|---|---|---|---|---|
| Good Knowledge (%) | Fair Knowledge (%) | Poor Knowledge (%) | Total (%) | ||
| Gender | 0.018a | ||||
| Male | 144 (81.4) | 15 (8.5) | 18 (10.2) | 177 (100.0) | |
| Female | 93 (75.6) | 23 (18.7) | 7 (5.7) | 123 (100.0) | |
| Total | 237 (79.0) | 38 (12.7) | 25 (8.3) | 300 (100.0) | |
| Age, y | < 0.001a | ||||
| ≤ 30 | 116 (78.9) | 18 (12.2) | 13 (8.8) | 147 (100.0) | |
| 31 - 40 | 94 (87.9) | 9 (8.4) | 4 (3.7) | 107 (100.0) | |
| 41 - 50 | 23 (71.9) | 6 (18.8) | 3 (9.4) | 32 (100.0) | |
| 51 - 60 | 1 (12.5) | 3 (37.5) | 4 (50.0) | 8 (100.0) | |
| > 60 | 3 (50.0) | 2 (33.3) | 1 (16.7) | 6 (100.0) | |
| Total | 237 (79.0) | 38 (12.7) | 25 (8.3) | 300 (100.0) | |
| Educational attainmentb | 0.002a | ||||
| None | 6 (25) | 6 (25) | 12 (50) | 24 (100.0) | |
| Primary | 9 (20.0) | 21 (46.7) | 15 (33.3) | 45 (100.0) | |
| Secondary | 52 (71.2) | 13 (17.8) | 8 (11.0) | 73 (100.0) | |
| Tertiary | 176 (96.7) | 4 (2.2) | 2 (1.1) | 182 (100.0) | |
| Total | 237 (79.0) | 38 (12.7) | 25 (8.3) | 300 (100.0) | |
| Occupation | < 0.001a | ||||
| Business/trader | 107 (83.6) | 8 (6.3) | 13 (10.2) | 128 (100.0) | |
| Civil servant | 17 (73.9) | 4 (17.4) | 2 (8.7) | 23 (100.0) | |
| Public servant | 9 (69.2) | 4 (30.8) | 0 (0.0) | 13 (100.0) | |
| Self-employed | 12 (38.7) | 10 (32.3) | 9 (29.0) | 31 (100.0) | |
| Student | 78 (87.6) | 10 (11.2) | 1 (1.1) | 89 (100.0) | |
| Unemployed | 14 (87.5) | 2 (12.5) | 0 (0.0) | 16 (100.0) | |
| Total | 237 (79.0) | 38 (12.7) | 25 (8.3) | 300 (100.0) | |
aStatistical significance at a P-value < 0.05.
bPrimary education: first stage of formal education, equivalent of International Standard Classification of Education (ISCED) level 1; secondary education: comprises of the first 6 years after primary education, equivalent of ISCED level 2; tertiary education: includes in the minimum, degrees from universities, colleges of education, polytechnic, technical schools, up to the highest level of higher educational attainment, which is doctorates and postdoctoral qualifications (Dr, PhD). It is an equivalent of ISCED levels 6 - 8.
Table 5.
Relating the Participant’s Sociodemographic Characteristics with Attitude Towards the use of Face Masks
| Demographic Data | Attitude Towards Face Mask Wearing | P-Value | ||
|---|---|---|---|---|
| Positive Attitude (%) | Negative Attitude (%) | Total (%) | ||
| Gender | 0.035a | |||
| Male | 98 (55.4) | 7 (44.6) | 177 (100.0) | |
| Female | 83 (67.5) | 40 (32.5) | 123 (100.0) | |
| Total | 181 (60.3) | 119 (39.7) | 300 (100.0) | |
| Age, y | 0.187 | |||
| ≤ 30 | 86 (58.5) | 61 (41.5) | 147 (100.0) | |
| 31 - 40 | 72 (67.3) | 35 (32.7) | 107 (100.0) | |
| 41 - 50 | 18 (56.3) | 14 (43.8) | 32 (100.0) | |
| 51 - 60 | 3 (37.5) | 5 (62.5) | 8 (100.0) | |
| > 60 | 2 (33.3) | 4 (66.7) | 6 (100.0) | |
| Total | 181 (60.3) | 119 (39.7) | 300 (100.0) | |
| Educational attainmentb | 0.0014a | |||
| None | 2 (8.3) | 22 (91.7) | 24 (100.0) | |
| Primary | 16 (35.6) | 29 (64.4) | 45 (100.0) | |
| Secondary | 39 (53.4) | 46.6% | 73 (100.0) | |
| Tertiary | 124 (78.5) | 34 (21.5) | 158 (100.0) | |
| Total | 181 (60.3) | 119 (39.7) | 300 (100.0) | |
| Occupation | 0.197 | |||
| Business/trader | 73 (57.0) | 55 (43.0) | 128 (100.0) | |
| Civil servant | 14 (60.9) | 9 (39.1) | 23 (100.0) | |
| Public servant | 11 (84.6) | 2 (15.4) | 13 (100.0) | |
| Self-employed | 17 (54.8) | 14 (45.2) | 31 (100.0) | |
| Student | 59 (66.3) | 30 (33.7) | 89 (100.0) | |
| Unemployed | 7 (43.8) | 9 (56.3) | 16 (100.0) | |
| Total | 181 (60.3) | 119 (39.7) | 300 (100.0) | |
aStatistical significance at a P-value < 0.05.
bPrimary education: first stage of formal education, equivalent of International Standard Classification of Education (ISCED) level 1; secondary education: comprises of the first 6 years after primary education, equivalent of ISCED level 2; tertiary education: includes in the minimum, degrees from universities, colleges of education, polytechnic, technical schools, up to the highest level of higher educational attainment which is doctorates and postdoctoral qualifications (Dr, PhD). It is an equivalent of ISCED levels 6 - 8.
Gender and educational background had significant effects on the attitude of participants to the use of face masks. A positive attitude was mostly observed in males (54.1%) and those with tertiary education (68.5%).
5. Discussion
The COVID-19 has no known curative therapeutic agent, and neither is there a potent vaccine available in its prevention. It is therefore imperative to take preventive measures to limit the spread of the infection (22). Non-pharmaceutical interventions can reduce the transmission of diseases whose mode of transmission is via droplet contact, direct physical contact, and indirect physical contact (e.g., by touching a surface contaminated with virus, usually in fomites) (16). Its use dates as far back as the 1918 - 1919 influenza pandemic, during which a number of United States cities implemented home quarantine for infected persons, social distancing, and a reduction in public gatherings such as church meetings and closure of schools (23). The COVID-19 pandemic is still ongoing, and it is too early to make categorical statements on the success or otherwise of NPI in preventing the spread of the disease.
This study assessed the use of NPIs in curbing the spread of COVID-19 in a metropolis in North Central Nigeria. The interventions assessed were social distancing and face mask use. Results from the study suggest that participants had a good knowledge of the concept of SD. This finding is similar to the results of a survey conducted among 1750 households in Delhi, a metropolitan city in India, in which participants demonstrated an equally good knowledge of SD, with about 85% of the participants in the study attesting to the efficacy of this interventional strategy in preventing COVID-19 spread (24). The good knowledge displayed by participants may stem from the availability of information on media, print, and non-print, which many people have access, to most especially social media. This also may be the probable reason for the younger individuals less than 30 years of age having a better knowledge on the subject than older age groups as they spend more time surfing the social media.
The face mask serves as a means of source control when worn by an infected person and at the same time a protective tool to the uninfected, protecting them from the virus peradventure they come in contact with an infected individual (25). Its use, though unmistakably necessary, needs to be correctly and consistently done. To achieve this, the individual needs to have the right perception about the face mask, resulting in a positive attitude concerning its usage. A wrongly worn face mask is as good as not using it at all, while the incorrect handling of the mask while worn and after removal is equally as dangerous as not wearing, as the virus SARS CoV2 has been seen to persist on the face mask surface for up to seven days (26). The incorrect use and disposal of face masks may actually increase the rate of transmission (27).
The attitude of participants towards wearing face masks was generally a positive one, though many were occasional users. Its limited usage despite a positive attitude might stem from low risk perception about COVID-19 drawn from the low disease incidence reported in Africa compared to other parts of the world (28). This finding corroborates the result from a previous study conducted in Jordan in which participants a demonstrated positive attitude towards face mask wearing as a measure for preventing COVID-19 (29).
Reasons for the inconsistent or non-usage of face masks include feeling uncomfortable while wearing and its negative impact on breathing. These were some of the reasons highlighted in a study on face mask perception and face mask wearing (22). In that study, gender was noted to significantly influence face mask perception hence positive attitude to its use, as seen in our study. Gender and age likewise influenced achieving a good knowledge about social distancing. Other reasons for the low uptake were the belief that those who wear a mask are infected with the virus and a lack of confidence in the efficacy of the mask in preventing the infection. This could be as a result of mistrust in science and government rolling out policies, with the belief that the policies are for personal interest and marred with corruption (30). The use of mask is still being stigmatized in numerous countries, with wearers being labeled as infected (31).
Cloth masks were favored for use in low-income countries due to their ease of production, availability of material for its use, and its low cost. It is meant to offer barrier to the entry of the virus hence reducing the rate and likelihood of transmission through the performance of this type of mask is less than the surgical mask or the respirators. Studies have shown that community transmission could be reduced if everyone, asymptomatic or symptomatic, used face masks (29). It is particularly essential for all in countries like ours where testing coverage is still low. Asymptomatic, pre-symptomatic, and those with mild symptoms will continue to mingle with others in the community, transmitting infection to them.
5.1. Conclusions
Participants have good knowledge of social distancing even though not widely practiced and demonstrate positive attitude towards wearing face masks as a measure of preventing the spread of COVID-19, though it is not consistently and correctly worn. Intensified efforts in education on the right use and essence of these interventions is strongly recommended, preferably in the local and pidgin languages, for the information to be well understood and internalized.