
1. Background
COVID-19 is a respiratory disease caused by severe acute respiratory syndrome coronavirus 2 (SARS-CoV2). The clinical symptoms of COVID-19 range from no symptoms to a respiratory failure that requires mechanical ventilation and special care. The first report of the clinical symptoms of COVID-19 by Huang et al. in Wuhan, China showed that all the 41 patients investigated in a study reported fever, dry cough, fatigue, and shortness of breath, and a chest computed tomography (CT) scan showed lung involvement in all the cases. Hospitalization in intensive care unit (ICU) was necessary in 32% of the cases, and 15% of the patients died (1). The symptoms were more common in the patients affected by diabetes mellitus (DM) and hypertension (HTN) (1). The best and easiest general way to prevent this disease is to stay at home (2).
Various clinical conditions are associated with SARS-CoV2 infection. Although the disease mainly affects the respiratory system, its complications and its multiorgan involvements, like involvements of the cardiovascular, renal, and central nervous systems, can also cause death (3, 4). Lack of information in this area has made COVID-19 patients’ prognosis and management a challenging task. Also, identifying the controllable factors can decline the mortality rate and irreparable complications. Regarding the resource limitations, particularly in ICUs, the results of this research can facilitate better allocation of resources to patients based on their prognosis. Therefore, the present study has been performed to determine the clinical and laboratory factors associated with the mortality of hospitalized COVID-19 patients in Semnan, Iran.
2. Objectives
In this study, we investigated the relationship between clinical and laboratory findings and mortality in patients with COVID-19.
3. Methods
3.1. Study Design
This descriptive-analytic study was performed in Kowsar Hospital (Corona center) of Semnan in March 2020. For this purpose, medical files of 107 patients hospitalized from February 27th until April 16th were extracted from the medical archive. In all the cases, a chest CT scan showed lung involvement caused by COVID-19. The diagnosis of COVID-19 was approved by an expert pulmonologist and a radiologist (based on real-time PCR test [RT-PCR] for COVID-19/or having ground glass opacity in lung CT scan). The patient's demographic information, data on vital signs, clinical symptoms, lab test results, prescribed medicines during hospitalization, past medical history, and outcomes were recorded. To ensure the accuracy of the included information, the discharged patients or their families were called and asked to check some of the recorded information (demographic information, symptoms, and past medical history). Clinical symptoms and vital signs were related to the first day of hospitalization (on admission). The lab test results were also related to the patient's first blood sample at the time of hospitalization. Glasgow coma scale (GCS) less than 14 was considered low. The basis of the information was the medical history that was recorded in the patients' files and was taken from the patient by the doctors and nurses at the hospital, and his/her recorded progress notes. A researcher-made form was used to collect information.
The inclusion criteria included: being hospitalized in the coronavirus ward of Kowsar Hospital of Semnan, the definitive diagnosis of COVID-19 by RT-PCR test, or probable diagnosis with the presence of lung involvement.
The exclusion criteria included: incomplete medical file, lack of access to the patient or their family, and unwillingness to participate in the study. In this study, only at-hospital mortality or discharge from the hospital was considered as the primary outcome, and those who were referred to another hospital were excluded from the study.
3.2. Statistical Analysis
In this study, frequency distribution (count and percentage) and mean and standard deviations (SD) were used to describe the qualitative and quantitative data, respectively. The relationship between each of the explanatory variables with death outcome was examined first by univariate logistic regression models, reporting crude odds ratios (OR). In the next step and after omitting some variables that had collinearity with other variables, we entered the ones whose P-values were significant or liberal (less than 0.1) into a multivariate model to estimate adjusted ORs (Adj. OR), followed by a backward stepwise likelihood ratio method, to achieve a reduced model. SPSS version 20 was used for data analysis, and a P-value of less than 0.05 was considered significant.
3.3. Ethical Issues
This study followed the tenets of the Declaration of Helsinki. The Ethics Committee of Semnan University of Medical Sciences approved this study (#IR.SEMUMS.REC.1399.002).
4. Results
4.1. The Patients’ Profile
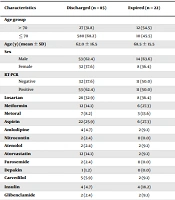
The mean (± SD) age of the patients was 63.36 ± 16.43 years, 67 (62.6%) patients were male, and 85 (79.4%) patients were discharged. In 53 (62.4%) patients, the result of the RT-PCR test was reported positive on admission (Table 1).
Table 1.
The Relationship Between Age, Gender, RT-PCR Test Result, Drug History and Past Medical History of the Patients and Mortality a
| Characteristics | Discharged (n = 85) | Expired (n = 22) | OR | 95% CI | P | |
|---|---|---|---|---|---|---|
| Lower | Upper | |||||
| Age group | ||||||
| > 70 | 27 (31.8) | 12 (54.5) | 2.57 | 0.992 | 6.701 | 0.052 |
| ≤ 70 | 580 (68.2) | 10 (45.5) | 1 | - | - | - |
| Age (y) (mean ± SD) | 62.0 ± 16.5 | 68.5 ± 15.5 | 1.03 | 0.995 | 1.059 | 0.103 |
| Sex | ||||||
| Male | 53 (62.4) | 14 (63.6) | - | - | - | - |
| Female | 32 (37.6) | 8 (36.4) | 0.94 | 0.35 | 2.50 | 0.912 |
| RT-PCR | ||||||
| Negative | 32 (37.6) | 11 (50.0) | 0.60 | 0.23 | 1.55 | 0.295 |
| Positive | 53 (62.4) | 11 (50.0) | 1 | - | - | - |
| Losartan | 28 (32.9) | 8 (36.4) | 1.16 | 0.43 | 3.09 | 0.762 |
| Metformin | 12 (14.1) | 6 (27.3) | 2.28 | 0.74 | 6.98 | 0.149 |
| Metoral | 7 (8.2) | 3 (13.6) | 1.75 | 0.40 | 7.44 | 0.443 |
| Aspirin | 22 (25.9) | 6 (27.3) | 1.07 | 0.37 | 3.58 | 0.895 |
| Amlodipine | 4 (4.7) | 2 (9.1) | 2.02 | 0.34 | 11.84 | 0.434 |
| Nitrocontin | 2 (2.4) | 0 (0.0) | - | - | - | - |
| Atenolol | 2 (2.4) | 2 (9.1) | 4.15 | 0.55 | 31.2 | 0.167 |
| Atorvastatin | 12 (14.1) | 2 (9.1) | 0.60 | 0.12 | 2.94 | 0.537 |
| Furosemide | 2 (2.4) | 0 (0.0) | - | - | - | - |
| Depakin | 1 (1.2) | 0 (0.0) | - | - | - | - |
| Carvedilol | 5 (5.9) | 2 (9.1) | 1.60 | 0.28 | 8.85 | 0.590 |
| Insulin | 4 (4.7) | 4 (18.2) | 4.50 | 1.02 | 19.70 | 0.046 b |
| Glibenclamide | 2 (2.4) | 2 (9.1) | 4.15 | 0.55 | 31.28 | 0.167 |
| Propranolol | 1 (1.2) | 0 (0.0) | - | - | - | - |
| Captopril | 1 (1.2) | 0 (0.0) | - | - | - | - |
| Digoxin | 0 (0.0) | 2 (9.1) | - | - | - | - |
| Corticosteroids | 1 (1.2) | 0 (0.0) | - | - | - | - |
| Immunosuppressive | 1 (1.2) | 0 (0.0) | - | - | - | - |
| Influenza Vaccine | 4 (4.7) | 2 (9.1) | 2.02 | 0.34 | 11.84 | 0.430 |
| Hypertension | 41 (48.2) | 16 (72.7) | 2.86 | 1.02 | 8.01 | 0.045 b |
| Diabetes mellitus | 20 (23.5) | 11 (50.0) | 3.25 | 1.22 | 8.61 | 0.018 b |
| BMI > 40 | 3 (3.5) | 1 (4.5) | 1.30 | 0.12 | 13.15 | 0.823 |
| Ischemic heart disease | 25 (29.4) | 6 (27.3) | 0.90 | 0.31 | 2.56 | 0.844 |
| Cancer | 3 (3.5) | 2 (9.1) | 2.73 | 0.43 | 17.46 | 0.288 |
| Pulmonary disease | 12 (14.1) | 2 (9.1) | 0.60 | 0.12 | 2.94 | 0.537 |
| Asthma | 5 (5.9) | 1 (4.5) | 0.76 | 0.08 | 6.87 | 0.809 |
| Cerebrovascular accident | 7 (8.2) | 4 (18.2) | 2.47 | 0.65 | 9.37 | 0.182 |
| Chronic kidney disease | 6 (7.1) | 4 (18.2) | 2.92 | 0.74 | 11.45 | 0.123 |
| Chronic Liver disease | 2 (2.4) | 1 (4.5) | 1.97 | 0.17 | 22.84 | 0.585 |
| Opium | 8 (9.4) | 2 (9.1) | 0.96 | 0.18 | 4.89 | 0.963 |
| Smoking | 7 (8.2) | 2 (9.1) | 1.11 | 0.21 | 5.78 | 0.963 |
| Pregnancy | 0 (0.0) | 0 (0.0) | - | - | - | - |
| Hospitalization c | 4 (4.7) | 4 (18.2) | 4.50 | 1.52 | 19.70 | 0.046 b |
| Hyperlipidemia | 10 (11.8) | 3 (13.6) | 1.18 | 0.29 | 4.73 | 0.811 |
| Rheumatoid arthritis | 1 (1.2) | 0 (0.0) | - | - | - | - |
a Values are expressed as No. (%) unless otherwise indicated.
b Significant.
c Hospitalization: past 6 months.
4.2. Drug History and Past Medical History
The most common drugs used by the patients were losartan and aspirin. Among the used drugs, insulin use was significantly associated with death (P = 0.046, OR = 4.5). Table 1 presents the drugs used by the patients in terms of the final outcome.
The most common complications reported by the patients were hypertension (HTN), ischemic heart diseases, and diabetes mellitus (DM). Based on the results, HTN, DM, and hospitalization over the past six months had significant associations with mortality (with the respective P-values of 0.045, 0.018, and 0.045 and the respective OR values of 4.5, 3.25, and 2.86). Table 1 presents the patients’ medical records in terms of the final outcome.
4.3. Symptoms and Vital Signs
Fatigue was reported by 60 (56.07%) patients. After that, the most frequent symptoms reported were fever (54.2%) and cough (51.4%). Among the reported symptoms, fatigue showed a significant relationship with the increased chance of mortality (P = 0.041, OR = 0.36). Table 2 presents the patients’ symptoms at the time of hospitalization and their relationship with mortality.
Table 2 also shows the patients’ vital signs at the time of hospitalization and their relationship with death. Among the mentioned vital signs, increased body temperature, respiratory rate (RR) per minute, and decreased blood oxygen saturation displayed significant associations with mortality. In patients presenting with decreased consciousness, the mortality chance was significantly higher than other patients.
Table 2.
The Relationship Between the Symptoms of the Patients and Their Vital Signs at the Time of Hospitalization and Mortality a
| Symptoms and Vital Signs | Discharged (n = 85) | Expired (n = 22) | OR | 95% CI | P | |
|---|---|---|---|---|---|---|
| Lower | Upper | |||||
| Fever | 47 (55.3) | 11 (50.0) | 0.80 | 0.31 | 2.06 | 0.657 |
| Headache | 12 (14.1) | 3 (13.6) | 0.96 | 0.24 | 3.75 | 0.954 |
| Cough | 47 (55.3) | 8 (36.4) | 0.46 | 0.17 | 1.21 | 0.118 |
| Fatigue/weakness | 52 (61.2) | 8 (36.4) | 0.36 | 0.13 | 0.95 | 0.041 b |
| Vertigo/dizziness | 7 (8.2) | 2 (9.1) | 1.11 | 0.21 | 5.78 | 0.890 |
| Dyspnea | 41 (48.2) | 15 (68.2) | 2.30 | 0.85 | 6.20 | 0.100 |
| Confusion | 8 (9.4) | 5 (22.7) | 2.83 | 0.82 | 9.72 | 0.99 |
| Sweating | 7 (8.2) | 0 (0) | - | - | - | - |
| Runny nose | 2 (2.4) | 0 (0) | - | - | - | - |
| Sore throat | 7 (8.2) | 0 (0) | - | - | - | - |
| Hemoptysis | 3 (3.5) | 1 (4.5) | 1.35 | 0.12 | 13.15 | 0.823 |
| Sputum | 11 (12.9) | 1 (4.5) | 0.32 | 0.03 | 2.62 | 0.289 |
| Anorexia | 28 (32.9) | 5 (22.7) | 0.59 | 0.20 | 1.79 | 0.359 |
| Nausea and vomiting | 22 (25.9) | 6 (27.3) | 1.07 | 0.37 | 3.08 | 0.895 |
| Abdominal pain | 5 (5.9) | 2 (9.1) | 1.60 | 0.28 | 8.85 | 0.590 |
| Diarrhea | 5 (5.9) | 1 (4.5) | 0.76 | 0.08 | 6.87 | 0.809 |
| Muscular pain/myalgia | 28 (32.9) | 5 (22.7) | 0.59 | 0.20 | 1.79 | 0.359 |
| Temperature (°C) | 37.10 ± 0.87 | 37.74 ± 1.5 | 1.65 | 1.09 | 2.51 | 0.017 b |
| Pulse rate (per minute) | 89 ± 11 | 88 ± 16 | 0.99 | 0.95 | 1.03 | 0.738 |
| Respiratory rate (per minute) | 19 ± 2 | 21 ± 4 | 1.23 | 1.04 | 1.44 | 0.011 b |
| SBP (mmHg) | 128 ± 17 | 126 ± 19 | 0.99 | 0.96 | 1.02 | 0.586 |
| DBP (mmHg) | 78 ± 8 | 77 ± 10 | 0.98 | 0.93 | 1.04 | 0.673 |
| O2 saturation (%) | 89 ± 7 | 82 ± 11 | 0.91 | 0.86 | 0.97 | 0.002 b |
| GCS | ||||||
| Low (< 14) | 7 (8.2) | 9 (40.9) | 7.71 | 2.44 | 24.34 | < 0.001 |
| Normal | 78 (91.8) | 13 (59.1) | 1 | - | - | - |
Abbreviations: SBP, systolic blood pressure; DBP, diastolic blood pressure.
a Values are indicated as No. (%) or mean ± SD unless otherwise indicated.
b Significant.
4.4. Lab Tests
According to the findings, a decreased level of hemoglobin (Hb), hematocrit (HCT), red blood cell (RBC) count, and lymphocyte percentage (LYM) and an increased level of lactate dehydrogenase (LDH), blood urea nitrogen (BUN), percentage of neutrophils, and white blood cell (WBC) count were showed to be in association with a significant increase in the risk of mortality. Table 3 displays the test results of the patients on the first day of admission and their relationship with mortality (Table 3).
Table 3.
The Relationship Between the Lab Test Results of the Patients at the Time of Hospitalization and Mortality a
| Lab Test | Discharged (n = 85) | Expired (n = 22) | OR | 95% CI | P | |
|---|---|---|---|---|---|---|
| Lower | Upper | |||||
| HB | 12.62 ± 1.60 | 11.28 ± 2.96 | 0.70 | 0.54 | 0.91 | 0.007 b |
| HCT | 38.46 ± 4.53 | 34.16 ± 8.43 | 0.86 | 0.79 | 0.95 | 0.003 b |
| WBC | 7.33 ± 3.75 | 10.86 ± 6.96 | 1.14 | 1.04 | 1.26 | 0.005 b |
| RBC | 4.67 ± 0.62 | 4.15 ± 1.04 | 0.36 | 0.18 | 0.74 | 0.005 b |
| Platelet | 208.72 ± 79.84 | 196.73 ± 72.30 | 0.99 | 0.98 | 1.00 | 0.520 |
| Lymphocyte% | 21.68 ± 11.20 | 11.72 ± 7.69 | 0.88 | 0.83 | 0.94 | < 0.001 b |
| Neutrophil % | 72.11 ± 12.37 | 82.40 ± 8.35 | 1.09 | 1.03 | 1.16 | 0.001 b |
| Monocyte % | 4.53 ± 2.63 | 3.95 ± 2.92 | 0.91 | 0.75 | 1.11 | 0.372 |
| Eosinophil % | 1.30 ± 1.15 | 1.31 ± 1.21 | 1.01 | 0.67 | 1.51 | 0.961 |
| ALT | 39.22 ± 34.84 | 41.74 ± 28.86 | 1.00 | 0.98 | 1.01 | 0.754 |
| AST | 41.20 ± 29.18 | 53.84 ± 41.79 | 1.01 | 0.99 | 1.02 | 0.119 |
| ALP | 177.66 ± 87.34 | 247.65 ± 207.48 | 1.00 | 1.00 | 1.00 | 0.053 |
| ESR | 49.34 ± 93.42 | 41.06 ± 21.77 | 0.99 | 0.98 | 1.01 | 0.697 |
| CRP | 30.92 ± 25.18 | 43.93 ± 49.16 | 1.01 | 0.99 | 1.02 | 0.112 |
| BUN | 21.24 ± 12.05 | 39.68 ± 36.23 | 1.04 | 1.01 | 1.07 | 0.004 b |
| Creatinine | 12.3 ± 8.2 | 17.4 ± 17.8 | 1.39 | 0.93 | 2.07 | 0.100 |
| Troponin (first) | 0.35 ± 0.54 | 0.44 ± 0.69 | 1.23 | 0.61 | 2.47 | 0.540 |
| Troponin (second) | 0.35 ± 0.20 | 0.71 ± 1.84 | 1.50 | 0.74 | 3.05 | 0.256 |
| CPK | 230.14 ± 241.67 | 510.99 ± 654.79 | 1.002 | 1.000 | 1.002 | 0.160 |
| LDH | 572.42 ± 189.71 | 670.57 ± 178.78 | 1.003 | 1.000 | 1.005 | 0.036 b |
Abbreviations: ALT, alanine transaminase; AST, aspartate transaminase; ALP, alkaline phosphatase; ESR, erythrocyte sedimentation rate; CRP, C-reactive protein; CPK, creatine phosphokinase.
a Values are expressed as mean ± SD unless otherwise indicated.
b Significant.
Of all the above clinical and para-clinical explanatory variables, the crude odds ratios for some of them was liberal (or significant) in terms of reported P-values (P ≤ 0.1), including age group, using insulin, history of DM or HTN, history of hospitalization within the past six months, having fatigue or weakness, body temperature, respiratory rate, having dyspnea, O2 saturation, increased GCS, HB, HCT, WBC, RBC, LYM, neutrophil percentage, Alkaline phosphatase (ALP), BUN, and LDH. They were entered into a multivariate logistic regression model, and some variables (including insulin, HCT, HB, dyspnea, LYM, neutrophil percentage, and creatinine) were omitted due to collinearity. Table 4 shows the Adj. ORs for the relationship between each of the above-mentioned clinical and laboratory variables and mortality.
Table 4.
The Adjusted Odds Ratio for the Relationship Between Each of the Most Important Clinical and Laboratory Variables at the Time of Hospitalization and Mortality a
| Variables | Full Model | P | Reduced Model | P | ||||
|---|---|---|---|---|---|---|---|---|
| Adj. OR | 95% CI | Adj. OR | 95% CI | |||||
| Lower | Upper | Lower | Upper | |||||
| Age > 70 | 1.34 | 0.22 | 8.17 | 0.745 | - | - | - | |
| Hypertension | 1.76 | 0.30 | 10.40 | 0.529 | - | - | - | |
| Diabetes mellitus | 0.68 | 0.09 | 5.11 | 0.716 | - | - | - | |
| Hospitalization (past 6 months) | 1.81 | 0.16 | 19.88 | 0.628 | - | - | - | |
| Fatigue/weakness | 0.08 | 0.01 | 0.74 | 0.026* | 0.06 | 0.01 | 0.46 | 0.007 b |
| Temperature (°C) | 3.85 | 1.51 | 9.76 | 0.004* | 3.62 | 1.55 | 8.43 | 0.003 b |
| Respiratory rate | 1.19 | 0.92 | 1.52 | 0.168 | 1.17 | 0.96 | 1.43 | 0.118 |
| O2 saturation (%) | 0.92 | 0.85 | 1.01 | 0.087 | 0.92 | 0.85 | 0.99 | 0.030 b |
| Low GCS(< 14) | 13.83 | 2.18 | 87.63 | 0.005* | 17.91 | 3.14 | 102.07 | 0.001 b |
| WBC | 1.06 | 0.89 | 1.26 | 0.492 | - | - | - | |
| RBC | 0.24 | 0.07 | 0.83 | 0.024* | 0.21 | 0.08 | 0.55 | 0.002 b |
| ALP | 1.00 | 0.99 | 1.01 | 0.133 | 1.01 | 1.00 | 1.01 | 0.038 b |
| BUN | 1.01 | 0.98 | 1.04 | 0.441 | - | - | - | |
| LDH | 1.00 | 0.99 | 1.00 | 0.957 | - | - | - | |
Abbreviations: Adj. OR, adjusted odds ratio; CI, confidence interval.
a Reduced model was developed using the backward stepwise LR (likelihood ratio) method.
b Significant.
As seen in Table 4, low level of consciousness (GCS < 14) at the time of hospitalization (discharged: 8.2% vs. expired: 40.2%, Adj. OR [95% confidence interval] = 17.9 [3.1, 102.7]), higher body temperature (37.1 vs. 37.74°C, 3.62 [1.55, 8.43]), and higher ALP (177.6 vs. 247.6, 1.01 [1.00, 1.01]) were associated with increased mortality. Also, having the symptom of fatigue or weakness at the time of hospitalization (61.2 vs. 36.4%, 0.06 [0.01, 0.46]), higher RBC count (4.67 vs. 4.15, 0.21 [0.08, .55]), and higher blood oxygen saturation levels (89 vs. 82%, 0.92 [0.85, 0.99]) at the time of hospitalization were associated with a decreased risk of mortality.
5. Discussion
We sought to assess the relationship between several demographic, clinical, and laboratory findings and COVID-19 mortality. In the case of demographic factors, the P-value of age was not significant but was notable in favor of old age being a risk factor for COVID-19 mortality. Previous studies also confirmed that older patients have a higher risk of mortality, especially those ≥ 65 years old (5-7). This risk factor was also found with other coronaviruses, including the severe acute respiratory syndrome (SARS) virus and the Middle East respiratory syndrome (MERS) virus (8, 9). It is believed that cellular immunity becomes compromised with advancing ages, and the subsequent B-cell and T-cell defects, along with excessive production of type 2 cytokines lead to uncontrolled virus replication and cause poor prognosis (10). Furthermore, older patients have more comorbidities, and this makes their prognosis even poorer (11).
Hypertension and DM are two major risk factors for COVID-19 mortality (6), and our study further corroborated it. It has been proposed that DM and HTN cause poor prognosis in other viral infections, such as MERS and influenza viruses (12, 13). The higher circulating ACE2, as a receptor that underlies in the pathogenesis of COVID-19 infection, is found in DM and HTN patients, and thus, this can be proposed as one of the mechanisms leading to the higher mortality in these patients (14). Moreover, although patients with progressive DM have some levels of β-cells malfunction, COVID-19 itself causes dysfunction in β-cells. In this regard, patients receiving insulin treatment usually have a poor DM control, and this poor control DM aggravates their COVID-19 infection (15). In fact, in line with the findings of our study, other studies proposed that DM patients under insulin therapy have a higher risk of mortality (15, 16).
The underlying pathogenesis of infection aggravation in COVID-19 also involves the heavy release of cytokines, including interleukin (IL)-6, interleukin 1B, interferon γ, interferon γ-inducible protein-10, and monocyte chemoattractant protein 1, named as a cytokine storm. This heavy release is accompanied by leukocytosis and neutrophilia that are responsible for the solid inflammatory reaction. This high level of immune system cells and molecules is found in peripheral blood circulation and lung tissue, causing severe injury to the respiratory system followed by acute respiratory distress syndrome (ARDS) (17). Moreover, these high levels of cytokines are responsible for higher body temperatures and high levels of CRP (18). Previous studies confirmed leukocytosis, neutrophilia, and high CRP as three major risk factors for mortality in COVID-19 infection. Also, high fever and acute respiratory distress syndrome (ARDS) are associated with poor prognosis (19). Moreover, ARDS causes low blood oxygen saturation, altered RR, and finally, low levels of consciousness (20). Our findings support that leukocytosis, neutrophilia, high temperatures, low blood oxygen saturation, high RR, and low GCS are predictors of poor prognosis.
One of the findings was that patients with a lower level of fatigue had higher mortality. In other words, patients with symptoms of fatigue were less likely to die. Tian et al. showed in their study that fatigue is higher in patients who died of COVID‐19 (21), which is in discord with the results of the present study. The association of fatigue with better outcome may be attributed to the association of this symptom with the absence of more severe conditions, which were not considered in this study. Given that fatigue is one of the most common long-term complications in patients recovering from COVID-19, it may be associated with discharge rate due to a longer interval between the onset of symptoms and hospitalization in this group of patients.
Another marker of poor prognosis that was also found in our study is lymphopenia; however, the exact pathogenesis of reduced leukocyte counts is not fully known in these patients. It is believed that lymphocytes present the ACE2 receptor, which is a COVID-19 receptor that causes apoptosis and reduction in this cell line (22). Furthermore, the virus may directly destroy lymphatic organs such as the thymus and spleen (23). Also, the release of cytokines, including tumor necrosis factor (TNF) α, interleukin-6 (IL-6), and other pro-inflammatory cytokines, can cause lymphocyte deficiency (24). Red blood cells are another cell line that is associated with prognosis. Our study and other similar studies proposed that low RBC and low HB are associated with poor prognosis (25, 26). The underlying mechanism was proposed to be the expression of the ACE2 receptor; however, the mechanism is not fully understood (27). Furthermore, the role of transfusion should be further investigated (28).
Lactate dehydrogenase (LDH) was another predicting factor for poor prognosis in our study that was supported by other studies. Lactate dehydrogenase is a crucial enzyme that plays a role in glucose metabolism by converting pyruvate to lactate; this enzyme is primarily expressed in the liver and heart tissue (29). It is believed that excess in this marker is associated with higher rates of lung injury, higher CRP levels, and poorer CT scores (30). Lactate dehydrogenase can be a marker of multiple organ damage, and in this regard, it is proposed as a marker of poor prognosis (31). Blood urea nitrogen is another laboratory marker that its higher level is associated with a poorer prognosis. Previous studies reported that this marker is not only a predictor of mortality in COVID-19 infection, but also it predicts death in all critically-ill patients that are admitted to the intensive care unit and have multiple organ damages (32).
We proposed several clinical and laboratory findings concerning mortality, and with this regard, we have done a comprehensive study that can be a strong point. However, some shortcomings can be addressed in this study as we only investigated these factors in an Iranian population and for limited time. Further future studies can add complementary information to this study. Limited sample size led to underpowered results, which is a limitation of the study. Another limitation is the absence of pre-designed questionnaires, which might have led to several biases as more severely ill patients were under more detailed investigations, or patients with less complicated histories did not recall their symptoms. Missing data in the medical files is another limitation of these types of studies. Lack of statistical significance for several variables in the multivariate analysis may not be solely due to the role of confounding variables but partly due to the small sample size, which should be considered in interpreting the results.
5.1. Conclusion
According to the results of our study, decreased level of consciousness at the time of admission can be considered as an independent and chief predictor of mortality. There are several factors in the incidence of death in COVID-19 patients admitted to intensive care units, which due to the complexity of the relationship between each, a definite prediction of patients' prognosis can never be reached without considering the complete picture of clinical symptoms and laboratory findings. Although the results of individual studies like ours help to clarify the issue, they should not be interpreted alone and must be considered alongside the results of previous and future clinical studies.