
1. Background
Sex, height, age, and race are essential for personal identification in forensic medicine studies (1). Sex and stature are the most critical parameters among these criteria (2, 3). Sex estimation is a significant challenge in forensic medicine, especially in body integrity lost such as disasters, traffic accidents, air crashes, wars, and explosions (2).
Sexual dimorphism, the difference in adult males’ and females’ body dimensions, occurs by sex hormones after puberty (4). Skull and pelvis have considerable differences between both sexes; thus, they are used for sex estimation according to metric and morphologic techniques (2, 5). If these bones are not available, long bones are used for sex determination (3). Previous studies have used femur, tibia, foot, arm, and hand dimensions for sex determination (6-8).
Stature is another principal anthropometric criterion affected by different factors, including genetics, nutrition, and environment, in populations (9). Based on the literature, various skeletal remnants such as long bones of limbs, fingers, clavicle, vertebra, sternum, and scapula are used for stature estimation in different populations (9-12). Proper stature estimation was obtained using long bones of the limbs (11, 12). The femur has been proposed as the most relevant long bone for stature estimation. If the femur is not available, the arm bone as the longest bone of the upper limb is the second choice (12, 13). Non-Iranian populations have shown correlations between stature and upper limb surface anthropometric dimensions of arm, forearm, and fingers (11, 14).
There is a difference in the physical characteristics of individuals from various nations and geographical areas (4). Several studies have been performed on some bones for stature and sex estimation in the Iranian population. Poorhassan et al., in a cross-sectional study of Iranian medical students aged 18 - 25 years, reported that forearm length is a moderate predictor of stature (15). In another study of 19-21-year-old Iranian medical students, Navid et al. stated that arm length is reliable for stature prediction (13). In a study of X-ray images of 400 Iranian adults, Habibi Rad et al. showed that the dimensions of the metacarpal bones could be practical in sex estimation (16). In another study of the radius bone of 106 fresh Iranian cadavers, Akhlaghi et al. displayed that the radius is a good predictor of sex and stature in the Iranian population (17). Although scattered studies have been performed on some bones of the upper limbs and radiological X-ray images to determine stature and sex estimation, so far, no comprehensive study has been accomplished on percutaneous upper limb dimensions of the Iranian population for height and sex estimation.
2. Objectives
Iran is one of the largest countries in the Middle East, with different natural disasters and diverse population subgroups. Regarding the urgent need to create a fast and affordable personal identification formula, the present study was designed to find a sex difference based on the measurements of four upper limbs’ anthropometric indices and prepare a population-based reliable formula for estimating sex and stature among Iranian adults.
3. Methods
The Research Ethics Committee of Jiroft University of Medical Sciences approved the ethical protocol (code: IR.JMU.REC.1397.39). Participation in the present study was free. We obtained written informed consent from participants after explaining the study.
3.1. Participants
The present cross-sectional study was conducted on 280 (140 males and 140 females) Iranian volunteer students aged 20 - 24 years at Jiroft University of Medical Sciences. Due to the ethnic diversity in the vast country of Iran, from every five geographical areas (north, south, east, west, and center), 20 - 30 students of each sex were selected from Jiroft University of Medical Sciences. Students with a positive history of trauma, physical deformity, musculoskeletal disorders, and professional athletes were excluded from the study. All measurements were done on the left upper limb of right-handed Iranian-born individuals.
An expert examiner measured the arm length, forearm length, hand length, and hand width in the standard anatomical position for each sex based on inclusion and exclusion criteria. We could not use the same data collector for moral limitations in the country. Thus, we used an expert examiner for each sex. For minimizing the measurement error, we taught the method of measuring upper limb dimensions on the cadaver with a meter and caliper to both experts.
The measurements were taken three times on the left side, and then their mean was recorded. The stature measured with bare feet from the vertex (the highest point of scalp) to the floor. The arm length was determined from the lower border of the acromion process to the superior border of the radius head. The forearm length was measured from the radial head to the distal of the radial styloid process. The hand length was measured from the mid-point of the distal wrist crease to the tip of the middle finger and the hand's width from the radial side of the second metacarpal head to the ulnar side of the fifth metacarpal head (14). Arm and forearm lengths were measured with a metal meter, but hand length and width with a digital caliper (IRAN, Insize model 1106501) with 0.01 cm accuracy. The reliability of the research tools was checked before measurements.
3.2. Statistical Analysis
The data were analyzed by SPSS version 26 and R programing language, version i386 3.3.2, software. Stature and upper limb dimensions were compared between males and females. An independent sample t test was used to determine sexual dimorphism. The sample size in this study was calculated based on a pilot study on 20 women and 20 men by the following formula:
Where type I and type II errors were α = 0.05 and β = 0.10, respectively, the allowable error was d = 2.6, and variances were s12 = 33.64 and s22 = 30.58.
For sex estimation, the collected data were randomly divided into two groups: Study group (120 males and 120 females) and test group (20 males and 20 females). The study group was used to prepare the sex prediction formula; then, its validity was checked by the test group. The data were analyzed using a cutoff value for sex estimation ‘demarking point’, which was calculated by taking the average of the male and female means for each dimension. The dimensions above and below the demarking point were considered males and females, respectively.
Wilk's lambda was calculated to evaluate a statistically significant discriminant equation between the two groups. The percentage of posterior probability intervals of correct classification was measured to assess discriminant function efficiency.
Stature estimation analyses were done by simple linear regression. The default regression model was checked through the Kolmogorov–Smirnov nonparametric test, which raveled normal data distribution. The regression models' suitability and accuracy were quantified using determination coefficients and standard error estimation, respectively. Regression analysis was conducted to estimate stature from anthropometric upper limb measurements. The good regression equations for stature estimation were deduced based on the determination coefficient and standard error of estimated values. Multiple regression analysis was performed to evaluate prediction accuracy improvement from the simple linear formulae.
4. Results
Table 1 demonstrates descriptive statistics for upper limb measurements in both sexes. Comparison of male and female mean values with independent sample t test showed significantly higher values in males (P-value < 0.05). According to our results, forearm length (t-value = 22.15) was the most sexually dimorphic value while hand length (t-value = 11.18), hand width (t-value = 9.72), and arm length (t-value = 9.31) showed less dimorphism.
Table 1.
Descriptive Statistics for Stature and Upper Limb Measurements (in cm) for Both Sexes
| Parameters | Male (n = 140) | Female (n = 140) | Independent t test | |||||
|---|---|---|---|---|---|---|---|---|
| Mean ± SD | Min | Max | Mean ± SD | Min | Max | t-value | P-Value | |
| S | 176.09 ± 5.80 | 160.00 | 186.00 | 161.43 ± 5.53 | 144.00 | 180.00 | 20.05 | < 0.001 |
| AL | 32.06 ± 2.12 | 27.54 | 36.02 | 29.65 ± 1.88 | 24.72 | 33.17 | 9.31 | < 0.001 |
| FL | 29.50 ± 1.63 | 26.54 | 36.02 | 24.93 ± 1.57 | 21.54 | 28.46 | 22.15 | < 0.001 |
| HW | 8.56 ± 0.83 | 7.51 | 11.49 | 7.84 ± 0.38 | 7.13 | 8.74 | 9.72 | < 0.001 |
| HL | 18.82 ± 0.86 | 17.14 | 20.69 | 17.49 ± 0.98 | 15.53 | 19.56 | 11.18 | < 0.001 |
Abbreviations: SD, standard deviation; S, stature; AL, arm length; FL, forearm length; HW, hand width; HL, hand length.
The sexual dimorphic index was calculated by dividing the male mean by the female mean for the same value multiplied by 100. The values were 109.94, 118.33, 107.60, and 110.33 for arm length, forearm length, hand length, and hand width, respectively. The most sexual dimorphism index was related to the forearm length.
A direct univariate discriminant function analysis and demarking points of each value were calculated (Table 2). Wilk’s Lambda indicated relative discriminant scores variance that could not be explained by group differences. Forearm length had the minimum Wilk’s Lambda (0.34), while arm length exhibited the maximum Wilk’s Lambda (0.73). Discriminant function analyses of upper limb anthropometric measurements were calculated and presented in Table 3. The value of Wilk’s Lambda for all upper limb measurements was 0.288.
Table 2.
Univariate Discriminant Function Equations of of Upper Limb Measurements and Demarking Points (in cm) for Sex Determination
| Variables | Standardized Coefficient | Constant | Wilk’s Lambda | Group Centroids | Demarking Points | P-Value | |
|---|---|---|---|---|---|---|---|
| F | M | ||||||
| AL | 0.49 | -15.39 | 0.73 | -0.60 | 0.60 | 30.86 | < 0.001 |
| FL | 0.62 | -16.99 | 0.34 | -1.43 | 1.43 | 27.22 | < 0.001 |
| HW | 1.08 | -19.68 | 0.65 | -0.72 | 0.72 | 8.25 | < 0.001 |
| HL | 1.55 | -12.81 | 0.71 | -0.63 | 0.63 | 18.16 | < 0.001 |
Abbreviations: AL, arm length; FL, forearm length; HW, hand width; HL, hand length; F, females; M, males.
Table 3.
Discriminant Function Analyses of Anthropometric Upper Limb Measurements
| Variable | Unstandardized Coefficient | Standardized Coefficient | Group Centroids | Wilk’s Lambda | P-Value |
|---|---|---|---|---|---|
| AL | 0.006 | 0.011 | F = -1.57; M = 1.57 | 0.288 | < 0.001 |
| FL | 0.526 | 0.843 | |||
| HW | 0.561 | 0.361 | |||
| HL | 0.212 | 0.196 | |||
| Constant | -22.631 |
Abbreviations: AL, arm length; FL, forearm length; HW, hand width; HL, hand length; F, females; M, males.
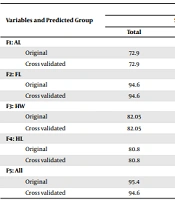
The classification accuracy was 72.9 - 95.4% and 80 - 100% for the study and test groups, respectively (Table 4). Forearm length indicated the highest accuracy for sex estimation (94.6% in the study group and 97.5% in the test group). The lowest accuracy for sex estimation in the upper limb measurements was observed for arm length (72.9% in the study group and 80% in the test group).
Table 4.
Demarking Points (in cm) for Sex Estimation and Classification Accuracy Expressed as Percentages
| Variables and Predicted Group | Expected Accuracy | |||||
|---|---|---|---|---|---|---|
| Study Group | Test Group | |||||
| Total | Males | Females | Total | Males | Females | |
| F1: AL | ||||||
| Original | 72.9 | 78.3 | 67.5 | 80 | 85 | 75 |
| Cross validated | 72.9 | 78.3 | 67.5 | 80 | 85 | 75 |
| F2: FL | ||||||
| Original | 94.6 | 94.2 | 95 | 97.5 | 95 | 100 |
| Cross validated | 94.6 | 94.2 | 95 | 97.5 | 95 | 100 |
| F3: HW | ||||||
| Original | 82.05 | 78.3 | 85.8 | 90 | 85 | 95 |
| Cross validated | 82.05 | 78.3 | 85.8 | 90 | 85 | 95 |
| F4: HL | ||||||
| Original | 80.8 | 75.8 | 85.8 | 87.5 | 85 | 90 |
| Cross validated | 80.8 | 75.8 | 85.8 | 87.5 | 85 | 90 |
| F5: All | ||||||
| Original | 95.4 | 95 | 95.8 | 100 | 100 | 100 |
| Cross validated | 94.6 | 94.2 | 95 | 100 | 100 | 100 |
Abbreviations: AL, arm length; FL, forearm length; HW, hand width; HL, hand length.
The percentages of posterior probability intervals for correct sex classification in the upper limb measurements are exhibited in Table 5. The lowest posterior probability scores were 40%, and most participants in both sexes were classified 60% correctly. Forearm length had the highest posterior probability values in function 2. Besides, 77.9 - 78.9% of males and females were classified above 80% certainty for these functions. However, the lowest posterior probability values were evident in function 1 for arm length. Also, 49.5 - 46.9% of male and female individuals were classified above 80% for these functions.
Table 5.
Percentages of Posterior Probability Intervals of the Correct Classification of Sex for Upper Limb Measurements a
| Posterior Probability Intervals | Male (N = 120) | Female (N = 120) |
|---|---|---|
| Function 1: AL | ||
| 0.00 - 0.19 | - | - |
| 0.20 - 0.39 | - | - |
| 0.40 - 0.59 | 15 (14.3) | 11 (13.6) |
| 0.60 - 0.79 | 38 (36.2) | 32 (39.5) |
| 0.80 - 1.00 | 52 (49.5) | 38 (46.9) |
| Function 2: FL | ||
| 0.00 - 0.19 | - | - |
| 0.20 - 0.39 | - | - |
| 0.40 - 0.59 | 8 (7.1) | 6 (5.3) |
| 0.60 - 0.79 | 17 (15.0) | 18 (15.8) |
| 0.80 - 1.00 | 88 (77.9) | 90 (78.9) |
| Function 3: HW | ||
| 0.00 - 0.19 | - | - |
| 0.20 - 0.39 | - | - |
| 0.40 - 0.59 | 10 (9.5) | 9 (8.7) |
| 0.60 - 0.79 | 23 (21.9) | 20 (19.5) |
| 0.80 - 1.00 | 72 (68.6) | 74 (71.8) |
| Function 4: HL | ||
| 0.00 - 0.19 | - | - |
| 0.20 - 0.39 | - | - |
| 0.40 - 0.59 | 16 (17.6) | 11 (10.7) |
| 0.60 - 0.79 | 31 (34.1) | 29 (28.2) |
| 0.80 - 1.00 | 44 (48.3) | 63 (61.1) |
| Function 5: All | ||
| 0.00 - 0.19 | - | - |
| 0.20 - 0.39 | - | - |
| 0.40 - 0.59 | 6 (5.3) | 6 (5.2) |
| 0.60 - 0.79 | 22 (19.3) | 20 (17.4) |
| 0.80 - 1.00 | 86 (75.4) | 89 (77.4) |
Abbreviations: AL, arm length; FL, forearm length; HW, hand width; HL, hand length.
a Values are expressed as No. (%).
Regression analysis of the relationship between stature and arm length, forearm length, hand length, and hand width is reported in Table 6. Arm length showed the highest correlation with stature (22.2% for males and 18.41% for females), whereas hand width displayed the most negligible correlation with stature (6.8% for males and 4.2% for females) in both sexes.
Table 6.
Simple Linear Regression Models for Stature Estimation in Males and Females
| Regression Equation | F | R2% | SEE |
|---|---|---|---|
| Male | |||
| S = 134.72 + 1.29 (AL) | 33.63 | 22.2 | 5.13 |
| S = 143.76 + 1.09 (FL) | 12.44 | 11.5 | 5.54 |
| S = 118.66 + 3.05 (HL) | 30.74 | 21.1 | 5.18 |
| S = 162.82 + 1.54 (HW) | 5.92 | 6.8 | 5.69 |
| Female | |||
| S = 129.46 + 1.08 (AL) | 18.41 | 14.5 | 5.16 |
| S = 129.28 + 1.29 (FL) | 11.97 | 11.1 | 5.28 |
| S = 131.40 + 1.72 (HL) | 18.39 | 14.3 | 5.16 |
| S = 160.88 + 0.07 (HW) | 4.02 | 4.2 | 5.55 |
Abbreviations: S, stature; AL, arm length; FL, forearm length; HW, hand width; HL, hand length; R2, coefficient of determination; SEE: standard error of estimate.
Multiple regression analysis results of upper limb surface anthropometric measurements for stature estimation are summarized in Table 7. Coefficients of determination of equations for males and females with anthropometric upper limb parameters were 40.1 and 22.2%, respectively. Multiple regression equations revealed the SEE values in males and females (M = ± 4.87, F = ± 5.11). According to our calculated results, a combination of arm length, forearm length, hand length, and hand width could provide the highest prediction accuracy with the minimum standard error for males compared to females.
Table 7.
Multiple Linear Regression Equations for for Stature Estimation from Upper Limb Measurements
| Gender | Multiple Regression Equation | R2% | SEE | F | P-Value |
|---|---|---|---|---|---|
| Male | S = 68.37 + 0.101 (FL) + 0.284 (HL) + 0.245 (HW) | 40.1 | 4.87 | 19.23 | < 0.001 |
| Female | S = 121.85 + 0.014 (AL) + 0.091 (FL) + 0.134 (HL) + 0.125 (HW) | 22.2 | 5.11 | 8.20 | < 0.001 |
| Unknown | S = 87.748 + 0.022 (AL) + 0.152 (FL) + 0.225 (HL) + 0.099 (HW) | 68.2 | 4.42 | 125.85 | < 0.001 |
Abbreviations: S, stature; AL, arm length; FL, forearm length; HW, hand width; HL, hand length; R2%, coefficient of determination; SEE, standard error of estimate.
5. Discussion
Our results demonstrated that forearm length based on surface anatomical landmarks is the best predictor of gender among the four main upper limb measurements of Iranian adults. Other surface anthropometric dimensions, including hand length, hand width, and arm length, showed lower sexual dimorphism, in sequence. In addition, arm length was more relevant to stature, while hand width displayed the most negligible correlation with stature in both sexes.
Forearm length with 94.2 - 95% accuracy displayed the most sexually dimorphic value in our survey. Its reliability was evaluated in the test group with 95 - 100% accuracy. Based on the literature, forearm length is a reliable measure for sex determination in other populations based on surface anthropometric and osteological landmarks (8, 18). According to Ahmed on Sudanese adults, forearm length with surface anthropometric landmarks was the most reliable parameter for sex determination with 78.5 and 89.5% accuracy among the four main upper limb dimensions, similar to our study (14). On the other hand, Barrier and L’Abbe reported the correlation between forearm bones length and sex in a modern South African osteological evaluation. They concluded a significant relationship between forearm bone length and sex with an accuracy of 76 to 86% (19). In addition, Celbis and Agritmis in a Turkish corpse sample showed that forearm bones length provides a sex estimation accuracy of 96% by discriminant function analysis (20).
In our study, hand width had the second and hand length had the third sexually dimorphic value with an accuracy of 78.3 - 85.8% and 75.8 - 85.8%, respectively. These results agreed with Karadayi et al. that evaluated the relationship between surface hand dimensions and sex in the Turkish population using discriminant function analysis that reported an accuracy of 83.4% with hand width and 79.3% with hand length (21). Also, Dey and Kapoor revealed that in hand surface dimensions, hand width (accuracy 80 - 83%) was a better sex predictor than hand length (accuracy 77 - 80%) (22). Moreover, based on Krishan et al., in the north Indian population, the hand width surface dimension was more correlated with sex than hand length (23). Nevertheless, Jayanth et al., in the South Indian population, reported contrary results showing that hand length is more valuable than hand width for sex determination (24). Indeed, various body parts show various sexual dimorphic values between populations and even within populations; hence, surface landmarks, tools, and methods of evaluation must be regarded as potential causes (25).
The present study showed the lowest sexual dimorphism with an accuracy of 67.5 - 78.3% for arm length, in agreement with the findings of Ahmed in a Sudanese population with an accuracy of 77.5 - 78.5% (14). However, according to Dalia and Abd Elbaky, arm length shows an acceptable accuracy (93.3%) for sex estimation in dissected Egyptian cadavers (26). Differences in cadaver and live persons’ surface anthropometric dimensions are usual, especially across nations.
The mean statures were significantly higher for males than for females in the present study. The shorter length in females is created due to high estrogen levels during puberty, which leads to earlier stopping of bone growth (18). Unlike females, because of high testosterone levels, males have more bone growth opportunities that eventually lead to longer bones (18). According to the present study, arm length had the highest correlation with stature (R2 = 22.2%, SEE = ± 4.87 for males and R2 = 18.41%, SEE = ± 5.11 for females). Similar results were reported by Navid et al. in Iranian medical students (R2 = 39%, SEE = 4.52 for males and R2 = 35%, SEE = 4.32 for females). They concluded that arm length was reliable in stature estimation (13). Also, in the study of a southern Nigerian population, arm length indicated a higher regression coefficient than ulnar length (27).
According to our results, forearm length (R2 = 11.5%, SEE = 5.54 for males and R2 = 11.1%, SEE = 5.28 for females) had lower predictable value than arm length for stature estimation. Our values were similar to dimensions obtained in the Turkish population (R2 = 38%, SEE = 5.25 for males, R2 = 25%, and SEE = 5.56 for females) by Ozaslan et al. (28). However, Howley et al. achieved different values (R2 = 56%, SEE = 3.88 for males, R2 = 60%, and SEE = 3.97 for females) in the Australian population (8). In our study, the determination coefficient (R2) was higher for stature and hand length than for hand width in both sexes, as confirmed by several studies in various populations (29, 30).
This study was accomplished on Iranian adults, so our results may not be appropriate for the older age group, considering that stature decreases with age (31). In addition, as surface landmarks were measured in living people while body parts in natural disasters show destructive environmental changes, these dimensions should be used conservatively.
5.1. Conclusion
There are inadequate data on surface anthropometric body dimensions of Iranians and limited information on some limb dimensions. Also, previous studies focused dominantly on radiological and osteological aspects of body segments or specific limb dimensions, focusing on stature estimation. The present study measured four main upper limb surface anthropometric dimensions to detect sexual dimorphic value and population-based specific stature-sex predicting formula through the discriminant equation and linear regression analysis. Our results proved that forearm length had the highest accuracy for sex estimation, and arm length was the best predictor of stature.