
1. Background
Staphylococcus aureus exists in the posterior part of the nose and skin of 20 - 45% of adults. This organism is considered a part of the normal flora of humans but can still cause a variety of infections, such as folliculitis, boils, carbuncles, abscesses, toxic shock syndrome (TSS), scalded skin syndrome (SSS), food poisoning, bacteremia, endocarditis, osteomyelitis, polyarthritis, and urinary tract infections (1). Hemodialysis patients are in the end-stage of renal diseases and are prone to these infections. Repetitive injections increase the possibility of these bacteria entering the bloodstream of these patients. It has been reported that 3 - 4% of hemodialysis patients are at risk of invasive infections such as S. aureus every year. Nosocomial infections have always been among the major healthcare problems since the development of hospitals. By increasing the duration of hospitalization, these infections cause more death and, consequently, increase hospital costs. Approximately 70% of nosocomial infections are caused by seven pathogens, and among the gram-positive organisms, S. aureus is one of the most common nosocomial pathogens (2). The carriers of such microorganisms are considered the most important sources of infection. Carriers are highly susceptible to Staphylococcus infection, and carrier status is established immediately after birth, so 6 - 24% of newborns carry this bacterium after three to four days in the hospital. Being a carrier depends on specific epidemiological factors. Some healthcare staff is carriers of this bacteria, which is more than other people (3, 4).
The prevalence of drug-resistant S. aureus strains has increased in recent years. At first, in the 1980s, the resistance to antibiotics such as methicillin was reported, and it increased rapidly that in the same year, methicillin-resistant Staphylococcus aureus (MRSA) became one of the crucial clinical and epidemiological problems in hospitals (5-7). With the emergence of multi-drug-resistant strains, infection management has become a significant public health issue. Extensively drug-resistant (XDR) S. aureus was defined as non-susceptibility to at least one agent in all but two or fewer antimicrobial categories (i.e., bacterial isolates remain susceptible to only one or two categories) (8, 9). Linezolid and tedizolid are oxazolidinones that inhibit protein synthesis by binding to the 50s ribosomal subunit. Linezolid has activity against enterococcal infections, nosocomial pneumonia caused by S. aureus or Streptococcus pneumoniae, osteomyelitis, and skin and soft tissue infections (10, 11). Tedizolid has more advantages than linezolid, including high activity against gram-positive bacteria, treatment with a single dose, and the possibility of fewer adverse drug reactions (12, 13). Studies have indicated that S. aureus is transmitted from patients to healthcare workers and that this transmission cycle becomes crucial when the patient’s hospitalization length increases (14).
2. Objectives
The present research emphasized the frequency of drug-resistant S. aureus strains among patients with staphylococcal infections and the bactericidal potential of tedizolid, linezolid, and vancomycin on XDR S. aureus isolates.
3. Methods
3.1. Patients and Bacteria Isolation
In this descriptive-analytical study, 328 samples were from two groups: patients (n = 164) and healthy individuals (n = 164) from four hospitals in Golestan province, north of Iran, from Sep. 2019 to Dec. 2020. The control group consisted of healthy individuals (nasal area and skin). The study procedures were performed according to medical ethics standards. The infectious disease specialist collected samples from patients’ aspirates, blood, exudate, sputum, tissues, trachea, urine, and wound. For sampling, a cotton swab dipped into sterile physiological serum was inserted into the posterior section of the nose of the staff of the various wards of the hospital and rotated five times. The swabs were incubated on a mannitol salt agar (Merck, Germany) at 35°C. After 48 hours, the S. aureus strains were identified by detecting mannitol-positive colonies, morphology examination, gram staining, hemolysis, coagulase (clumping) and DNase tests, and finally, genotype analysis. For the PCR analysis, specific primers for S. aureus genomic DNA (forward: 5’-AAAAACACTTGTCGATATGG-3’; reverse: 5’-GTTTCAATACATCAACTGC-3’) were designed using the Oligo5 software. Staphylococcus aureus isolates were confirmed by detecting a 950 bp band in the 1.5% agarose gel electrophoresis.
3.2. Antibiotic Susceptibility
Antibiotic susceptibility of S. aureus isolates was determined by the disk diffusion (Kirby-Bauer) test using the following antibiotic disks (Padtan Teb Co., Iran): Amikacin (30 μg), cefazolin (30 μg), clindamycin (2 μg), azithromycin (15 μg), daptomycin (2 μg), tigecycline (15 μg), fosfomycin (200 μg), oxacillin (5 μg), ciprofloxacin (5 μg), chloramphenicol (30 μg), rifampicin (30 μg). The results were interpreted according to the CLSI (M100-S25) in 2015 (15).
3.3. Determination of Minimum Inhibitory Concentration by the Broth Microdilution Method
Based on the protocol of the Clinical and Laboratory Standards Institute (15), to prepare the suspension of oxazolidinones, an efficient amount of linezolid and tedizolid powders (Merck, Germany) was added to the solution of water and dimethyl sulfoxide (DMSO), and for providing the suspension of glycopeptide antibiotic, the vancomycin powder (Sigma-Aldrich, USA) was added to the water solution. The initial concentration of each antibiotic was inoculated to 96-well microplates, including Mueller Hinton broth with 2% salt (Merck, Germany). Minimum inhibitory concentration (MIC) of antibiotics in a range of 0.25 - 256 μg/mL was determined. Then, XDR S. aureus suspension (with a turbidity of 0.5 McFarland) was separately inoculated into each well. After overnight incubation at 37°C, the growth rate was measured and compared with that of the positive control (without the antibiotic) and the negative control (without bacterial suspension). The inhibitory effect was assessed by reading absorbance at 630 nm using a plate reader (BioTec, Germany). The minimum concentration inhibiting bacterial growth by 90% compared with a positive control is known as MIC90. Staphylococcus aureus ATCC 25923 was used as a control strain.
3.4. Statistical Analysis
All data were analyzed in SPSS (version 23.0) using the chi-square test, pairwise comparison, and Kruskal-Wallis nonparametric test. A P value of less than 0.05 was considered statistically significant.
4. Results
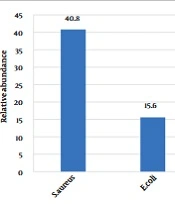
The frequency of S. aureus in the patient group was reported to be 58 cases (35.4%) and 31 cases (18.9%) in the control group. In Figure 1, the highest frequency of S. aureus isolates in both patient and control groups based on the sampling ward was in the internal ward of the hospital (P = 0.067). Thus, the difference is not significant.
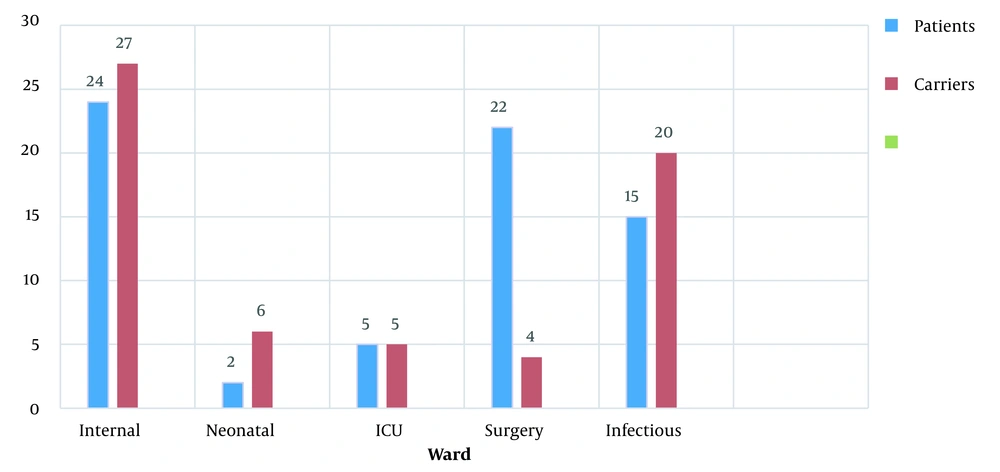
Figure 1.
The relative abundance (percentage) of the Staphylococcus aureus isolates in the patients and carriers groups in different wards of the hospital
4.1. Susceptibility to Antibiotics
In the antimicrobial susceptibility test, 28 samples (48.3%) in the patient group and 13 samples (41.9%) in the control group were identified as XDR (Table 1). Following the independent test, it was found that there is a relationship between the two criteria of classification of antibiotics and severity of effect (P = 0.031).
Table 1.
Antibiotic Resistance Pattern in Staphylococcus aureus Strains Isolated from Patients and Control Individuals a
| Drug Class | Antibiotics | Patients (n = 58) | Carriers (n = 31) | P-Value | ||||
|---|---|---|---|---|---|---|---|---|
| R | I | S | R | I | S | |||
| Lipopeptides | Daptomycin | 8 (13.8) | 27 (46.6) | 23 (39.7) | 1 (3.2) | 14 (45.2) | 16 (51.6) | 0.076 |
| Cephems | Cefazolin | 12 (20.7) | 33 (56.9) | 13 (22.4) | 2 (6.5) | 8 (25.8) | 21 (67.7) | 0.037 b |
| Glycylcyclines | Tigecycline | 8 (13.8) | 22 (37.9) | 28 (48.3) | 6 (19.4) | 4 (12.9) | 21 (67.7) | 0.02 b |
| Phosphonic acids | Fosfomycin | 11 (19) | 28 (48.3) | 19 (32.7) | 8 (25.8) | 9 (29) | 14 (45.2) | 0.035 b |
| Phenicols | Chloramphenicol | 16 (27.6) | 25 (43.1) | 17 (29.3) | 11 (35.5) | 9 (29) | 11 (35.5) | 0.068 |
| Ansamycins | Rifampin | 20 (34.5) | 17 (29.3) | 21 (36.2) | 4 (12.9) | 17 (54.8) | 10 (32.3) | 0.05 |
| Macrolides | Azithromycin | 12 (20.7) | 21 (36.2) | 25 (43.1) | 3 (9.7) | 5 (16.1) | 23 (74.2) | 0.03 b |
| Lincosamides | Clindamycin | 18 (31) | 21 (36.2) | 19 (32.8) | 2 (6.5) | 5 (16.1) | 24 (77.4) | 0.036 b |
| Cephamycines | Oxacillin | 27 (46.6) | 5 (8.6) | 26 (44.8) | 11 (35.5) | 7 (22.6) | 13 (41.9) | 0.068 |
| Aminoglycosides | Amikacin | 16 (27.6) | 29 (50) | 13 (22.4) | 9 (29) | 11 (35.5) | 11 (35.5) | 0.05 |
| Quinolone | Ciprofloxacin | 12 (20.7) | 20 (34.5) | 26 (44.8) | 5 (16.1) | 12 (38.7) | 14 (45.2) | 0.053 |
Abbreviations: R, resistant; I, intermediate; S, susceptible.
a Values are expressed as No. (%).
b P < 0.05 significant
4.2. Results of Broth Microdilution Test
Minimum inhibitory concentration determining of tedizolid showed that all XDR isolates of S. aureus tested were susceptible to tedizolid (MIC, ≤ 2 μg/mL), while 92/8% (MIC, ≤ 4 μg/mL) and 60.7% (MIC, ≤ 2 μg/mL) of isolates were categorized as susceptible to linezolid and vancomycin, respectively. The concentration of tedizolid that inhibited 90% of isolates (MIC90) was 2 μg/mL, 2-fold lower than linezolid (MIC90 = 4 μg/mL) and 64-fold lower than vancomycin (MIC90 = 128/mL). There is a significant difference between the minimum concentration of drug that inhibits 50% of the growth of bacteria and the minimum concentration of antibiotic that inhibits 90% of the growth of bacteria (with a standard deviation and mean of 0.40 ± 52.00) (P = 0.02). All XDR strains of S. aureus were susceptible to tedizolid (Table 2).
Table 2.
Summary of the Activity of Different Antibiotics in Extensively Drug-Resistant Staphylococcus aureus Isolates
| Percentage of Resistance | Minimum Inhibitory Concentration (μg/mL) | Antibiotics Extensively Drug-Resistant (28) | ||
|---|---|---|---|---|
| 90% | 50% | Range | ||
| 0 | 2 | 1 | 0.5 - 2 | Tedizolid |
| 7.2 | 4 | 32 | 1 - 8 | Linezolid |
| 28.6 | > 128 | 32 | 8 to > 128 | Vancomycin |
Most of the vancomycin-resistant S. aureus isolates were from the wound (3 out of 8) specimen. There was a significant difference between the frequency of XDR strains isolated from the aspirate, trachea, and wound infections, so 22% of vancomycin-resistant isolates and all strains resistant to linezolid were isolated from hospitalized patients in the infectious ward (P = 0.04, Table 3).
Table 3.
Comparing the Antibiotic Resistance Pattern of Oxazolidinones and Glycopeptide in Extensively Drug-Resistant Staphylococcus aureus Isolates Based on the Patient Samples a
| Antibiotics and Sample | Aspirate (n = 2) | Urine (n = 2) | Blood (n = 5) | Sputum (n = 2) | Wound (n = 8) | Exudate (n = 3) | Trachea (n = 3) | Tissue (n = 3) | P-Value |
|---|---|---|---|---|---|---|---|---|---|
| Tedizolid | 0.01 b | ||||||||
| Resistant | - | - | - | - | - | - | - | - | |
| Intermediate | - | - | - | - | - | - | - | - | |
| Susceptible | 2 (7.1) | 2 (7.1) | 5 (17.9) | 2 (7.1) | 8 (28.6) | 3 (10.7) | 3 (10.7) | 3 (10.7) | |
| Linezolid | 0.026 b | ||||||||
| Resistant | 1 (3.6) | - | - | - | - | - | 1 (3.6) | - | |
| Intermediate | - | - | - | - | - | - | - | - | |
| Susceptible | 1 (3.6) | 2 (7.1) | 5 (17.9) | 2 (7.1) | 8 (28.6) | 3 (10.7) | 2 (7.1) | 3 (10.7) | |
| Vancomycin | 0.036 b | ||||||||
| Resistant | 1 (3.6) | - | 1 (3.6) | 1 (3.6) | 2 (7.1) | 1 (3.6) | 1 (3.6) | 1 (3.6) | |
| Intermediate | 1 (3.6) | - | - | 1 (3.6) | 1 (3.6) | - | - | - | |
| Susceptible | - | 2 (7.1) | 4 (14.3) | - | 5 (17.8) | 2 (7.1) | 2 (7.1) | 2 (7.1) |
a Values are expressed as No. (%).
b P < 0.05 significant
5. Discussion
Staphylococcus aureus is one of the major factors causing hospital-acquired infections (HAI). This bacterium creates a broad spectrum of nosocomial infections and is among the most common causes of death in patients. In comparison with previous years, the number of nosocomial infections caused by this bacterium increased substantially. About 25 - 30% of healthy people carry this bacteria in their posterior nasal cavities, so they are able to spread it to others, especially hospitalized patients (16, 17).
In the present study, 31 (18.9%) of the hospital staff were nasal carriers of S. aureus. As reported by researchers in Iran in 2010 (18) and 2018 (19), 32% and 26.8% of the hospital staff were carriers of S. aureus. It was higher than the amount found in the present study. The present study revealed that the highest and lowest frequency of S. aureus isolates was in the patient and control groups of the internal and neonatal wards, respectively. In the previous study in Iran, the highest frequency of S. aureus was reported in the radiology and laboratory wards, and the lowest was in the neonatal and pediatric care wards (20). In view of no strength of neonates and infants’ immature immune systems, the lower infection rate seems optimistic since antibiotics, including lipopeptides and glycopeptides, are not recommended for infants. Daptomycin is an antibiotic with a lipopeptide structure. The daptomycin’s antimicrobial rate differs from country to country and in different years. The studies indicated that resistance to daptomycin requires a mutation in the enzymes responsible for the synthesis of the cytoplasmic membrane, including glycerol phosphoryl diester, phosphodiester, and cardiolipin synthetase that results in a change in the phospholipid cell membrane of the bacterium (21-23). In the present research, patients (13.8%) and control (3.2%) individuals were shown resistance to daptomycin.
Vancomycin is the glycopeptide greatly used to treat S. aureus resistant to methicillin. The problem of MRSA treatment is raised by reporting and spreading VRSA cases. Various studies have demonstrated the prevalence of S. aureus resistance to vancomycin worldwide (24, 25).
The frequency of resistance to vancomycin (28.6%) in the present study should be considered alarming for controlling nosocomial infectious diseases. Taking into account the rapid development of drug resistance among microorganisms, using XDR definition throughout the world has provided the opportunity to compare the data and better understand the bacteria resistant to antibiotics. It also provides a chance to increase the number of clinical antimicrobial laboratories that conduct experiments against microorganisms. Oxazolidinones are among the new antibiotics used in controlling bacterial infections, especially caused by gram-positive bacteria.
The researchers discovered an 85% clinical survival rate in patients taking linezolid, compared to 69% for those taking vancomycin (26). In a nosocomial pneumonia assessment, Jiang et al. reported that linezolid is more effective in microbiological eradication than glycopeptide (27). Balli et al. conducted systematic research and indicated that treatment with linezolid resulted in a lower fatality rate than treatment with daptomycin regarding infections resistant to vancomycin (28). The role of tedizolid as a novel oxazolidinone was considerable in controlling drug-resistant infectious diseases. Tedizolid phosphate, a prodrug of tedizolid, is a novel oxazolidinone approved for treating drug-resistant S. aureus (29, 30). Tedizolid has shown high activity against gram-positive bacteria with low sensitivity to commonly used antibiotics in infections. In a study, tedizolid was shown 4-fold more potent than linezolid against linezolid-resistance gram-positive bacterial isolates (31, 32). Tedizolid activity was 4 - 8 fold higher than linezolid in another study on MRSA strains and vancomycin-resistant Enterococcal strains (33, 34). Tedizolid’s antibacterial potential was 2-fold better than linezolid and 64-fold better than vancomycin against S. aureus resistant to 11 drug classes, indicating that tedizolid can cover the drug-resistance S. aureus strains.
5.1. Conclusions
The results indicated that the frequency of nasal carriers of S. aureus is quite high. Consequently, there is the possibility of transmitting these diseases to other people, especially hospitalized patients, which can be the other way around. As oxazolidinones, especially tedizolid, have a high antibacterial effect, they can be an excellent option in treating infectious diseases caused by gram-positive pathogens. There are factors affecting the prevalence of Staphylococci resistant to selected antibiotics in various countries, including Iran. The factors include different policies on enforcement of infection-control plans, the doses of antibiotic prescription, the population, and the methodology of laboratories in diagnosing drug-resistant Staphylococci.