
1. Background
Chronic obstructive pulmonary disease (COPD) is characterized by irreversible airflow limitation and is the third leading cause of death globally. This condition not only imposes a significant economic and social burden worldwide but also places a substantial caregiving burden on the patient's caregivers (1, 2). The COPD is a multidimensional disease requiring patients to adapt to various situations and interactions. It involves airway obstruction, leading to reduced life expectancy and disability. Clinical symptoms of COPD include dyspnea, cough, increased sputum production, and fatigue (3-5).
Dyspnea in COPD patients interacts with physical, psychological, social, and environmental factors, often described in relation to activities likely to cause shortness of breath (6). As COPD progresses, exertional dyspnea increases, leading to shortness of breath and an inability to perform daily activities, causing fatigue even with simple tasks (7, 8). Due to airway obstruction, COPD patients often develop ineffective breathing habits, which can be mitigated through pulmonary rehabilitation (9).
Beyond the gradual decline in lung function, COPD affects other systems, including the nervous system, potentially causing cognitive disorders. Many COPD patients experience memory impairment, prolonged reaction times, lack of attention, and reduced information processing speed (2, 10). Respiratory failure is a common reason for intensive care unit (ICU) admission, and patients undergoing mechanical ventilation may develop delirium due to psychological reactions (11, 12). Delirium is an abnormal mental state associated with disturbances in sleep cycles, orientation, and perception (13, 14). Factors influencing delirium development include metabolic disorders, psychiatric history, blood transfusion, renal failure, and age (15, 16). Delirium is linked to prolonged hospitalization, increased mortality, physiological disorders, and higher medical costs (17-19).
2. Objectives
The aim of this study was to determine the incidence and risk factors of delirium in COPD patients in the ICU.
3. Methods
This study is part of the Iran ICU Registry (IICUR), a Persian ICU-based registry launched in 2018 in collaboration with the Australian and New Zealand Intensive Care Society (ANZICS). The IICUR was approved with ethics number IR.SUMS.REC.1397.559 and is recognized by the Iran Ministry of Health as the first and only registry of adult ICUs in Iran. In this study, registry data from 74 COPD patients aged over 18 years, with no history of surgery within the last 3 months and without dementia, who were hospitalized in the internal ICU for more than 2 days, were analyzed.
The registry checklist included information on gender, infection, fever, serum creatinine ≥ 1.2 mg/dL, hypertension, diabetes mellitus, smoking, chronic renal failure, discharge destination, age, number of days in the hospital, Glasgow Coma Scale (GCS) score, and partial pressure of oxygen (PaO2). The diagnosis of delirium was based on clinical examination and the opinion of a specialist physician, with the completion of the instruments performed by one of the researchers. All patient information was kept completely confidential. Data analysis was conducted using SPSS version 18 software.
4. Results
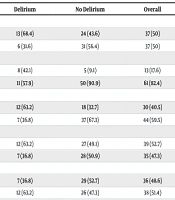
According to the findings, of the 74 patients examined in this study, 19 (25.7%) experienced delirium, while 55 (74.3%) showed no symptoms of delirium. Among the patients, 50% were male, 82.4% had no infection, and 48.6% had hypertension (Table 1). The incidence of delirium was higher in patients with a history of infection and fever compared to other patients. Additionally, delirium was significantly associated with older age, lower GCS scores, and lower PaO2 levels (P < 0.05) (Table 2).
Table 1.
Comparing the Relationship Between Delirium and Qualitative Variables in Patients with Chronic Obstructive Pulmonary Disease a
| Variables | Delirium | No Delirium | Overall | P-Value | F |
|---|---|---|---|---|---|
| Gender | 0.064 | 4.67 | |||
| Male | 13 (68.4) | 24 (43.6) | 37 (50) | ||
| Female | 6 (31.6) | 31 (56.4) | 37 (50) | ||
| Infection | 0.001 | 33.43 | |||
| Yes | 8 (42.1) | 5 (9.1) | 13 (17.6) | ||
| No | 11 (57.9) | 50 (90.9) | 61 (82.4) | ||
| Fever | 0.02 | 0.36 | |||
| Yes | 12 (63.2) | 18 (32.7) | 30 (40.5) | ||
| No | 7 (36.8) | 37 (67.3) | 44 (59.5) | ||
| Serum creatinine ≥ 1.2 | 0.29 | 3.88 | |||
| Yes | 12 (63.2) | 27 (49.1) | 39 (52.7) | ||
| No | 7 (36.8) | 28 (50.9) | 35 (47.3) | ||
| Hypertension | 0.23 | 3.21 | |||
| Yes | 7 (36.8) | 29 (52.7) | 36 (48.6) | ||
| No | 12 (63.2) | 26 (47.3) | 38 (51.4) | ||
| Diabetes mellitus | 0.52 | 2.14 | |||
| Yes | 13 (68.4) | 33 (60) | 46 (62.2) | ||
| No | 6 (31.6) | 22 (40) | 28 (37.8) | ||
| Smoking | 0.35 | 4.65 | |||
| Yes | 5 (26.3) | 21 (38.2) | 26 (35.1) | ||
| No | 14 (73.7) | 34 (61.8) | 48 (64.9) | ||
| Chronic renal failure | 0.17 | 6.92 | |||
| Yes | 4 (21.2) | 5 (9.1) | 9 (12.2) | ||
| No | 15 (78.9) | 50 (90.9) | 65 (87.8) | ||
| Discharge destination | 0.073 | 0.72 | |||
| Died | 6 (31.6) | 10 (18.2) | 16 (21.6) | ||
| Ward | 13 (68.3) | 38 (69.1) | 51 (68.9) | ||
| Other | 0 (0) | 7 (12.7) | 7 (9.5) |
a Values are expressed as No. (%).
Table 2.
Comparing the Relationship Between Delirium and Quantitative Variables in Patients with Chronic Obstructive Pulmonary Disease a
| Variables | Delirium | No Delirium | F | t | Significant (2-Tailed) | 95% CI of the Difference | |
|---|---|---|---|---|---|---|---|
| Lower | Upper | ||||||
| Age | 73.21 ± 7.64 | 66.25 ± 11.12 | 6.468 | 2.523 | 0.014 | 1.45887 | 12.45309 |
| Hospital days | 27.42 ± 11.57 | 23.87 ± 8.16 | 8.307 | 1.459 | 0.149 | -1.30018 | 8.39683 |
| GCS Score | 6.10 ± 0.87 | 10.65 ± 2.61 | 26.749 | -7.400 | 0.000 | -5.77473 | -3.32384 |
| PaO2 | 75.26 ± 3.42 | 82.12 ± 4.93 | 0.547 | -5.603 | 0.000 | -9.30613 | -4.42210 |
Abbreviations: GCS, Glasgow Coma Scale; PaO2, partial pressure of oxygen.
a Values are expressed as mean ± SD.
According to the findings, of the 74 patients examined in this study, 19 (25.7%) experienced delirium, while 55 (74.3%) showed no symptoms of delirium. Among the patients, 50% were male, 82.4% had no infection, and 48.6% had hypertension (Table 1). The incidence of delirium was higher in patients with a history of infection and fever compared to other patients. Additionally, delirium was significantly associated with older age, lower GCS scores, and lower PaO2 levels (P < 0.05) (Table 2).
5. Discussion
The results showed that delirium was significantly higher in patients with older age, lower GCS scores, and lower PaO2. In a study by Robinson et al. involving surgical patients, a relationship was found between older age, hypoalbuminemia, pre-existing comorbidities, and delirium status (20). Pendlebury et al. reported that the risk of delirium increased with age, prior dementia, severe illness, infection, and dehydration (21). Pham et al. found a relationship between delirium and the number of sedative, haloperidol, and opioid days in patients with respiratory failure, but no association with gender, ethnicity, BMI, or creatinine levels (22). Generally, the rate of delirium was higher in mechanically ventilated patients and was directly related to ICU hospitalization indicators (23).
In this study, of the 74 patients examined, 19 (25.7%) had delirium, while 55 (74.3%) did not. Fu et al. found that in 237 COPD patients admitted to the ICU, the incidence of delirium was 21.94%. Factors such as age over 75 years, BMI ≤ 19 kg/m2, CPOT ≥ 5, APACHE II score ≥ 15, hypertension, PaO2 ≤ 75 mmHg, and sedation were associated with delirium. In the delirium group, the mean age was 78.11 years, 31 were male, the BMI was 18.12 ± 4.67 kg/m2, 76.92% had hypertension, 48.08% had diabetes mellitus, and 38.46% had hyperlipidemia (24). Szylinska et al. reported that in 283 postoperative COPD patients, 65 (22.97%) experienced delirium, with correlations found between delirium, intubation time, CRP levels, pneumonia, and lower survival rates (16).
Delirium is a common disorder in COPD patients, particularly in the ICU, where its rate is high. Xia et al. found a delirium incidence of 16% in patients receiving statins, compared to 19.1% in the non-statins group and 13.4% in the statins group (P < 0.001) (19). Xu et al. reported a 37.46% incidence of delirium in 2621 COPD patients, with a relationship between delirium, hospitalization, and the need for post-discharge care (25). Zhang et al. found that among 1083 intubated patients, 18.1% had delirium, with associations between delirium, hospital mortality, ICU stay, older age, ICU mortality, APACHE II score, lower GCS, and lower pH, but no association with PaCO2, gender, heart rate, underlying disease, or PaO2/FiO2 (26). Erfani et al. (2025) reported a delirium rate of 22% (CI: 16.8 - 28.3%) (27).
5.1. Conclusions
The rate of delirium in COPD patients in the ICU was high. Identifying effective and aggravating factors is crucial, and necessary measures should be implemented to reduce the occurrence of delirium.