


1. Background
Measles is still a highly infectious disease in children leading to morbidity and mortality worldwide regardless of the availability of a relatively inexpensive, efficient, safe vaccine (1, 2). The incidence differs along the years from 10% to 15%, with a noticeable increase to more than 50% during outbreaks (3, 4). The factors predisposing people to the disease may include poverty, overcrowdedness, malnutrition, vitamin A deficiency, poor hygiene, improper immunization, and decreased immunity (5). The poor immunization coverage rate is reported by studies conducted in different community settings leaving some at-risk children to start outbreaks (6, 7). Moreover, inadequate surveillance and low response capacity in any country can endanger its population (8).
In Egypt, in 1977, measles compulsory vaccination started with a coverage rate ranging from 50% to 90%. However, outbreaks of measles continued to happen during the years 1980 - 1999 at two to four-year intervals. In 1999, the implementation of the compulsory, routine second dose of the measles-mumps-rubella (MMR) vaccine initiated. Along with the start of the immunization campaign from 2000 to 2003 directed to children within the age range of 6 to 16 years, the reported measles cases dramatically decreased (9).
Egypt in 2002 declared the establishment of goals for the elimination of measles by the year 2010 using the UNICEF/WHO strategy for sustainable reduction of measles mortality (10). In 2005 - 2007, large-scale rubella and measles outbreaks occurred that directed the Egyptian health authorities to change the action plan goals of 2010. During 2008 - 2009, a national measles-rubella immunization campaign was implemented at two phases targeting children and adolescents aged 2 to 20 years. This campaign recorded a coverage rate of more than 95% (9).
To achieve the 2010 goals, another national vaccination campaign for measles and rubella was conducted in the period from October to November 2015 by the Ministry of Health and Population (MOHP) in collaboration with WHO and UNICEF. The campaign focused on the vaccination of 24 million children between the age of 9 months and 10 years. It was implemented all over Egyptian governorates in schools, nurseries, and health care facilities (11). Despite this success, there were an estimated 222 measles cases in Egypt in 2016 (12).
Measles elimination requires not only a high coverage (> 95%) with an effective vaccine, but also a strong competent health system capable of reaching every child in the community settings (13). Moreover, accurate and complete data on vaccination coverage rates should be available to assess and monitor the performance of vaccination services at different community levels to support public health planning, allocate resources, measure the impact of interventions, and raise attention to the areas of program weaknesses.
2. Objectives
Based on the previously mentioned facts, the aim of the present study was to evaluate measles vaccine effectiveness as one of the fundamental actions to eliminate measles virus infection. The specific objectives were to estimate measles vaccine effectiveness at the level of under 12-year-old children population using the Egyptian surveillance data for cases seeking medical care at Embaba Fever Hospital between March 2017 and February 2018 and to determine the trend of measles virus infection for the given children population during the same study period.
3. Methods
3.1. Study Design, Period, and Setting
This was a hospital-based cross-sectional analytical study conducted at Embaba Fever Hospital at Giza Governorate for the evaluation of measles vaccine effectiveness. The hospital admits about 14000 patients annually. The study was done over a period of one year starting from March 2017.
3.2. Working Definitions
The World Health Organization (WHO) case definition of measles was used for clinical diagnosis of measles’ cases including, “An acute illness characterized by Generalized, maculopapular rash lasting ≥ 3 days, temperature ≥101ºF or 38.3ºC, and cough, coryza, or conjunctivitis” (14). Moreover, according to the WHO, a “probable case” of measles is defined as an illness that, “In the absence of a more likely diagnosis, meets the clinical description with no epidemiologic linkage to a laboratory-confirmed measles case; and noncontributory or no measles laboratory testing”. A “confirmed case” of measles is recognized as, “An acute febrile rash illness with isolation of the measles virus from a clinical specimen; or detection of measles-virus specific nucleic acid from a clinical specimen using polymerase chain reaction; or IgG seroconversion or a significant rise in measles immunoglobulin G antibody using any evaluated and validated method; or a positive serologic test for measles immunoglobulin M antibody; or a direct epidemiologic linkage to a case confirmed by one of the above-mentioned methods. Temperature does not need to reach ≥ 101ºF/38.3ºC and rash does not need to last ≥ 3 days.” (14).
Vaccination status was interpreted according to the number of vaccine doses received, as receiving one dose, two or more doses, or not receiving a dose at all. Any doses recorded within two weeks before the disease onset were excluded from the analysis.
3.3. Study Sample
A purposive sampling technique was used where all children admitted to Embaba Fever Hospital with symptoms suggestive of measles or measles like-illness during the study period were included, making 466 patients in total. They were investigated clinically and laboratory to confirm the diagnosis of measles at the outpatient clinic of Embaba Fever Hospital.
3.4. Study Tools and Data Collection
The study was conducted among children aged less than 12 years. Data were obtained using a questionnaire during structured interviews held by a pediatrician and an epidemiologist. Demographic data, immunization status, and the onset date of symptoms and signs (especially the rash) were obtained for the whole sample.
3.5. Laboratory Workup
To serologically confirm the cases, blood samples were collected and evaluated by a clinical pathology physician. The detection of anti-measles specific IgM antibodies was used for laboratory confirmation. Sterile labeled dry bottles containing anticoagulants were used for specimens’ collection (about 2 mL of blood from each child). In the laboratory, the serum was separated from the blood by centrifugation and stored in sterile Eppendorf tubes until processing. Measles IgM enzyme-linked immunosorbent assay (ELISA) test kits were used for testing the sera for measles-specific immunoglobulin M (IgM) antibodies.
3.6. Statistical Analysis
The measles vaccine effectiveness was calculated according to the following equation:
Vaccine effectiveness = number of IgM-VE children / Total number of children
The proportion of IgM-VE children within each category (sex, age, and vaccination status groups) with its 95% confidence interval was calculated.
The collected data were analyzed using the Statistical Package for Social Sciences (SPSS) Software (IBM SPSS Statistics for Windows, Version 25.0. Armonk, NY: IBM Corp.). Data were summarized using mean and standard deviation statistics for quantitative variables and frequency and percentage for qualitative variables. Tests of normality of data (e.g., Kolmogorov-Smirnov test) showed that the data were not normally distributed. Therefore, non-parametric tests such as the Mann-Whitney test were used in univariable comparisons to quantify the associations between continuous variables while the chi-square test was used for qualitative variables. P values of less than 0.05 were considered statistically significant. Multivariate analysis using binary logistic regression model was done to explore the predictive ability of a set of categorical variables (sex, age, and vaccination status) for measles infection; the model determined the factors that predicted the likelihood of children involved with measles and the factor that best predicted the outcome when it had been controlled for the effects of other variables.
3.7. Ethical Considerations
The study protocol was approved by the Research Ethics Committee of the Faculty of Medicine, Cairo University, and by the responsible managers of the Fever Hospital. Informed consent was attained directly from the legal guardian of each child prior to data and sample collection following the explanation of the study objectives and methods. All procedures for data collection were treated with confidentiality according to the Helsinki declaration of biomedical ethics (15).
4. Results
In total, 466 children (including 54.5% males and 45.5% females) took part in this study. The mean age of the children was 4.2 ± 2.8 years ranging from 3 months to 12 years.
There were 69 (14.8%) children with positive results for measles IgM antibodies, with the highest percentage being in the 1 - 4 year age group (43.5%) (Table 1). Regarding the vaccination status, 60.3% of the children had evidence of vaccination with two or more doses while 33% of the children had not been vaccinated (Table 2). In the male group, the frequency of unvaccinated, positive-IgM children (23.1%) was significantly higher than the frequency of those who received ≥ 2 doses and tested positive (10.1%) (P value < 0.05), demonstrating the vaccine effectiveness of 89.9%. In the female group, this was quite the same (30.2% IgM positivity in unvaccinated children versus 6.1% in children receiving ≥ 2 doses) but with higher vaccine effectiveness (93.9%). In the age group of 1 - 4 years, the fully vaccinated (i.e., vaccination with ≥ 2 doses) positive-IgM children (8.8%) were significantly lower in frequency than unvaccinated children or those who received one dose, giving the vaccine effectiveness of 91.2%. This was nearly the same in the age group for ≥ 5 years (7.4%) (Table 3).
Table 1.Demographic Characteristics of the Tested Positive and Negative Measles IgM Children
| Demographic Characteristics | Measles IgM | Total (N = 466) | P Value | |
|---|---|---|---|---|
| +VE (N = 69) | -VE (N = 397) | |||
| Sex | 0.919 | |||
| Male | 38 (15) | 216 (85) | 254 (100) | |
| Female | 31 (14.6) | 181 (85.4) | 212 (100) | |
| Age, ya | 0.008b | |||
| Range | 0.5 - 10.7 | 0.2 - 12 | 0.2 - 12 | |
| Mean ± SD | 3.4 ± 2.6 | 4.4 ± 2.8 | 4.2 ± 2.8 | |
| Median | 3 | 4.2 | 4 | |
| Age groups, y | ||||
| < 1 | 19 (26.8) | 52 (73.2) | 71 (100) | 0.002b |
| 1 - 4 | 30 (13.4) | 194 (86.6) | 224 (100) | 0.409 |
| ≥ 5 | 20 (11.7) | 151 (88.3) | 171 (100) | 0.150 |
aMann-Whitney test
bP value is statistically significant at the level of < 0.05.
Table 2.Vaccination Status of the Tested Positive and Negative Measles IgM Children
| Vaccination Status | Measles IgM | Total (N = 466) | P Value | Vaccine Effectiveness | OR (95% CI) | |
|---|---|---|---|---|---|---|
| +VE (N = 69) | -VE (N = 397) | |||||
| Unvaccinated | 40 (26) | 114 (74) | 154 (100) | < 0.001 | Ref. | Ref. |
| One dose | 6 (19.4) | 25 (80.6) | 31 (100) | 0.461 | 80.6 (64.4 - 91.5) | 0.684 (0.262 - 1.788) |
| Two doses or more | 23 (8.2) | 258 (91.8) | 281 (100) | < 0.001 | 91.8 (88.2 - 94.6) | 0.254 (0.145 - 0.444) |
Abbreviations: CI, confidence interval; OR, odds ratio; Ref., reference category.
Table 3.Comparison Between Tested Positive and Tested Negative Measles IgM Children Regarding Vaccination Status Based on Sex and Age Groupsa
| Vaccination Status | Measles IgM | P Value | Vaccine Effectiveness | OR (95% CI) | ||
|---|---|---|---|---|---|---|
| +VE (N = 69) | -VE (N = 397) | |||||
| Sex | ||||||
| Male | ||||||
| Unvaccinated | 21 (23.1) | 70 (76.9) | 0.007 | Ref. | Ref. | |
| One dose | 2 (14.3) | 12 (85.7) | 0.942 | 85.7 (61.5 - 96.9) | 0.556 (0.115 - 2.682) | |
| Two doses or more | 15 (10.1) | 134 (89.9) | 0.009 | 89.9 (84.3 - 94) | 0.373 (0.181 - 0.769) | |
| Female | ||||||
| Unvaccinated | 19 (30.2) | 44 (69.8) | < 0.001 | Ref. | Ref. | |
| One dose | 4 (23.5) | 13 (76.5) | 0.280 | 76.5 (53.3 - 91.5) | 0.713 (0.206 - 2.470) | |
| Two doses or more | 8 (6.1) | 124 (93.9) | < 0.001 | 93.9 (88.9 - 97.1) | 0.149 (0.061 - 0.366) | |
| Age groups, y | ||||||
| 1 - 4 | ||||||
| Unvaccinated | 10 (28.6) | 25 (71.4) | 0.004 | Ref. | Ref. | |
| One dose | 6 (20) | 24 (80) | 0.255 | 80 (63.3 - 91.2) | 0.625 (0.197 - 1.987) | |
| Two doses or more | 14 (8.8) | 145 (91.2) | 0.002 | 91.2 (86 - 94.9) | 0.241 (0.097 - 0.603) | |
| ≥ 5 | ||||||
| Unvaccinated | 11 (22.9) | 37 (77.1) | 0.005 | Ref. | Ref. | |
| One dose | 0 (0) | 1 (100) | 0.716 | 100 (NA) | NA | |
| Two doses or more | 9 (7.4) | 113 (92.6) | 0.006 | 92.6 (87 - 96.3) | 0.268 (0.103 - 0.697) | |
Abbreviations: CI, confidence interval; NA, not applicable; OR, odds ratio; Ref., reference category.
aNB: Patients aged less than one year were excluded, as none of them was vaccinated.
Table 4 shows that only vaccination with two doses or more made a unique statistically significant contribution to the direct logistic regression model. The odds of being IgM positive was lower in children who were vaccinated with two or more doses than in children who were not vaccinated when adjusted for all other factors. Figure 1 shows the trend of measles cases along the study period where there was a peak of increase in cases from April to June 2017 and again from December 2017 to February 2018.
Table 4.Multivariate Logistic Regression Model Demonstrating Factors Affecting Tested Positive and Tested Negative Measles IgM
| Variables | P Value | OR | 95% CI |
|---|---|---|---|
| Sex | |||
| Male | 0.871 | 0.957 | 0.563 - 1.628 |
| Female | Ref. | Ref. | Ref. |
| Age groups, y | |||
| < 1 | Ref. | Ref. | Ref. |
| 1 - 4 | 0.868 | 1.071 | 0.478 - 2.398 |
| ≥ 5 | 0.637 | 0.829 | 0.380 - 1.809 |
| Vaccination status | |||
| Unvaccinated | Ref. | Ref. | Ref. |
| One dose | 0.375 | 0.614 | 0.209 - 1.805 |
| Two doses or more | < 0.001 | 0.252 | 0.130 - 0.490 |
Abbreviations: CI, confidence interval; OR, odds ratio; Ref., reference category.
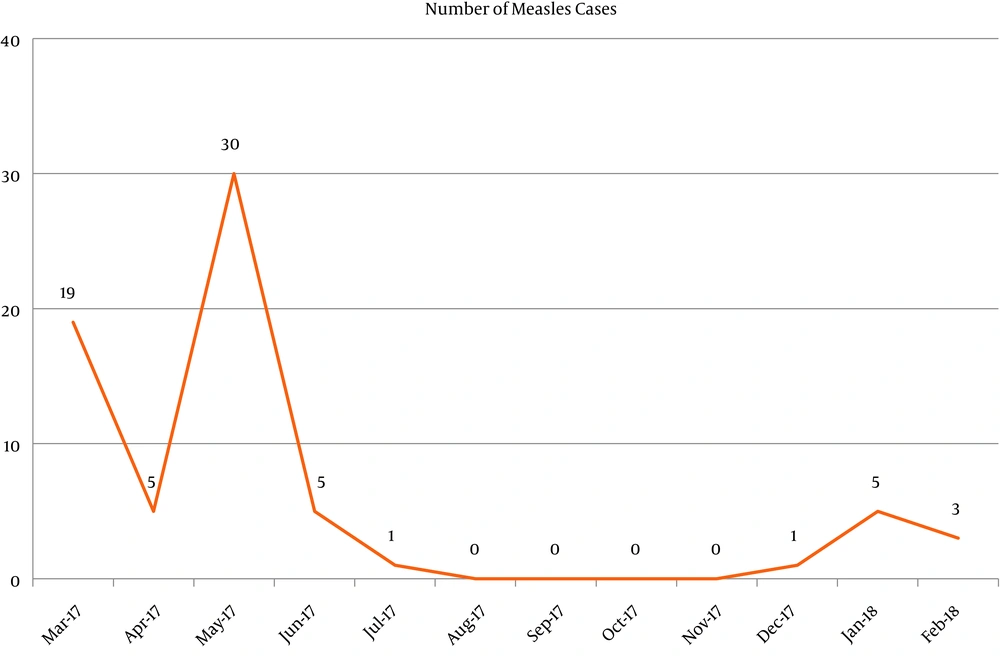
Figure 1.
The trend of measles cases from March 2017 to February 2018
5. Discussion
By the use of a measles-specific IgM detection ELISA kit, the study was planned to test measles infection among vaccinated and unvaccinated children presenting fever and maculopapular rash at a Tertiary Fever Hospital in Egypt. As recommended by the WHO, the detection of measles IgM remains the best technique for measles diagnosis (16). We must bear in mind that the cases gathered during the study period may have not presented the true clinical situation of maculopapular rash infections happening due to the underreporting of several rash infections in different sectors of the country and only those who came to the Fever Hospital were enrolled in the current study. The prevalence of recent measles infection (14.8%) established in this study emphasizes that the burden of infection in Egypt is yet high despite the integration of measles vaccination as part of the Expanded Program of Immunization (EPI) and implementing the vaccine in routine campaigns for vaccination of one-year-old children.
About one-third of the children who gave positive measles-specific IgM had received two or more doses of measles vaccine (vaccine effectiveness of 91.8%). This goes in accordance with many recent similar studies that displayed high measles vaccine effectiveness (17, 18). Measles infection among formerly vaccinated children could be due to vaccine failure, either primary or secondary. The improper vaccine dosage, inadequate cold-chain system, and host-specific factors such as the persistence of maternally acquired immunity are among the primary causes of vaccine failure (19, 20). The secondary vaccine failure could be attributed to the nutritional status of children or the presence of underlying diseases. The estimation of vaccine effectiveness is an important factor in evaluating an immunization schedule and its changes. It adjudges whether the measles vaccine is protective at the population level or not. In agreement with the findings from other studies, vaccination coverage gaps may partake to measles outbreaks and constitute a serious hindrance for measles elimination (18).
The sex distribution was not significant although a noticeably high percentage of male children (55.1%) were infected in comparison with females (44.9%). This differs from former studies that reported a statistical association among female children with elevated infection rates compared to their male counterparts (21, 22). Concerning age, infection rates showed higher values up to the age of five years. This finding is in concordance with other study findings in Africa where measles infection mainly influenced children under the age of five (19, 21-25). Children have a higher possibility of being infected due to the endemicity of the virus in Africa. In addition, lifelong immunity is usually acquired in children aged more than five years while the exposed children younger than five years represent the at-risk group for measles infection (26). Our findings agree with other studies that proved vaccinated children (with at least one dose of measles vaccine) had significantly lower odds of contracting measles than those who were not vaccinated (27, 28). Recent studies suggest that unvaccination is the most probable cause of the accumulation of measles-susceptible under-five children and the occurrence of outbreaks (29, 30). Although measles can occur among all age groups, the study displayed that the 1 - 4 year age group had the highest rate of positive infections (43.5%). This could be correlated with the start of attending daycare at this age, with a consequent increase in intermixing with other children, making them more susceptible to infection.
The study showed a relatively high percentage of infected children younger than one year. This may be due to the fading of maternal antibodies acquired earlier. The decline in antibodies could be attributed to the immunity status of nursing mothers acquired by the vaccine taken rather than natural infection, as the vaccine is not recorded to give solid, lifelong immunity. Therefore, it is possible that acquired maternal antibodies would fade quicker relative to those gained by natural infection (31). In many low- and middle-income countries, such as Egypt, a second-dose opportunity to children of different ages through measles complementary immunization campaigns (regardless of the previous history of vaccination) is mandatory to achieve a wide vaccination coverage and get to the children who miss their routine measles vaccine dose (32).
5.1. Conclusions
The study results showed that measles infection is still high in Egypt regardless of the vaccination status of children. Therefore, it is suggested that a national plan be developed to achieve higher vaccination coverage among under-five children. Target groups at risk during outbreaks are in need of a supplemental dose of immunization. Finally, it is important to perform regular vaccine effectiveness analyses to exclude possible vaccine failure as a contributing factor.




