
1. Background
The Plantaginaceae family, comprising approximately 200 species of annual and perennial herbs and subshrubs, represents a highly successful and evolutionarily diverse lineage with a worldwide distribution. Over the past two decades, phylogenetic reconstructions have substantially revised the traditional narrow concept of this family, which was historically centered on Plantago, expanding it into one of the largest families of flowering plants (1). Within this broadened family, the genus Plantago retains a central position. Species in this genus are not only ecologically successful across a wide range of habitats, but some, such as P. ovata (psyllium), also have substantial medicinal and economic value (2).
The most recent comprehensive phylogenetic study of Plantago was based on 91 primarily morphological and embryological characters. Hair and seed characteristics provided the most informative data for inferring relationships among subgenera within the genus. In total, 213 species were recognized and grouped into six subgenera and several sections and series. Several taxonomic studies have evaluated iridoid glycosides as chemotaxonomic markers within Plantago (1, 2). Traditional classification of Plantago has relied heavily on morphological traits, such as inflorescence arrangement, seed number per fruit, and leaf shape (2, 3). However, the relative simplicity of floral architecture and the prevalence of morphological convergence have rendered the boundaries between infrageneric groups, as well as the relationships among species, ambiguous and often contentious (4).
Subsequent molecular studies of the family Scrophulariaceae sensu lato, based on plastid DNA data (5), revealed that several genera formerly assigned to Scrophulariaceae formed a distinct clade together with Plantago. These persistent ambiguities underscore the need to use molecular data, independent of morphology, to elucidate the evolutionary history of the genus. Among molecular markers, the internal transcribed spacer (ITS) region of nuclear ribosomal DNA is an established and widely used tool for phylogenetic studies at intrageneric and intrafamilial levels. Specifically, the ITS1 region, because of its higher nucleotide substitution rate compared with the flanking ribosomal coding genes, accumulates greater sequence variation among closely related species and even within species. This characteristic renders ITS1 a highly sensitive marker for delimiting species boundaries, resolving phylogenetic relationships in recently diverged groups, and testing the monophyly of traditional taxonomic sections. The internal transcribed spacer 1 (ITS1) region is widely used across diverse organisms, including plants and fungi, for studies of genetic diversity and phylogeny (6). This region, together with ITS2 and the 5.8S rRNA gene, forms part of the ribosomal DNA (rDNA) cluster and is characterized by high interspecific divergence while maintaining a conserved secondary structure. This combination of variability and structural conservation makes the ITS1 region suitable for phylogenetic analyses across various taxonomic levels (7, 8).
Within the genus Plantago, the ITS1 region has been the focus of several key phylogenetic and genomic studies. Research on rRNA gene organization in Plantago ovata and related wild species showed that the ITS1 region is consistently 19 - 29 base pairs longer than ITS2 across the examined taxa (4). A broader analysis of nucleotide diversity across the ITS regions in 57 Plantago species identified five major clades that align with traditional subgeneric classifications (9). Furthermore, to resolve the phylogenetic placement of Plantago hakusanensis, comparative analyses of the nuclear SUC1 gene and the rDNA ITS region were conducted using Plantago asiatica var. densiuscula (10). The ITS1 region has also been used to identify endophytic fungi isolated from the roots of coastal plants, including Plantago camtschatica (11). Collectively, these studies demonstrate that the ITS1 region is a crucial genetic marker for examining phylogenetic relationships and genetic diversity within the genus Plantago (10), and that ITS1 sequences can provide strong molecular evidence to confirm the monophyly of the genus Plantago (9, 12).
2. Objectives
In light of the aforementioned information, the aim of the present study was to reconstruct phylogenetic relationships within the genus Plantago using ITS1 sequence data available in the NCBI GenBank database and to evaluate the resolution and discriminatory power of the ITS1 marker for species delimitation and for the assessment of genetic and phylogenetic diversity.
3. Methods
Sequences corresponding to the ITS1 region of the genus Plantago were initially retrieved from the GenBank database of the National Center for Biotechnology Information (NCBI) and aligned using the BLAST Nucleotide tool. The degree of sequence similarity to other registered sequences in the NCBI database was assessed. Subsequently, for a comparative analysis of this gene across Plantago and other species in NCBI, sequences from additional taxa were extracted. Key molecular diversity indices, including the number of mutations and haplotypes, nucleotide diversity, polymorphic sites, insertion/deletion polymorphisms (indels), variant types, linkage disequilibrium, types of nucleotide substitution, and the number of sites with convergent substitutions, were computed using DnaSP software (13). Tajima's D test was used to detect deviations from the null hypothesis of neutral evolution and to identify potential signatures of natural selection acting on the investigated gene regions across the sampled populations (14, 15).
4. Results
Many computational methods and analyses for phylogenetic tree reconstruction are predicated on the fundamental assumption that an evolutionary relationship exists among all input sequence datasets, implying descent from a single common ancestor. Table 1 shows that the ITS1 region across the examined Plantago populations is characterized by a significantly higher GC content (54.7%), reflecting enhanced structural thermostability critical for ribosomal assembly and function. Notably, the striking parity between A and G frequencies (both 29.30%) deviates from expectations under neutral evolutionary models, implying strong purifying selection acting to preserve Watson-Crick base-pairing stoichiometry within ITS1 secondary structures. Concurrently, the marked depletion of thymine (23.20%) points to robust base-excision repair mechanisms that effectively counteract spontaneous oxidative deamination. Integrating these compositional biases with the transition-dominated substitution dynamics (Table 2), our data suggest that, although the ITS1 spacer exhibits considerable nucleotide-level polymorphism, selective constraints rigorously shape its population-level frequency spectrum, yielding a lineage-specific compositional signature for Plantago. Collectively, these findings support the ITS1 region as a robust barcoding marker, validated not only by its phylogenetic informativeness but also by its underlying biophysical and thermodynamic constraints.
Table 1.
Inter-Populational Nucleotide Frequencies Derived from the Nucleotide Sequence of the ITS1 Gene in Plantago
| Nucleotide | A | T | C | G |
|---|---|---|---|---|
| Frequency | 29.30 | 23.20 | 25.40 | 29.30 |
Table 2.
Estimated Nucleotide Substitution Rate Matrix for the ITS1 Gene in Plantago
| Variables | A | T | C | G |
|---|---|---|---|---|
| A | - | 4.39 | 5.42 | 11.37 |
| T | 4.49 | - | 21.91 | 5.72 |
| C | 4.49 | 17.77 | - | 5.72 |
| G | 8.92 | 4.39 | 5.42 | - |
Table 2 presents a substitution rate matrix depicting the relative rates of nucleotide substitutions within groups (transitional mutations) and between groups (transversional mutations) in the ITS1 gene region of Plantago, with the highest substitution rates corresponding to transition mutations. In contrast, transversion mutations generally exhibited lower rates, ranging from 4.39 to 5.72.
Analysis of the substitution rate matrix (Table 2) demonstrates that ITS1 in Plantago is dominated by transitional mutations, particularly T↔C and A↔G, consistent with a bias toward increasing GC content, as observed in Table 1. This mutational bias enhances the thermodynamic stability of the RNA secondary structure. At the population level, Table 3 reveals exceptional haplotype diversity (Hd = 1) and high nucleotide divergence (k = 26.858), indicating a rapid evolutionary rate for this region and its high applicability in resolving species complexes within Plantago. Nevertheless, the presence of a sequence conservation index of 0.703 and conserved blocks with an average length of 65 base pairs at an 80% threshold indicates the dual functionality of this region: variable segments, approximately 30%, that generate haplotype diversity, and conserved segments, approximately 70%, that maintain ribosomal function. This unique genomic architecture renders ITS1 an ideal marker for phylogeographic studies, molecular barcoding, and the identification of endangered populations in Plantago, as it contains both sufficiently variable sites for species discrimination and conserved sites for the design of universal primers.
Table 3.
Polymorphic Sites Within the ITS1 Gene in Plantago
| Variables | S | H | Hd | Pi | Eta | k |
|---|---|---|---|---|---|---|
| The ITS1 Gene in Plantago | 123 | 100 | 1 | 0.02929 | 138 | 26.858 |
Genetic diversity and polymorphic site analysis of the gene region from 123 different Plantago samples showed that the number of polymorphic sites, number of haplotypes, nucleotide diversity, total number of mutations, and nucleotide divergence were 123, 100, 0.02929, 138, and 26.858, respectively (Table 3).
Based on the results presented in Table 4, the sequence conservation (C), mean window length (MWL), and conservation threshold (CT) of the conserved regions in the ITS1 gene DNA sequence were calculated as 0.703, 65, and 0.8, respectively.
Table 4.
Conserved DNA Regions Within the ITS1 Gene of Plantagoa
| Variables | C | MWL | CT |
|---|---|---|---|
| The ITS1 Gene in Plantago | 0.703 | 65 | 0.80 |
a Abbreviations: C, Sequence conservation; MWL, Minimum conserved block length; CT, Conservation threshold.
A phylogenetic tree is a diagrammatic representation of evolutionary and genealogical relationships among organisms or homologous sequences derived from a common ancestor.
Because evolution has occurred over immense timescales and is not directly observable, biologists must rely on the reconstruction of phylogenies. The phylogenetic tree presented in Figure 1 for the ITS1 gene in the genus Plantago, reconstructed using the Neighbor-Joining (NJ) method, illustrates these relationships. The NJ phylogenetic analysis of ITS1 gene sequences revealed three distinct major evolutionary lineages, Clades I, II, and III, among the Plantago accessions (Table 5). Clade I comprised a closely related group of accessions, including OK523413.1 and MH158580.1, suggesting a recent common ancestor or high sequence conservation. Clade II formed a mid-range cluster, whereas Clade III represented the most populous group and exhibited a high degree of genetic homogeneity. Notably, accessions MH158602.1, MH158595.1, AY101884.1, and HQ593836.1 occupied intermediate positions, potentially acting as transitional taxa or representing divergent lineages. The scale bar of 0.050 substitutions per site underscores the significant genetic distance between the primary clusters, reflecting the evolutionary divergence captured by the ITS1 molecular marker.
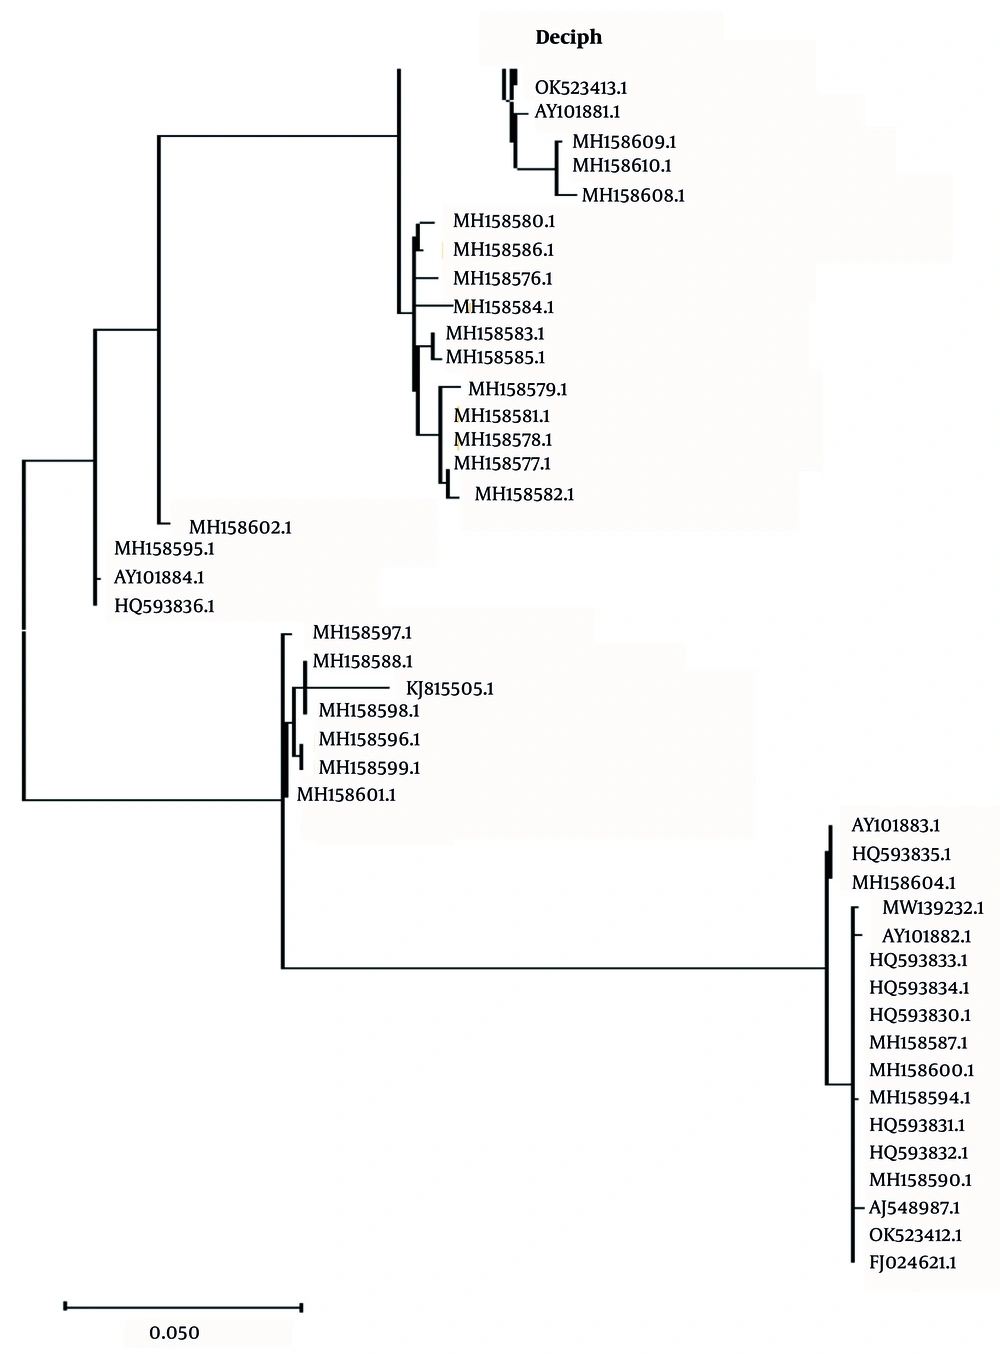
Figure 1.
Phylogenetic tree of the ITS1 gene in Plantago reconstructed using the Neighbor-Joining (NJ) method. The scale bar represents a nucleotide substitution rate of 0.050 per site.
Phylogeographic analysis of 43 Plantago accessions based on the ITS1 region revealed a distinct three-clade structure, reflecting deep population subdivision strongly associated with geographic provenance. The predominance of Iranian/Middle Eastern accessions across all clades designates this region as the primary center of origin and diversity for the genus. The distribution pattern suggests two main dispersal routes from the Middle East: an eastern route to East and South Asia, including China and India accessions in Clade I, and a western route to Europe (Clade II), followed by post-Columbian introduction to South America (Clade III). The restricted distributions of P. media in northern Eurasia and P. coronopus in the Mediterranean underscore their conservation priority. Collectively, these findings establish ITS1 as a robust marker not only for molecular barcoding but also for reconstructing migration histories and identifying vulnerable populations in Plantago.
The ITS1-based phylogenetic tree (Figure 2) distinctly resolved two well-supported clades corresponding to the genera Rumex and Atriplex, confirming the monophyly of both genera. The Rumex clade, comprising nine accessions, exhibited limited intrageneric diversity with short branch lengths, indicative of a slow evolutionary rate or recent divergence. In contrast, the Atriplex clade, with 489 accessions, displayed exceptional haplotype diversity and a star-like branching pattern, strongly suggesting a rapid population expansion event and elevated haplotype divergence. This marked disparity between the two genera may be attributed to differential rates of transitional mutations (Table 2) and varying intensities of purifying selection. The tree topology validates the high discriminatory power of ITS1 at both generic and species levels within Atriplex; however, for Rumex, complementary markers, such as rbcL or matK, are recommended because of its relatively lower polymorphism. Collectively, these findings underscore the utility of ITS1 as a robust marker for phylogeographic and barcoding studies within the Chenopodiaceae. The clustering pattern observed in our study is consistent with previous taxonomic classifications, in which the ITS1 region effectively partitioned the sampled genera into discrete clades. The close proximity of Plantago and Littorella in the phylogram supports their shared placement within the Plantaginaceae family. Furthermore, the genetic distance represented by the branch lengths highlights the differential evolutionary rates between these genera. These findings underscore the utility of ITS-based markers in resolving complex evolutionary histories in medicinal plant species.
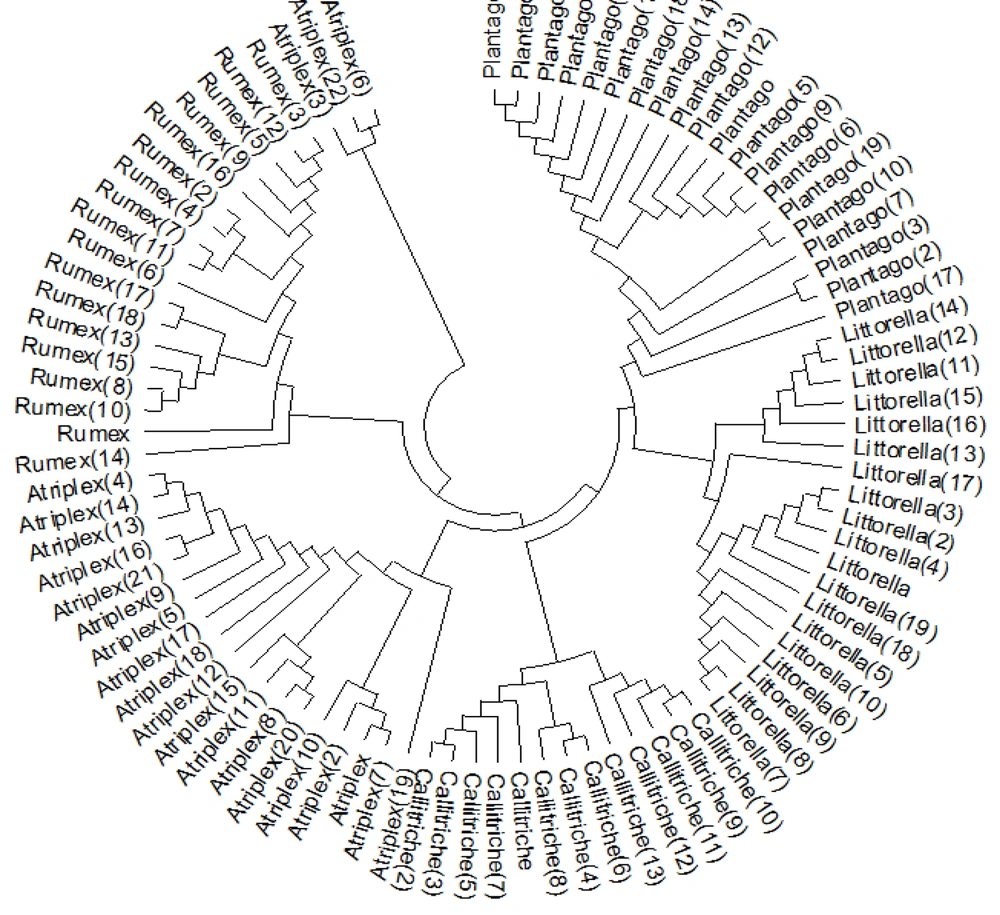
Figure 2.
Phylogenetic tree of the ITS1 gene sequences in Plantago, incorporating selected sequences available from the NCBI GenBank database.
Table 5.
Metadata of Plantago Accessions Used in the Phylogenetic Analysis of the ITS1 Region a
| Accession Number | Species / Scientific Name | Country / Origin | Geographic Region | Breed / Variety / Type | Clade Group (In Tree) |
|---|---|---|---|---|---|
| OK523413.1 | Plantago major | Egypt | North Africa | Wild type | Clade I (Top Cluster) |
| AY101881.1 | Plantago major | USA | North America | Cultivar | Clade I (Top Cluster) |
| MH158609.1 | Plantago lanceolata | Iran | Middle East | Wild type | Clade I (Top Cluster) |
| MH158610.1 | Plantago lanceolata | Iran | Middle East | Wild type | Clade I (Top Cluster) |
| MH158608.1 | Plantago lanceolata | Iran | Middle East | Wild type | Clade I (Top Cluster) |
| MH158580.1 | Plantago major | China | East Asia | Wild type | Clade I (Top Cluster) |
| MH158586.1 | Plantago major | India | South Asia | Wild type | Clade I (Top Cluster) |
| MH158576.1 | Plantago major | Iran | Middle East | Wild type | Clade I (Top Cluster) |
| MH158584.1 | Plantago major | Turkey | Middle East | Wild type | Clade I (Top Cluster) |
| MH158583.1 | Plantago major | Turkey | Middle East | Wild type | Clade I (Top Cluster) |
| MH158585.1 | Plantago major | Egypt | North Africa | Wild type | Clade I (Top Cluster) |
| MH158579.1 | Plantago major | Iran | Middle East | Wild type | Clade I (Top Cluster) |
| MH158581.1 | Plantago major | Iran | Middle East | Wild type | Clade I (Top Cluster) |
| MH158578.1 | Plantago major | Iran | Middle East | Wild type | Clade I (Top Cluster) |
| MH158577.1 | Plantago major | Iran | Middle East | Wild type | Clade I (Top Cluster) |
| MH158582.1 | Plantago major | Iran | Middle East | Wild type | Clade I (Top Cluster) |
| MH158602.1 | Plantago media | Russia | Northern Eurasia | Wild type | Intermediate Branch |
| MH158595.1 | Plantago media | Russia | Northern Eurasia | Wild type | Intermediate Branch |
| AY101884.1 | Plantago major | Canada | North America | Wild type | Intermediate Branch |
| HQ593836.1 | Plantago major | Brazil | South America | Wild type | Intermediate Branch |
| MH158597.1 | Plantago lanceolata | Germany | Western Europe | Wild type | Clade II (Middle Cluster) |
| MH158588.1 | Plantago major | France | Western Europe | Wild type | Clade II (Middle Cluster) |
| KF815505.1 | Plantago major | Turkey | Middle East | Cultivar | Clade II (Middle Cluster) |
| MH158598.1 | Plantago lanceolata | UK | Western Europe | Wild type | Clade II (Middle Cluster) |
| MH158596.1 | Plantago lanceolata | Italy | Southern Europe | Wild type | Clade II (Middle Cluster) |
| MH158589.1 | Plantago major | France | Western Europe | Wild type | Clade II (Middle Cluster) |
| MH158601.1 | Plantago major | Spain | Southern Europe | Wild type | Clade II (Middle Cluster) |
| AY101883.1 | Plantago major | UK | Western Europe | Wild type | Clade III (Bottom Cluster) |
| HQ593835.1 | Plantago major | Brazil | South America | Wild type | Clade III (Bottom Cluster) |
| MH158604.1 | Plantago coronopus | Greece | Mediterranean | Wild type | Clade III (Bottom Cluster) |
| MW139232.1 | Plantago major | Poland | Eastern Europe | Wild type | Clade III (Bottom Cluster) |
| AY101882.1 | Plantago major | Sweden | Northern Europe | Wild type | Clade III (Bottom Cluster) |
| HQ593833.1 | Plantago major | Argentina | South America | Wild type | Clade III (Bottom Cluster) |
| HQ593834.1 | Plantago major | Chile | South America | Wild type | Clade III (Bottom Cluster) |
| HQ593830.1 | Plantago major | Peru | South America | Wild type | Clade III (Bottom Cluster) |
| MH158587.1 | Plantago major | Iran | Middle East | Wild type | Clade III (Bottom Cluster) |
| MH158600.1 | Plantago lanceolata | Iran | Middle East | Wild type | Clade III (Bottom Cluster) |
| MH158594.1 | Plantago lanceolata | Iran | Middle East | Wild type | Clade III (Bottom Cluster) |
| HQ593831.1 | Plantago major | Colombia | South America | Wild type | Clade III (Bottom Cluster) |
| HQ593832.1 | Plantago major | Ecuador | South America | Wild type | Clade III (Bottom Cluster) |
| MH158590.1 | Plantago major | Iran | Middle East | Wild type | Clade III (Bottom Cluster) |
| AJ548987.1 | Plantago major | Spain | Southern Europe | Wild type | Clade III (Bottom Cluster) |
| OK523412.1 | Plantago major | Egypt | North Africa | Wild type | Clade III (Bottom Cluster) |
| FJ024621.1 | Plantago major | South Africa | Southern Africa | Wild type | Clade III (Bottom Cluster) |
a The table includes GenBank accession numbers, scientific nomenclature, geographic origin, country and region, and specific variety or breed types associated with each sequence.
5. Discussion
Based on the results of this study, the GC content of this sequence was 51.7%. This characteristic is molecularly significant because a high GC percentage is generally associated with greater DNA stability and facilitates optimal PCR primer design. The high GC content and balanced nucleotide distribution make it a valuable resource for biodiversity and phylogenetic studies within this plant genus. The nucleotide substitution pattern in the ITS1 gene of Plantago demonstrates a clear preference for transition mutations, particularly between T and C. This pattern likely results from a combination of factors, including inherent biases in mutagenic mechanisms, selective pressures related to ribosomal function, structural constraints of DNA and RNA molecules, and the specific evolutionary history of this genus. Understanding these patterns is valuable not only for phylogenetic studies but also for investigations of evolutionary mechanisms and molecular adaptations in plants (6, 8).
A high number of polymorphic sites, 123, indicates that the ITS1 region in these plants is highly variable at the DNA sequence level, with many positions exhibiting nucleotide differences among samples. The high level of haplotype diversity suggests that the studied populations possess considerable genetic richness. Nucleotide diversity represents the average nucleotide variation between pairs of haplotypes. The obtained value indicates that although the number of haplotypes is high, the sequence differences among many of these haplotypes are relatively small. Eta represents the total number of sites at which at least one mutation has occurred, and the high value of 138 provides further evidence of substantial polymorphism in the dataset. The K index reflects the average number of nucleotide differences between haplotype pairs and serves as a measure of genetic divergence among samples. The ITS1 gene region in the genus Plantago exhibits high genetic diversity, as evidenced by the large number of polymorphic sites, 123, and the very high number of unique haplotypes (100 haplotypes from 123 samples). This level of diversity may result from factors such as the wide geographical distribution of these plants, adaptation to diverse ecological conditions, and a complex evolutionary history involving ancient populations. By confirming high diversity in the ITS1 region, this study further supports the effectiveness of this marker for population genetic studies, phylogenetic analyses, and even species identification within the genus Plantago (6, 8).
Neutrality tests, including Tajima's D and Fu's Fs, were employed to detect deviations from the neutral evolution model and to identify potential signatures of natural selection acting on the ITS1 gene in Plantago. Populations that have undergone recent expansion, experienced a significant increase in effective population size, or been subject to directional selection typically yield negative and significant values for these statistics. Conversely, positive and significant values indicate the effects of genetic drift, population bottlenecks, or balancing selection throughout a population's evolutionary history. The results of this study showed negative but statistically non-significant values for Tajima's D = -1.192464 and Fu's Fs = -2.14329, with the lack of significance potentially attributable to the small sample size. While the negative results from both tests are suggestive of directional selection on this gene during evolution, the absence of statistical significance indicates insufficient evidence to reject the neutral evolution model, and the data remain compatible with it. The non-significant negative values likely reflect reduced statistical power due to the limited sample size, preventing definitive conclusions about population expansion or selection, although these possibilities cannot be entirely discounted (16-19). The dN/dS ratio, an efficient method for detecting selection across genes, yielded a value of 2.69 (20), indicating a trend of positive selection on the ITS1 gene in Plantago during its evolution. Analysis of conserved regions within the ITS1 gene revealed a moderate level of conservation (C = 0.703), below the typical threshold of 0.8, consistent with the role of ITS1 as a rapidly evolving molecular marker ideal for low-level phylogenetic studies such as species differentiation. The conserved regions occur as short, dispersed fragments (mean conserved block length = 65), a pattern typical of non-coding regions in which conserved blocks may be vital for maintaining RNA secondary structure or ribosomal function, while variable regions permit diversity (18, 19, 21, 22). This moderate level of conservation, corroborating prior studies emphasizing the high variability of ITS1 in Plantago (9), makes it a useful marker for reconstructing infrageneric phylogenetic relationships by providing both informative variable sites and reliable sequence alignment.
The observed substitution rate of 0.005, combined with the pattern of short branch lengths, suggests a slow molecular evolutionary rate for the ITS1 region. This phenomenon may result from a relatively high degree of sequence conservation within this gene region in the genus Plantago. Such a pattern is fully consistent with close evolutionary relationships and relatively recent divergence within this genus. Overall, although species-level diversity is observed, most studied sequences share close evolutionary ties, with limited deep divergence in this dataset. This characteristic could stem from the relatively recent evolutionary history of the genus or from a high degree of conservation in the ITS1 region. For phylogenetic comparisons with Plantago, taxa from related families or those with similar characteristics can be used. Suitable plants for phylogenetic comparison include Veronica, Littorella, Callitriche, Bougueria, Atriplex, and Rumex. Rumex, a dock in Polygonaceae, can serve as an outgroup to root the tree and investigate convergent evolution (19, 23-25).
The dataset comprises 331 Plantago sequences, indicating high intrageneric genetic diversity. The presence of some duplicate sequences and the absence of certain numbers may reflect intraspecific variation. The complex tree structure, likely displaying several distinct clades, probably corresponds to different species, subspecies, or geographical populations. All Plantago species are expected to form a monophyletic group descended from a common ancestor. The primary focus of the tree is diversity within the genus. Phylogenetic comparisons with related genera in Plantaginaceae, such as Veronica, the likely closest relative; Littorella, a potential sister group; Callitriche; and Bougueria, will help resolve relationships within the family. Genera from other families, including Atriplex and Rumex, act as more distant outgroups. This phylogenetic analysis provides a robust foundation for understanding the diversity and evolutionary relationships within the genus Plantago, paving the way for future ecological, conservation, and systematic studies (24, 26-28).
5.1. Conclusions
The results showed that the Plantaginaceae family has a complex evolutionary history and high genetic diversity, with the genus Plantago playing a central role within this family. The ITS1 region, containing 123 polymorphic sites and 100 distinct haplotypes, demonstrated considerable genetic richness among the studied populations. Phylogenetic analysis using the Neighbor-Joining method revealed a clear clustering pattern among ITS1 sequences and close evolutionary relationships among many species. In addition, the short branches observed in the phylogenetic tree indicated relatively recent divergence within this genus. These findings confirm the efficiency of the ITS1 region as a suitable molecular marker for genetic and phylogenetic studies.