
1. Background
Healthcare expenditure has risen substantially worldwide in recent decades and now represents one of the largest components of public spending. Health spending accounts for a substantial share of gross domestic product (GDP) across Organisation for Economic Co-operation and Development (OECD) member countries (1). The World Health Organization estimates that 20 - 40% of health-system resources are lost to financial, managerial, and operational inefficiencies. These trends have raised concerns regarding the sustainability of healthcare financing and the need for more efficient resource allocation (2).
Hospitals are among the most resource-intensive components of healthcare systems and account for a major share of total health expenditure (3, 4). Improving hospital efficiency and resource use has therefore become a key priority for policymakers and managers (5, 6).
Financial key performance indicators (FKPIs) are widely used to assess hospital financial performance and support managerial decision-making, providing a multidimensional perspective beyond traditional accounting measures. The international literature commonly uses indicators of liquidity, cost, revenue, efficiency, and financial sustainability (7, 8). Liquidity indicators (eg, current and quick ratios) assess short-term financial stability, whereas revenue, cost, and efficiency indicators (eg, cost and revenue per occupied bed-day) evaluate resource use and hospital performance (7, 9). However, considerable heterogeneity remains in the selection, definition, and application of these indicators across studies and healthcare systems.
In Iran, hospital financial management has undergone reforms, including accrual accounting, operational budgeting, and the Health Transformation Plan, aimed at improving transparency and efficiency (10, 11). Health expenditure accounts for approximately 5 - 6% of GDP, while out-of-pocket payments constitute nearly 40% of total health expenditure, reflecting a considerable burden on households. Public hospitals nonetheless face rising costs, reimbursement delays, and resource constraints, increasing the need for robust financial monitoring tools (12).
A distinctive feature of Iran's hospital financing system is insurance claim deductions, which occur when insurers reimburse less than the claimed amount because of documentation deficiencies, coding errors, or regulatory constraints (13, 14). Government and university-based discounts further affect realized revenues, and incentive-based payment systems redistribute hospital-generated revenue among physicians, staff, and trainees (15). These context-specific mechanisms introduce financial complexities that are not fully captured by conventional international indicators.
Evaluating financial performance in Iranian public hospitals therefore requires simultaneous consideration of liquidity, revenue, cost, efficiency, and context-specific indicators related to claim deductions and performance-based payments (16, 17). No standardized, consensus-based framework yet exists for this purpose. International KPI frameworks were not adopted directly because they are generally built around insurer-based reimbursement and market pricing, which differ from Iran's centrally regulated tariffs, claim deductions, and performance-based revenue redistribution and may therefore omit these context-specific mechanisms.
Although existing studies have examined hospital costing, efficiency, and performance indicators (9, 18), none has systematically integrated international financial indicators with context-specific Iranian measures through a structured expert consensus approach. This gap is important given the need for validated indicator frameworks in performance-evaluation systems.
2. Objectives
This study aimed to identify, prioritize, and achieve consensus on FKPIs for Iranian public hospitals using the Delphi technique, integrating internationally recognized indicators with context-specific measures to support evidence-based decision-making and financial sustainability.
3. Methods
This study used a modified Delphi technique conducted in Iran in 2025. The Delphi technique is a well-established method for achieving structured expert consensus in areas where evidence is fragmented or inconsistent (19). Through iterative feedback rounds, it enables the identification, refinement, and prioritization of relevant and feasible indicators.
Because the study focused on hospitals affiliated with the Ministry of Health and Medical Education, a panel of 25 experts—senior hospital administrators, financial managers, and health economics specialists—was recruited through purposive sampling from the Universities of Medical Sciences of Shiraz, Iran, Mashhad, Tabriz, Isfahan, Mazandaran (Sari), and Lorestan. This panel size falls within the 10 - 30 range generally recommended for Delphi studies involving a homogeneous group of specialists (19).
3.1. Delphi Panel Characteristics
Panel characteristics are presented in Table 1. Of the 25 participants, 20 (80%) were male and 5 (20%) were female; 15 (60%) had 15 - 20 years of managerial experience and 10 (40%) had more than 20 years; and 2 (8%) held a bachelor's degree, 13 (52%) held a master's degree, and 10 (40%) held a doctoral qualification (PhD or MD).
Table 1.
Characteristics of Delphi Panel Members
| Characteristics | No. (%) |
|---|---|
| Gender | |
| Female | 5 (20) |
| Male | 20 (80) |
| Managerial experience (y) | |
| 15 - 20 | 15 (60) |
| > 20 | 10 (40) |
| Educational level | |
| Bachelor's degree | 2 (8) |
| Master's degree | 13 (52) |
| PhD/MD | 10 (40) |
The inclusion criteria were: 1) a relevant academic qualification in health services management, financial management, accounting, or health economics; 2) at least 15 years of experience in the healthcare system, including 10 years of direct managerial experience at the senior hospital or university level; and 3) substantial operational knowledge of financial processes in public hospitals.
To ensure ethical compliance and maximize response rates, all participants received an information sheet describing the study objectives and procedures before the Delphi rounds began, and written informed consent was obtained from all participants.
3.2. Round 1: Identification and Initial Screening of Financial Indicators
In Round 1, a narrative literature review identified a comprehensive set of financial performance indicators (20). The review covered studies published from 2010 to 2025 in Web of Science, Scopus, PubMed, and Google Scholar and used search terms including “Hospital Financial Performance,” “Financial Key Performance Indicators,” “Financial Management,” “Public Hospitals,” “Healthcare Financial Sustainability,” “Hospital Revenue Cycle,” and “Performance Measurement Framework.”
Studies were included if they addressed hospital financial performance evaluation and reported quantitative indicators or ratios. The search was limited to these four databases; local Persian-language databases (eg, SID, Irandoc, and Magiran) were not searched separately, which may have resulted in the omission of non-indexed national literature. After duplicate records were removed, the extracted measures were reviewed by the research team and health economics experts for compatibility with the financing and reimbursement structure of Iranian public hospitals.
For each indicator, a standardized profile—including the operational definition, calculation formula, managerial application, and data source—was developed and reviewed by the research team and the Delphi panel before Round 2.
The resulting list was distributed to panel members, who were invited to suggest additional indicators. Open-ended comments were analyzed using conventional content analysis. Two research team members independently coded the responses and resolved discrepancies through discussion to identify indicators requiring modification, addition, or removal.
3.3. Round 2: Rating and Prioritization of Indicators
The questionnaire was reviewed by experts for clarity before administration. Content validity was supported by face validity and the multistage, iterative expert-review process.
In Round 2, the retained indicators were presented in a structured questionnaire using a 5-point Likert scale (1 = not important at all to 5 = critically important), with space for comments and suggested modifications.
A feedback report summarizing the frequency distribution, median, and interquartile range (IQR) for each indicator was prepared and distributed to all panel members. Consistent with established Delphi methodology, a median ≥ 4 and IQR ≤ 1 were used as the primary consensus criteria (21). The same 25 experts completed all 3 rounds, yielding a 100% round-level response rate. For some indicators, participants did not respond because of a lack of familiarity (Table 3).
Table 2.
Initial Financial Performance Indicators Identified from the Literature Review and Included in the First Delphi Round
| No. | Categories | Indicator |
|---|---|---|
| 1 | Profitability | Operating Margin |
| 2 | Net Profit | |
| 3 | Return on Assets (ROA) | |
| 4 | Revenue-to-Cost Ratio | |
| 5 | Liquidity | Current Ratio |
| 6 | Quick Ratio | |
| 7 | Cash Ratio | |
| 8 | Debt-to-Equity Ratio | |
| 9 | Debt-to-Asset Ratio | |
| 10 | Revenue and cost management | Total Hospital Revenue |
| 11 | Inpatient Services Revenue | |
| 12 | Outpatient Services Revenue | |
| 13 | Insurance Deduction Rate | |
| 14 | Operating Revenue Sustainability | |
| 15 | Total Operating Costs | |
| 16 | Personnel Cost Ratio | |
| 17 | Pharmaceutical and Medical Supply Costs | |
| 18 | Equipment Maintenance and Repair Costs | |
| 19 | Cost-to-Revenue Ratio | |
| 20 | Financial Sustainability | Financial Sustainability Composite Index |
| 21 | Asset and Operational Efficiency | Revenue per Active Bed |
| 22 | Cost per Active Bed | |
| 23 | Revenue per Discharge | |
| 24 | Cost per Discharge | |
| 25 | Asset Turnover Ratio |
3.4. Round 3: Final Consensus
Round 3 confirmed the agreed-upon indicators and resolved remaining uncertainty. Indicators meeting the Round 2 consensus criteria were presented for final confirmation and assessment of practical applicability.
4. Results
In Phase 1, an initial list of financial performance indicators was developed from the literature and supporting documents, yielding a preliminary framework of 5 major categories. This framework was distributed to the Delphi panel using a researcher-developed questionnaire. Panel demographics are shown in Table 1.
4.1. Findings From Round 1
After a comprehensive database search and the removal of duplicates, 11 eligible English-language publications were reviewed in full text. This small number reflected the strict eligibility criterion requiring quantitative, hospital-level financial indicators or ratios and excluding broader studies on efficiency, quality, or general healthcare financing without discrete financial indicators. This process yielded 25 candidate indicators frequently reported in the literature.
These 25 indicators were presented to the Delphi panel for evaluation and refinement. Based on experts' recommendations in Round 1, additional indicators reflecting the operational and financial realities of Iranian public hospitals were proposed and incorporated into subsequent rounds. The full list from the literature review is shown in Table 2.
Table 3.
Expert Consensus on Financial Performance Indicators in the Second Delphi Round
| No. | Indicator | Frequency (N) | Median | IQR | Decision |
|---|---|---|---|---|---|
| 1 | Current Ratio | 25 | 5 | 0 | Accepted |
| 2 | Quick Ratio | 25 | 5 | 0 | Accepted |
| 3 | Inventory Turnover Ratio | 25 | 4 | 1 | Accepted |
| 4 | Accounts Receivable Collection Period (Days Sales Outstanding, DSO) | 25 | 5 | 0 | Accepted |
| 5 | Average Debt Repayment Period | 25 | 4 | 1 | Accepted |
| 6 | Cost-to-Revenue Ratio | 25 | 5 | 0 | Accepted |
| 7 | Total Cost-to-Dedicated Revenue Ratio | 25 | 5 | 0 | Accepted |
| 8 | Pharmaceutical Revenue to Total Revenue Ratio | 22 | 4 | 1 | Accepted |
| 9 | Patient Service Revenue-to-Total Revenue Ratio | 25 | 4 | 1 | Accepted |
| 10 | Dedicated Revenue-to-Total Revenue Ratio | 25 | 4 | 1 | Accepted |
| 11 | Insurance Claim Denials-to-Dedicated Revenue Ratio | 25 | 5 | 0 | Accepted |
| 12 | Discounts-to-Dedicated Revenue Ratio | 25 | 4 | 1 | Accepted |
| 13 | Personnel Cost to Total Cost Ratio | 25 | 5 | 0 | Accepted |
| 14 | Pharmaceutical and Medical Supply Costs to Total Cost Ratio | 25 | 4 | 1 | Accepted |
| 15 | Total Cost per Active Bed-Day | 25 | 5 | 0 | Accepted |
| 16 | Total Cost per Occupied Bed-Day | 25 | 5 | 0 | Accepted |
| 17 | Dedicated Revenue per Occupied Bed-Day | 25 | 4 | 1 | Accepted |
| 18 | Patient Service Revenue per Occupied Bed-Day | 19 | 4 | 1 | Accepted |
| 19 | Patient Service Revenue per Active Bed-Day | 25 | 4 | 1 | Accepted |
| 20 | Dedicated Revenue per Active Bed-Day | 25 | 4 | 1 | Accepted |
| 21 | Personnel Cost to Total Revenue Ratio | 25 | 4 | 1 | Accepted |
| 22 | Overtime Cost-to-Personnel Cost Ratio | 25 | 4 | 1 | Accepted |
| 23 | Overtime Cost-to-Patient Service Revenue Ratio | 16 | 4 | 1 | Accepted |
| 24 | Staff Performance-Based Payments to Personnel Cost Ratio | 25 | 4 | 1 | Accepted |
| 25 | Staff Performance-Based Payments to Dedicated Revenue Ratio | 25 | 4 | 1 | Accepted |
| 26 | Physicians’ Performance-Based Payments to Dedicated Revenue Ratio | 25 | 4 | 1 | Accepted |
| 27 | Physicians’ Performance-Based Payments-to-Professional Fee Revenue Ratio | 25 | 4 | 1 | Accepted |
| 28 | Staff Performance-Based Payments-to-Professional Fee Revenue Ratio | 21 | 4 | 1 | Accepted |
| 29 | Trainees’ Performance-Based Payments-to-Professional Fee Revenue Ratio | 25 | 4 | 1 | Accepted |
| 30 | Overhead Cost to Total Cost Ratio | 25 | 4 | 1 | Accepted |
| 31 | Contracted Service Cost -to-Total Cost Ratio | 25 | 4 | 1 | Accepted |
| 32 | Food Service Cost-to-Room and Board Revenue | 22 | 4 | 1 | Accepted |
| 33 | University Share-to- Patient Service Revenue Ratio | 25 | 4 | 1 | Accepted |
| 34 | Payables Aging of Physicians’ Performance-Based Payments Debt | 25 | 4 | 2 | Excluded |
| 35 | Payables Aging of Staff Performance-Based Payments Debt | 25 | 4 | 2 | Excluded |
| 36 | Payables Aging of Pharmaceutical Debt | 25 | 4 | 2 | Excluded |
| 37 | Aging of Medical Consumables Debt | 20 | 4 | 2 | Excluded |
| 38 | Payables Aging of Contractual Debt | 25 | 4 | 2 | Excluded |
| 39 | Operating Margin | 25 | 3 | 2 | Excluded |
| 40 | Quick Ratio to Fixed Assets Ratio | 25 | 3 | 2 | Excluded |
| 41 | Total Assets to Total Liabilities Ratio | 25 | 4 | 2 | Excluded |
| 42 | Working Capital Turnover Ratio | 25 | 4 | 2 | Excluded |
| 43 | Educational Cost to Total Revenue Ratio | 18 | 3 | 2 | Excluded |
| 44 | Supplemental Insurance Penetration Rate | 18 | 4 | 2 | Excluded |
| 45 | Repair and Maintenance Cost to Fixed Assets Ratio | 18 | 3 | 2 | Excluded |
Experts generally agreed with the literature-derived indicators but proposed several additional measures reflecting the financial and managerial characteristics of Iranian public hospitals. After review and consolidation, the total increased to 45 indicators, which were incorporated into the Round 2 questionnaire.
4.2. Results of the Second Delphi Round
After the indicators were finalized in Round 1, a questionnaire was distributed to panel members to assess the importance of each indicator.
Of the 45 indicators, 33 met the predefined consensus criteria (median ≥ 4 and IQR ≤ 1) and were retained for Round 3, whereas 12 were excluded because of insufficient consensus (Table 3).
4.3. Results of the Third Delphi Round
Round 3 confirmed the retained indicators and their practical applicability. Following analysis, 33 indicators were ultimately selected for evaluating and monitoring financial performance and were organized into 5 domains: liquidity and working capital management, revenue management, cost management, human resource and compensation management, and operational and service efficiency. The domain structure evolved during classification: the single financial sustainability indicator identified in the literature review did not reach independent consensus and was instead represented by accepted income-expenditure ratios (eg, cost-to-income ratio and total expenditure-to-appropriated income ratio), which were considered more directly measurable. The final domains therefore reflect consensus-based reclassification based on operational measurability rather than the initial literature-based categories. The final indicators, formulas, and managerial applications are presented in Table 4.
Table 4.
Final Financial Performance Indicators for Public Hospitals in Iran: Calculation Formulas and Managerial Applications
| No. | Indicators | Formulas | Managerial implications |
|---|---|---|---|
| 1 | Current Ratio | Current Assets / Current Liabilities | Assesses short-term liquidity. |
| 2 | Quick Ratio | (Current Assets − Inventory) / Current Liabilities | Measures immediate liquidity. |
| 3 | Inventory Turnover Ratio | Issued Inventory / Pharmaceutical and Medical Supply Inventory | Evaluates inventory turnover efficiency. |
| 4 | Accounts Receivable Collection Period | (Accounts Receivable / Operating Revenue) × 365 | Measures insurance receivable collection efficiency. |
| 5 | Average Debt Repayment Period | Current Liabilities / (Operating Costs / 365) | Measures payment settlement efficiency. |
| 6 | Cost-to-Revenue Ratio | Total Costs / Total Revenue | Evaluates financial performance. |
| 7 | Total Cost-to-Dedicated Revenue Ratio a | Total Costs / Dedicated Revenue | Assesses cost efficiency relative to dedicated revenue. |
| 8 | Pharmaceutical Revenue-to-Total Revenue Ratio | Pharmaceutical Revenue / Total Revenue | Measures pharmaceutical revenue contribution. |
| 9 | Patient Service Revenue-to-Total Revenue Ratio b | Patient Service Revenue / Total Revenue | Measures patient service revenue contribution. |
| 10 | Dedicated Revenue-to-Total Revenue Ratio | Dedicated Revenue / Total Revenue | Measures dependence on dedicated revenue. |
| 11 | Insurance Claim Denials-to-Dedicated Revenue Ratio | Insurance Claim Denials / Dedicated Revenue | Monitors insurance claim denials. |
| 12 | Discounts-to-Dedicated Revenue Ratio | Discounts / Dedicated Revenue | Monitors revenue losses from discounts. |
| 13 | Personnel Cost-to-Total Cost Ratio | Personnel Costs / Total Costs | Measures personnel cost burden. |
| 14 | Pharmaceutical and Medical Supply Cost-to-Total Cost Ratio | Pharmaceutical and Medical Supply Costs / Total Costs | Measures medical supply cost burden. |
| 15 | Total Cost per Active Bed-Day | Total Costs / Active Bed-Days | Measures average cost per active bed-day. |
| 16 | Total Cost per Occupied Bed-Day | Total Costs / Occupied Bed-Days | Measures average cost per occupied bed-day. |
| 17 | Dedicated Revenue per Occupied Bed-Day | Dedicated Revenue / Occupied Bed-Days | Measures dedicated revenue productivity. |
| 18 | Patient Service Revenue per Occupied Bed-Day | Patient Service Revenue / Occupied Bed-Days | Measures patient service revenue productivity. |
| 19 | Patient Service Revenue per Active Bed-Day | Patient Service Revenue / Active Bed-Days | Measures revenue per active bed-day. |
| 20 | Dedicated Revenue per Active Bed-Day | Dedicated Revenue / Active Bed-Days | Measures dedicated revenue per active bed-day. |
| 21 | Personnel Cost-to-Total Revenue Ratio | Personnel Costs / Total Revenue | Assesses labor cost efficiency. |
| 22 | Overtime Cost-to-Personnel Cost Ratio c | Overtime Costs / Personnel Costs | Monitors overtime cost burden. |
| 23 | Overtime Cost-to-Patient Service Revenue Ratio | Overtime Costs / Patient Service Revenue | Measures overtime expenditure efficiency. |
| 24 | Staff Performance-Based Payments-to-Personnel Cost Ratio | Staff Performance-Based Payments / Personnel Costs | Monitors staff incentive payments. |
| 25 | Staff Performance-Based Payments-to-Dedicated Revenue Ratio | Staff Performance-Based Payments / Dedicated Revenue | Measures staff incentive payments relative to revenue. |
| 26 | Physicians' Performance-Based Payments-to-Dedicated Revenue Ratio | Physicians' Performance-Based Payments / Dedicated Revenue | Monitors physicians’ incentive payments. |
| 27 | Physicians' Performance-Based Payments-to-Professional Component Revenue Ratio | Physicians' Performance-Based Payments / Professional Component Revenue | Measures physician incentive payments relative to professional revenue. |
| 28 | Staff Performance-Based Payments-to-Professional Component Revenue Ratio | Staff Performance-Based Payments / Professional Component Revenue | Measures staff incentive payments relative to professional revenue. |
| 29 | Trainees' Performance-Based Payments-to-Professional Component Revenue Ratio d | Trainees' Performance-Based Payments / Professional Component Revenue | Monitors trainee incentive payments. |
| 30 | Overhead Cost-to-Total Cost Ratio e | Overhead Costs / Total Costs | Measures overhead cost burden. |
| 31 | Contracted Service Cost-to-Total Cost Ratio | Contracted Service Costs / Total Costs | Measures outsourced service cost burden. |
| 32 | Food Service Cost-to-Room and Board Revenue Ratio | Food Service Costs / Room and Board Revenue | Measures food service cost efficiency. |
| 33 | University Share-to-Patient Service Revenue Ratio f | University Share / Patient Service Revenue | Monitors university revenue allocation. |
a Dedicated revenue refers to revenues generated directly by the hospital through the provision of healthcare services and other legally authorized income sources, which remain under the hospital's financial management in accordance with the regulations of the Iranian public health system.
b Patient service revenue refers to income generated from the provision of inpatient and outpatient healthcare services, including the professional and technical components reimbursed by patients, insurers, or other payers according to the Iranian hospital reimbursement system.
c Overtime costs refer to payments made to hospital personnel for working beyond their regular working hours in accordance with the employment regulations governing the Iranian public health sector.
d Trainees refer to medical residents and other clinical trainees who participate in patient care and are eligible to receive performance-based payments according to the regulations of Iranian teaching hospitals.
e Overhead costs refer to indirect administrative and support expenditures that cannot be directly attributed to specific patient care services but are necessary for hospital operations.
f University share refers to the predefined proportion of patient service revenue that public hospitals are required to transfer to their affiliated university of medical sciences in accordance with the financial regulations of the Iranian public health system.
5. Discussion
The study produced a framework of 33 FKPIs grouped into five domains: liquidity and working capital management, revenue management, cost management, human resource and compensation management, and operational and service efficiency (Figure 1).
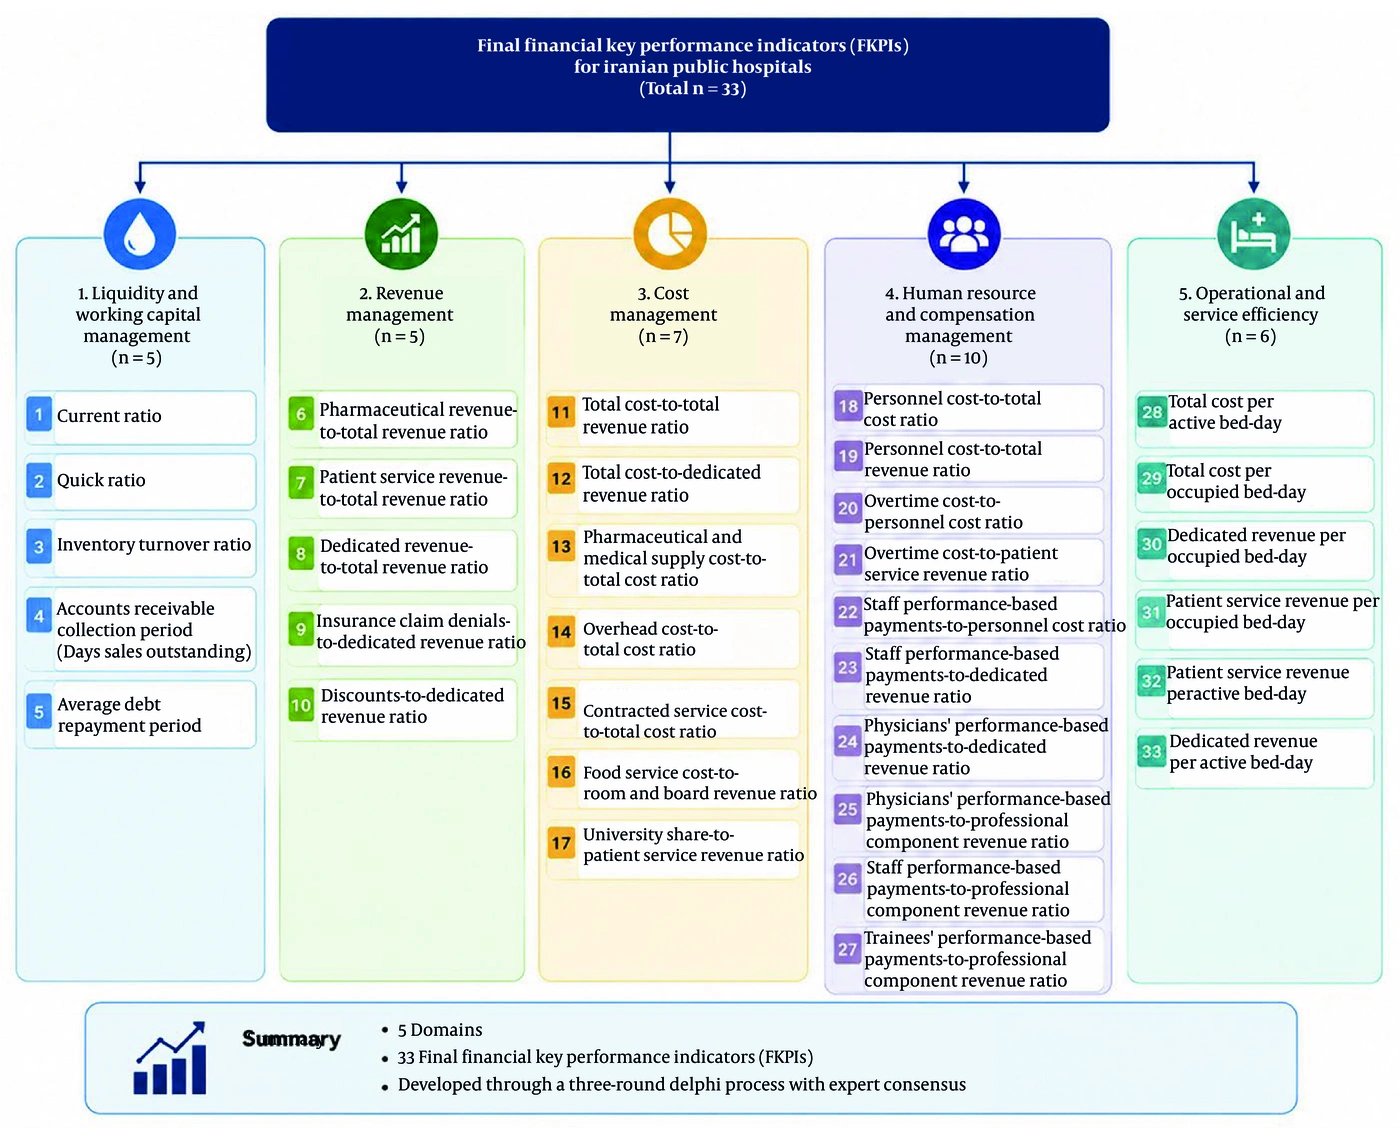
Figure 1.
Classification of the 33 financial key performance indicators (FKPIs) identified for Iranian public hospitals. This figure provides a visual summary of the domain structure; the corresponding formulas and managerial applications for each indicator are presented in Table 4.
Liquidity indicators, such as the current and quick ratios, together with revenue and cost-control indicators, such as the total cost-to-total revenue and total cost-to-dedicated revenue ratios, were rated by the expert panel as the most important tools for assessing financial performance. This finding is consistent with Dubas-Jakóbczyk et al. (8), who emphasized the critical role of liquidity, profitability, and stability indicators in healthcare sustainability (9, 22). This weighting also has interpretive significance: liquidity and cost-control ratios were consistently rated above the single financial sustainability index initially identified in the literature, suggesting that experts preferred measures that can be tracked reliably using available hospital data rather than composite constructs that are more difficult to operationalize.
A key finding was the emphasis on context-specific indicators, including dedicated revenue, insurance claim denials, performance-based payments, and the university share of patient service revenue. Given public hospitals' heavy dependence on insurance reimbursement, experts ranked the management of claim deductions among the most critical aspects of financial performance evaluation. This is consistent with Nabovati et al.'s prioritization of dashboard indicators for Iranian hospitals, which found that liquidity constraints place greater emphasis on cash-flow and receivable-collection indicators than do international frameworks (18). These context-specific indicators complement internationally recognized measures by reflecting financing mechanisms unique to Iran.
The inclusion of operational-financial indicators (eg, patient service revenue per occupied and active bed-day) reflects experts' view that resource efficiency should be assessed alongside operational efficiency. This finding is consistent with Dubas-Jakóbczyk et al.'s scoping review linking operational efficiency to financial stability and quality of care (7) and with Imani et al.'s review identifying bed-related and patient-flow metrics as important links between clinical operations and economic performance (9). These findings support the inclusion of both operational and financial indicators in a comprehensive framework for evaluating the financial performance of public hospitals.
In the cost domain, the high consensus regarding personnel expenses and performance-based payments reflects the substantial share of personnel costs in hospital cost structures. This is consistent with Griffiths et al. and Twigg et al., who showed that workforce composition and staff-related expenditure affect not only clinical outcomes, such as healthcare-associated infections and patient safety, but also efficiency and financial performance (23, 24). Monitoring human resource costs is therefore fundamental to assessing resource efficiency.
Experts also favored indicators that are readily measurable and extractable from existing hospital information systems over more complex measures. The exclusion of indicators such as debt aging, due to insufficient consensus and difficulties in data extraction, reflects the gap between theoretical measures and the practical realities of management information systems (MIS) in public hospitals, consistent with Gartner and Lemaire's findings on implementing performance frameworks without reliable, standardized data (25). The final 33 indicators therefore balance scientific rigor with practical applicability, consistent with broader Iranian health-economics research on cost and utilization in other clinical areas (26).
From a policy perspective, the framework can support health financing and financial management by enabling more transparent monitoring of resource allocation, expenditure control, and revenue performance, an approach comparable with international models but applicable to the Iranian public hospital system.
Routine monitoring of all 33 indicators may not be feasible for every hospital, particularly smaller facilities with limited analytical capacity. A more realistic approach is to prioritize higher-consensus indicators for routine dashboard reporting using the definitions and data paths in Table 4 and to reserve the remaining indicators for periodic review. Compared with international Delphi-based studies such as those by Nabovati et al. and Gartner and Lemaire, the present framework similarly emphasizes liquidity, cost, and revenue measures but adds indicators addressing claim deductions and performance-based payments specific to Iran's financing structure (18, 25). Given similar financing features in other low- and middle-income countries, the general framework may be transferable, although specific indicator profiles would require local validation.
5.1. Study Limitations
This study has several limitations. The expert panel was small and Iran-centric, which limits generalizability, and some indicators may have been overlooked. Some participants were unfamiliar with certain revenue- or payment-related indicators. Prioritization was inherently subjective, and the framework remains untested in practice; consensus does not establish predictive validity. In addition, no formal content validity indices (CVR/CVI) were calculated.
5.2. Conclusions
This study developed a comprehensive framework for evaluating the financial performance of public hospitals in Iran. The 33 indicators, identified and validated through expert consensus, extend beyond conventional financial ratios to incorporate operational and structural dimensions, including insurance reimbursement deductions and performance-based payment mechanisms. Experts assigned the greatest importance to indicators related to personnel costs, reimbursement deductions, and bed productivity. The framework can serve healthcare managers and policymakers as a practical tool for financial performance assessment, decision-making, and resource allocation. For policymakers, it provides a standardized basis for measuring performance; for managers, prioritizing the agreed-upon indicators for routine dashboard monitoring is a practical starting point.