


1. Background
Health systems all around the world encounter several challenges. As such, they are threatened by inefficiency and not fulfilling the expectations of patients continuously (1). The hospital which is a significant part of health systems presents complex and vital services. Hospitals consume a significant part of the health sector financial resources in both developed and developing countries (1-3). Hospitals have difficulties meeting patients’ expectations due to the complex processes of service delivery and the diversity of patients. This raises patients’ dissatisfaction and increases their complaints from hospital services, which ultimately affects hospital performance (4). According to the key role of hospitals in presenting health services, they will have much effect on health system efficiency. Therefore, monitoring and evaluation of hospital performance should be considered especially (1).
In general, performance management is one of the essential and vital components for any organization. Therefore, in order to be aware of the desirability and quality of its activities, an organization is in urgent need of an evaluation system. An efficient and accurate performance evaluation system is essential as a useful tool for hospitals and empowers the managers to control, monitor and improve the quality of health services and the performance of the organization (5, 6). Effective performance evaluation systems have the following features: comprehensiveness, comparability, measurability, and compatibility with goals (7). Among the advantages of performance evaluation are identification of opportunities for improvement, healthcare quality improvement, efficiency and accountability, contribution to decision making, and transparency and justification of the decisions for stakeholders (7-9).
Performance measurement is a continuous challenge for managers and beneficiaries and in the current era, it also plays a vital role in organizations success. Every organization requires performance evaluation systems necessarily, in order to be aware of the quality and situation of their activities, particularly in intricate and dynamic situations (10-12). So that, lack of a multi-dimensional evaluation system is recognized as one of the disease signs. First attempts for evaluating hospital performance is related to 1859 when Nightingale evaluated care quality using infections and mortalities rate (10). In recent years, most of the organizations of health care such as hospitals, psychological centers, and national and international care organizations, use balanced scorecard (BSC) increasingly to evaluate their performance (13).
BSC is recognized as a formidable instrument for organizational transformations and as an impressive performance evaluation framework in organizational and individual levels (4). BSC was introduced in 1992 as an accounting management tool that translates mission, strategies, and goals of the organization into performance measures (14). BSC helps organizations in dominance on two key subjects: effective evaluation of organizational function and strategic performance (15). One of the unique characteristics of BSC is that it emphasizes on both financial and nonfinancial aspects (16). The four perspective of BSC are the customer, internal process, learning and growth and financial (17). The most important advantages of BSC can be mentioned as the following cases: preparing suitable instruments for managers’ future competitive conditions, a decision support in strategic management that improves strategic goals, helping managers that focus their thought on organization strategic problems, the best usable instrument for presenting more comprehensive view of business, and helping organizations to obtain long-term benefits (15, 18, 19). Balanced scorecards are used to track key performance indicators and measure the success rate of quality improvement programs in many healthcare organizations (20).
Lin et al. examined the implementation of the balanced scorecards and its impact on the performance of Chinese hospitals. Their national survey showed that a large number of public hospitals in China used this tool for hospital management. They found that using a balanced scorecard is effective in improving organizational and individual performance (21). Liu studied the impact of using a balanced scorecard on improving the performance and quality of care in Taiwan’s private clinics. His case-control study showed that the improvement in the performance of the physicians and nurses in the clinics using balanced scorecards was higher than in the control clinic (22). In their research, Urrutia and Eriksen examined the possibility of using balanced scorecards in nonprofit organizations, especially hospitals, and found that scorecards could be used in all healthcare organizations (23).
Meena and Thakkar conducted a study aimed at developing a performance measurement framework based on balanced scorecards for the healthcare system. In their study, they identified the key indicators based on the scorecards and examined the relationships between them with ISM and ANP combined approach (24). Iravani Tabrizizpour et al. used a balanced scorecard to evaluate the performance of Hasheminejad hospital in Tehran. The results of their study showed that the hospital succeeded in financial and customer perspective, but failed to achieve its goals in terms of growth and learning. Also, in their study, the patients’ and their companions’ satisfaction was the most important indicator in hospital performance (25). In another study, Raeisi et al. used a scorecard to determine the performance indicators of al-Zahra hospital in Isfahan. In their study, the highest numbers of indicators were those of internal processes and growth and learning, respectively (11).
In using BSC as a strategic instrument, it is assumed that there is a relation between criteria, but ambiguities measured among relationship of variants are one of the challenges of systems that use BSC (13, 19). The hypothesis of cause and effect relations is very significant, since it helps to apply non-financial to forecast financial performance (12). Although there is an extensive usage of BSC in health care sectors, but there is a limited knowledge regarding to the causal relationship between BSC perspectives and performance indicators. In performed studies constraint, Yang and Tung found that there is a relationship between BSC perspectives and performance indicators by using path analysis in Taiwan hospitals (12).
2. Objectives
This study was conducted to analyze the systematic relations between key indicators of hospital performance evaluation, identify causal relations, and prioritize indicators by using DEMATEL technique. This study presents an evaluation methodology for binding key indicators performance in a strategic plan for governmental hospitals.
3. Methods
Regarding the 4 perspectives of the BSC, the most suitable indicators for measuring the performance were first selected from the literature and then screened by the experts committee whose members had several years of experience in the healthcare system. Participants through an expert panel and Delphi technique selected the KPIs (26, 27). Sampling in this study was purposive, that 20 related experts identified. Finally, 18 executive and academic professionals were contributed. Seven experts out of all the members were at least 15-year experienced professionals, while all the other ones had an experience of more than 5 years. Moreover, 12 executive experts were directors or managers of hospitals and 6 academic experts were researchers or teachers with a background of healthcare management. In this study, analysis of the causal relationships between the selected KPIs was conducted by using the DEMATEL approach, consulting with the mentioned committee, and regarding the indicators of hospital performance evaluation after being generically synthesized. Finally, through the DEMATEL technique, qualitative and quantitative analyses were performed to develop a map for the BSC strategy.
As a useful and practical method, the DEMATEL approach provides matrices and diagrams that illustrate the complicated structure of contextual causal relationships between the system elements with a numeral representing an impact strength. This method mainly assumes a system consisting of a set of criteria that allow determination of certain pairwise relationships via a mathematical-based modeling of the relations. The steps to be taken are described below (18, 28):
First step: Calculate average primary direct relation matrix (matrix Z)
Some survey studies found in the relevant literature had been carried out by asking the experts to construct matrix Z based on the related topic. The surveys had incorporated a scale of comparison for finding the effects and directions between the criteria with regard to the experts’ opinions. In this investigation, the mentioned scale was designed in the following 5 levels for measuring the relationships between the criteria: 0, no effect; 1, very low effect; 2, low effect; 3, high effect; and 4, very high effect. Notably, a value of zero was specified for the matrix diagonal elements affected by the features of the mentioned method. Normally, the primary notation for computing matrix Z in a survey study is presented as follows:
Xij = Level of impact for factor (i) to factor (j).
All responses = H, number of factors = N.
Xk = n × n non-negative matrix for kth response.
Xkij = degree of influence of factor (i) to factor j with respect to kth response.
Matrix Z = (zij) can be computed as follows (formula 1):

Equation 1.
The initial direct relation matrix (Zn × n) is constructed as follow, where (zij) represents the strength of influence from indicator (i) to indicator (j).
Second step: Calculate normalized initial direct-relation matrix (matrix D). The formulas for calculating matrix D is as follows (formula 2 and 3):

Equation 2.

Equation 3.
Third step: Obtain total-influence matrix (matrix T). The matrix T can be obtained from below formula (formula 4):

Equation 4.
In this formula (I) is an identity matrix.
Fourth Step: To obtain a diagram depicting the causal relationships between the criteria, the values of D, R, R + D, and R - D and the threshold value must be computed and set, respectively. The following essential notations should be considered when taking this step:
D = aggregate of columns of the matrix T, Dj demonstrate direct and indirect effects on factors (j) by the other factors.
R = aggregate of rows of the matrix T, Ri demonstrate direct and indirect effects given by factor (i) to the other factors.
Ri + Dj = the prominence of factor i.
Ri - Dj = the net contribution of factor i.
The information of the way a factor influences on another factor is provided by Matrix T. A threshold value can be set up by the decision makers when they want to filter out some trivial impacts. The matrix calculation provides a greater value than that of the singled-out threshold and thus draws a cause-effect diagram.
Fifth step: Finally, it constructs a strategy map of the factors. To build the strategic map, the trivial connections are eliminated (i.e. connections that are lower than the threshold value). The proposed framework of the method is as shown in Figure 1.
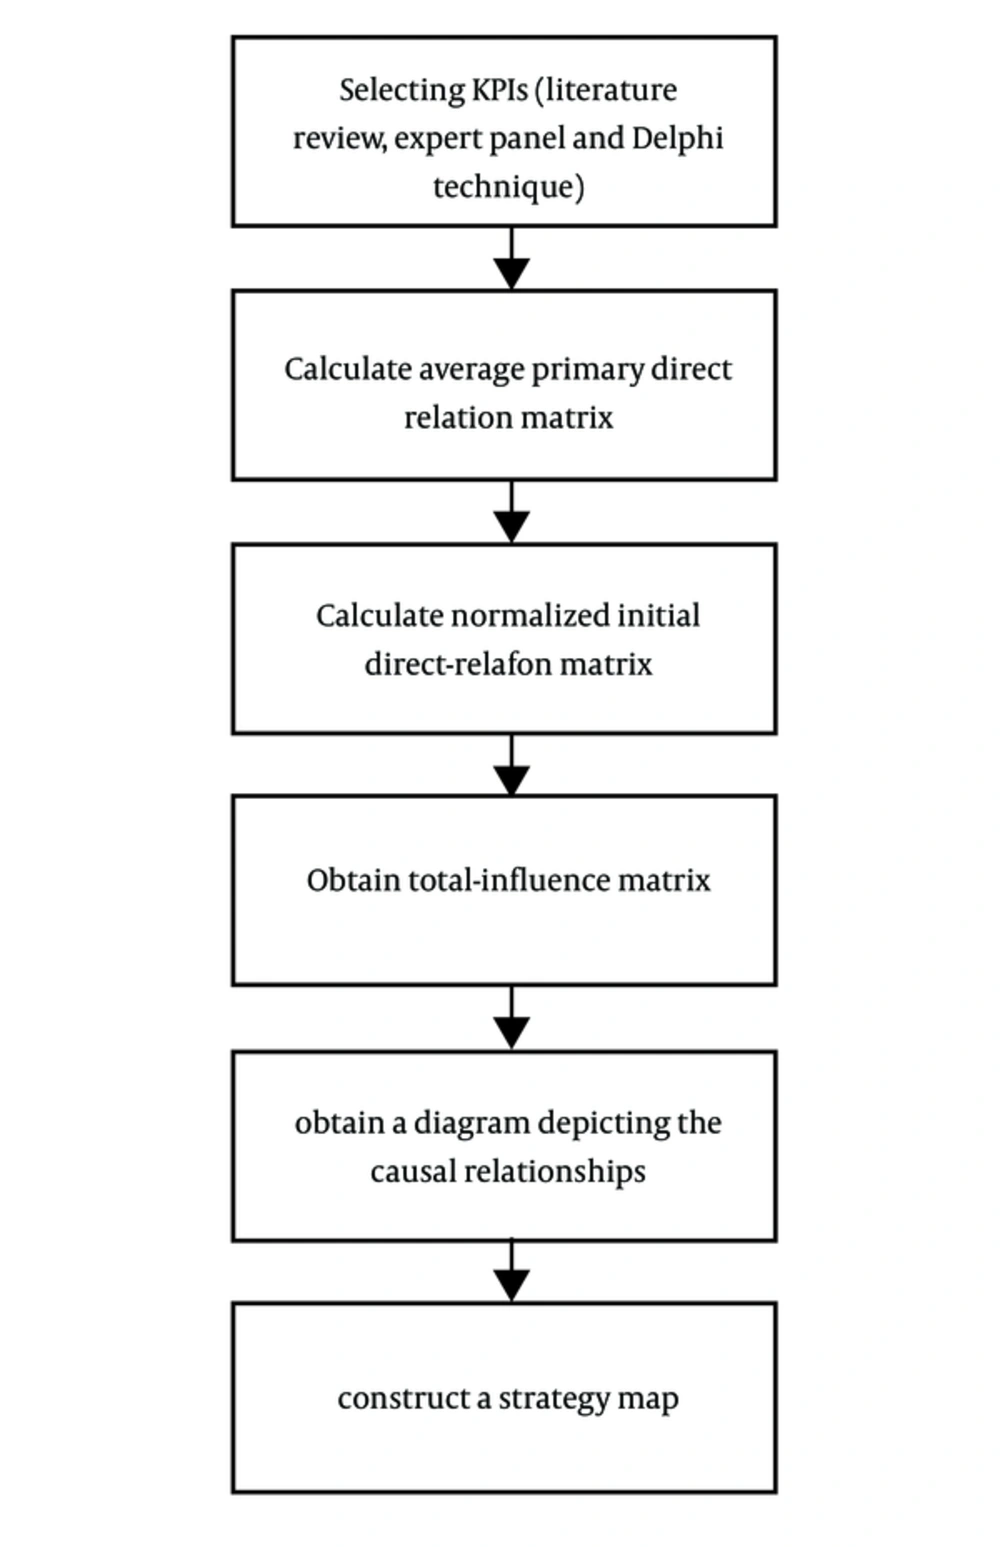
Figure 1.
Proposed framework of method
4. Results
In this research, the public hospitals of Shiraz city in Iran were considered as a typical example. To establish the structure of KPIs, the 4 perspectives of the BSC were applied with regard to the construction framework of the proposed strategy map illustrated in Figure 1. Based on the structure, the method of DEMATEL was adopted to specify the cause-and-effect relationships between the indicators, discriminate between the effective and significant factors, and construct the mentioned strategy map for the improvement of hospital performance.
4.1. Choice of Performance Evaluation Indicators
Considering the 4 perspectives of the BSC, synthesization and screening of the most proper indicators for the measurement of hospital performance were done based on the related literature and by the experts committee, respectively. To determine the importance degree of each evaluation indicator compared to the other indicators, a scale of 0 - 10 points was developed for each indicator of performance. The indicators with an average minimum score of 7 points were chosen. The selected 22 KPIs for the hospitals based on the BSC are shown in Table 1. The KPIs were grouped into the four BSC perspectives, “F: finance (F1 - F5)”,”P: internal process (P1 - P10)”,”L: learning and growth (L1 - L4)”,”C: customer (C1 - C3)” (Table 1).
Table 1.The key Performance Indicators Selected for Hospitals
| BSC Perspectives | Indicators |
|---|---|
| Finance (F) | |
| F1 | %Personnel costs of total costs |
| F2 | Ratio of total revenue to total costs |
| F3 | % Deductions of hospital |
| F4 | Average expenditures per bed per day |
| F5 | the cost of drugs and materials |
| Internal process (P) | |
| P1 | average length of stay |
| P2 | Bed occupancy |
| P3 | Mean length of stay in emergency department |
| P4 | Mortality rate |
| P5 | bed turnover rate |
| P6 | Discharge with personal satisfaction |
| P7 | Emergency room (ER) waiting time |
| P8 | Hospital infection rate |
| P9 | % canceled surgeries |
| P10 | Clinical errors |
| Learning and growth (L) | |
| L1 | Training expenditures per capita |
| L2 | Staff satisfaction rate |
| L3 | Employee absenteeism rate |
| L4 | Staff turnover |
| Customer (C) | |
| C1 | Patients satisfaction percentage |
| C2 | Rate of patient complaints |
| C3 | The facilities for families and visitors |
4.2. Construction of Causal Diagrams
To construct a strategy map, DEMATEL questionnaires with comparison scale were designed to inquire of the experts’ committee about the direct influence between hospital indicators (in five score levels (from 0 to 5): effect less, very low impact, low impact, high impact and very high impact). Then, after averaging all the specialists’ scores, the initial direct relation matrix (Z22 × 22) of the KPIs for hospital’s performance will be computed. Then, by normalizing the primary direct relation matrix, normalized direct relation matrix was acquired.
Subsequently, the total relation matrix between the KPIs for hospital’s performance was computed. Similarly, the total relation matrix of the four BSC perspectives for hospital’s performance was derived.
By producing total relation matrix (T), the R + D (relation) and R - D (influence) of the criteria (KPIs and BSC perspectives) were computed, where R and D are the sums of rows and the sum of columns of matrix T, respectively (Table 2).
Table 2.Results of the (R + D) (Relation) and (R - D) (Influence)
| Criteria (Perspectives/Indicators) | R + D | Rank | R - D | Rank |
|---|---|---|---|---|
| (F) Finance | 16.9217 | 2 | 0 | 2 |
| (F1) %Personnel costs of total costs | 3.8459 | 16 | -0.2662 | 16 |
| (F2) Ratio of total revenue to total costs | 4.7874 | 7 | -1.0779 | 20 |
| (F3) %Deductions of hospital | 2.9379 | 21 | -1.1548 | 21 |
| (F4) Average expenditures per bed per day | 3.5481 | 18 | -0.8568 | 17 |
| (F5) cost of drugs and materials | 3.1760 | 20 | -0.8718 | 18 |
| (P) Internal process | 17.4138 | 1 | -0.6076 | 3 |
| (P1) average length of stay | 5.0212 | 5 | 0.5693 | 7 |
| (P2) Bed occupancy | 5.7767 | 1 | 0.1233 | 12 |
| (P3) Mean length of stay in ER | 5.0665 | 4 | -0.2563 | 15 |
| (P4) Mortality rate | 3.4365 | 19 | 0.0962 | 13 |
| (P5) bed turnover rate | 4.2817 | 12 | 0.7615 | 3 |
| (P6) Discharge whit personal satisfaction | 4.5033 | 10 | -0.2008 | 14 |
| (P7) ER waiting time | 4.2020 | 14 | 0.4095 | 9 |
| (P8) Hospital infection rate | 4.5493 | 8 | 0.6106 | 5 |
| (P9) % canceled surgeries | 3.6320 | 17 | 0.4056 | 10 |
| (P10) Clinical errors | 5.1095 | 3 | 1.1192 | 1 |
| (L) Learning and growth | 16.0787 | 4 | 2.2807 | 1 |
| (L1) Training expenditures per capita | 4.5304 | 9 | 0.6023 | 6 |
| (L2) Staff satisfaction rate | 4.4390 | 11 | 0.2349 | 11 |
| (L3) Employee absenteeism rate | 4.2101 | 13 | 0.7901 | 2 |
| (L4) Staff turnover | 4.1546 | 15 | 0.5477 | 8 |
| (C) Customer | 16.9131 | 3 | -1.5576 | 4 |
| (C1) Patients satisfaction percentage | 4.8992 | 6 | -1.3259 | 22 |
| (C2) Rate of patient complaints | 5.4776 | 2 | -0.9259 | 19 |
| (C3) The facilities for families and visitors | 2.0230 | 22 | 0.6663 | 4 |
The causal diagrams: According to Table 2, Figures 2 and 3 display the causal diagrams of R + D and R - D dataset of the 4 perspectives and 22 indicators mapping X and Y axes for R + D and R - D, respectively. In Figure 2, “P: internal process” with the largest value of R + D showed the highest relationship with the other indicators and played a central role in the BSC perspectives of Shiraz hospitals. R - D value indicates the intensity of influence. Therefore, “L: learning and growth” with the greatest value of R - D displayed the strongest impact on the other indicators and was thus called the main “cause factor” among the perspectives. “C: customer” with the smallest value of R - D took the strongest effect from the other indicators and was thus named as the main “effect factor” among the perspectives.
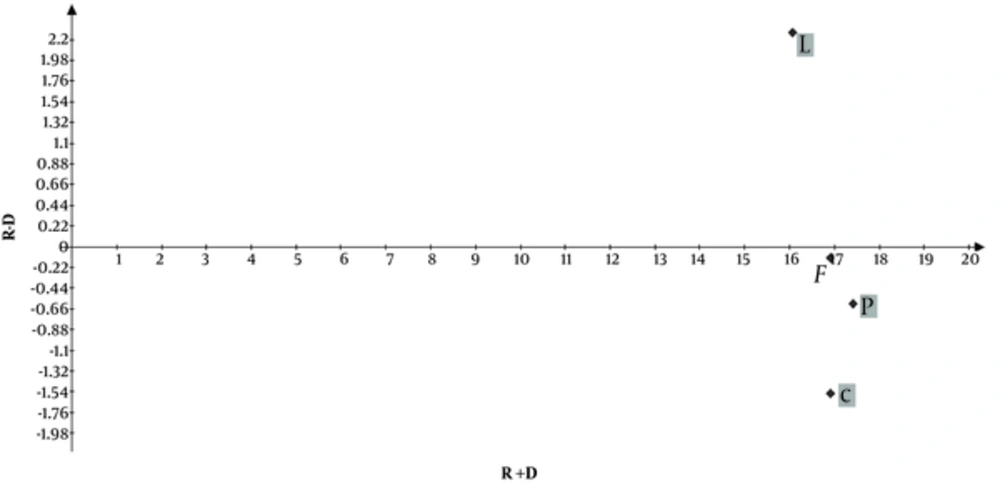
Figure 2.
A causal diagram of the four BSC perspectives for the hospital
Also, in Figure 3, “P2: bed occupancy” with the largest R + D value represented the greatest relationship with the other indicators and illustrated its major role among the indicators. On the other hand, “P10: clinical errors” with the highest value of R - D most strongly affected the other indicators and was known to be the main “cause factor” among the indicators, whereas “C1: patient satisfaction percentage” with the lowest value of R - D was most strongly influenced by the other indicators and thus called the main “effect factor” among the indicators.
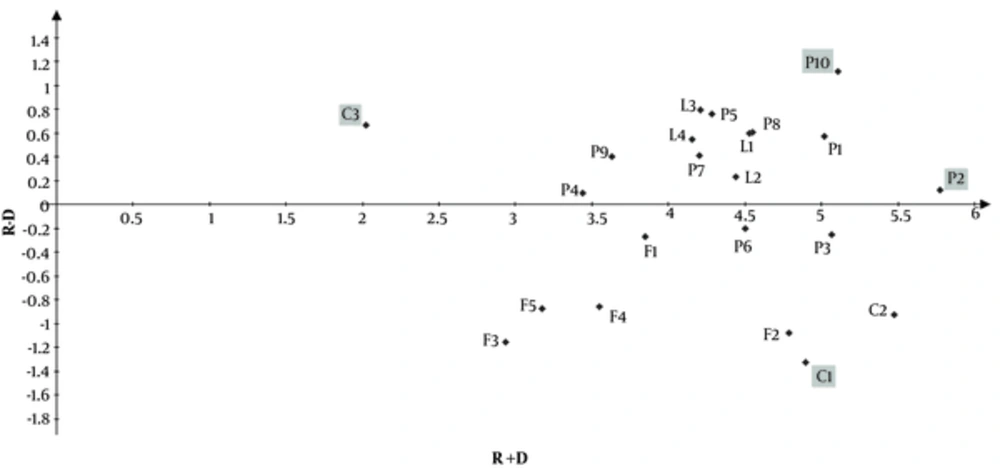
Figure 3.
A causal diagram of the key performance indicators for the hospital
4.3. A Strategic Map of KPIs for the Hospital
In this study, to construct the strategy map, the thresholds value was set to be the second quartile for the four BSC perspectives and for the 22 indicators (2.0930 and 0.1083, respectively). According to matrix T, Figure 4 portrays the constructed strategy map, in which the weak and strong relationships between the perspectives are indicated by the “dotted” and “bold” lines, respectively. As shown in Figure 4, for hospital performance, the perspective of “L: learning and growth” showed a stronger impact on the other 3 perspectives of the BSC (as the main cause-factor), whereas the “C: customer” perspective is influenced more by the other perspectives (as the main effect factor).
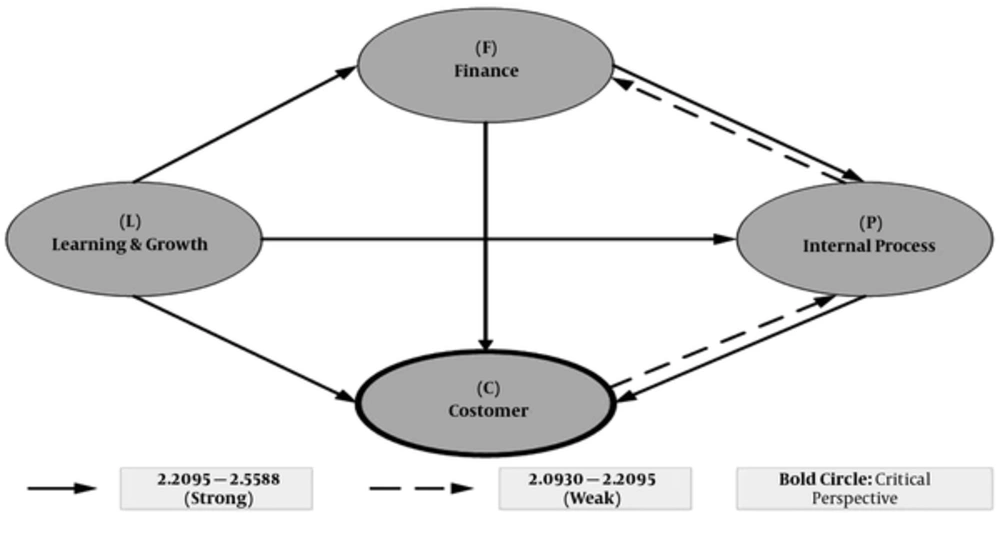
Figure 4.
A strategy map of the four BSC perspectives for hospitals
Also, according to matrix T, the strategy map of hospital’s KPIs is built as shown in Figure 5. With a cross-reference to Figure 5, Table 3 summarizes the number of dispatching and receiving indicators for each BSC performance indicators.
Table 3.Dispatching and Receiving Indicators for Each BSC Performance Indicator
| Key Performance Indicators | Dispatching to (Indicators) | Total | Receiving From (Indicators) | Total |
|---|---|---|---|---|
| (F1) %Personnel costs of total costs | P1, P2, P8, P10, L1, L3, L4 | 7 | F2, L4, C1, C2 | 4 |
| (F2) Ratio of total revenue to total costs | F1, P1, P2, P3, P4, P5, P6, P7, P8, P9, P10, L1, L2, L3, L4, C2 | 16 | C1, C2 | 2 |
| (F3) % Deductions of hospital | P1, P2, P5, P8, P10, L1, L2 | 7 | - | 0 |
| (F4) Average expenditures per bed per day | P1, P2, P5, P8, P10, L1 | 6 | - | 0 |
| (F5) cost of drugs and materials | P1, P2, P5, P8, P10 | 5 | - | 0 |
| (P1) average Length of stay | P2, P3, P5, P6, P7, P8, P9, P10, L1, L3 | 10 | F1, F2, F3, F4, F5, P2, P3, P5, P6, P7, P8, P10, L2, C1, C2 | 15 |
| (P2) Bed occupancy | P1, P2, P3, P4, P5, P6, P7, P8, P9, P10, L1, L2, L3, L4, C1, C2 | 16 | F1, F2, F3, F4, F5, P1, P2, P3, P4, P5, P6, P7, P8, P9, P10, L2, L3, L4, C1, C2 | 20 |
| (P3) Mean Length of stay in ER | P1, P2, P5, P6, P7, P8, P9, P10, L1, L2, L3, L4, C1, C2 | 14 | F2, P1, P2, P6, P7, P8, P10, L2, C1, C2 | 10 |
| (P4) Mortality rate | P2, P8, P10, L3 | 4 | F2, P2, C1, C2 | 4 |
| (P5) Bed turnover rate | P1, P2, P10 | 3 | F2, F3, F4, F5, P1, P2, P3, P6, P7, P8, P10, L2, C1, C2 | 14 |
| (P6) Discharge whit Personal satisfaction | P1, P2, P3, P5, P7, P8, P9, P10, L2, L3, L4, C1, C2 | 13 | F2, P1, P2, P3, C1, C2 | 6 |
| (P7) ER waiting time | P1, P2, P3, P5, P10, L3, L4 | 7 | F2, P1, P2, P3, P6, P8, C1, C2 | 8 |
| (P8) Hospital infection rate | P1, P2, P3, P5, P7, P10, L1, L3, L4 | 9 | F1, F2, F3, F4, F5, P1, P2, P3, P4, P6, P10, L1, C1, C2 | 14 |
| (P9) % canceled surgeries | P2, P10 | 2 | F2, P1, P2, P3, P6, C1, C2 | 7 |
| (P10) Clinical errors | P1, P2, P3, P5, P8, L1, L2, L3, L4 | 9 | F1, F2, F3, F4, F5, P1, P2, P3, P4, P5, P6, P7, P8, P9, L1, L2, L3, L4, | 18 |
| (L1) Training expenditures per capita | P8, P10, C2 | 3 | F1, F2, F3, F4, P1, P2, P3, P6, P8, P10, L2, L3, L4, C1, C2 | 15 |
| (L2) Staff satisfaction rate | P1, P2, P3, P5, P10, L1, L3, L4, C2 | 9 | F2, F3, P2, P3, P6, P10, L3, L4, C1, C2 | 10 |
| (L3) Employee absenteeism rate | P2, P10, L1, L2 | 4 | F1, F2, P1, P2, P3, P4, P6, P7, P8, P10, L2, L4, C1, C2 | 14 |
| (L4) Staff turnover | F1, P2, P10, L1, L2, L3 | 6 | F1, F2, P2, P3, P6, P7, P8, P10, L2, C1, C2 | 11 |
| (C1) Patients satisfaction percentage | F1, F2, P1, P2, P3, P4, P5, P6, P7, P8, P9, L1, L2, L3, L4, C2, C3 | 17 | P2, P3, P6, C2 | 4 |
| (C2) Rate of Patient complaints | F1, F2, P1, P2, P3, P4, P5, P6, P7, P8, P9, L1, L2, L3, L4, C1, C3 | 17 | F2, P2, P3, P6, L1, L2, C1, | 7 |
| (C3)The facilities for families and visitors | - | 0 | C1, C2 | 2 |
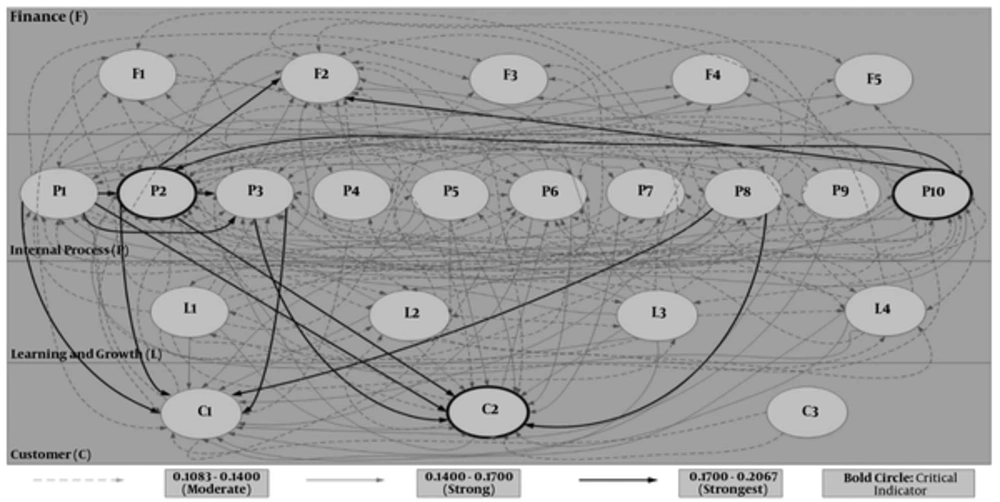
Figure 5.
A strategy map of key performance indicators based on the BSC for hospitals
As shown in Figure 5, three critical indicators, including “P2: bed occupancy” “P5: bed turnover rate”, and “C2: rate of patient complaints” are marked as “bold circles”. On the other hand, Table 3 shows “P2: bed occupancy” included some indicators that influenced on and were influenced by more than 10 indicators. Moreover, “P10: clinical errors” perspective has more than 10 receiving indicators but fewer than 10 dispatching indicators. “C2: rate of patient complaints” revealed to have more than 10 affecting but fewer than 10 affected indicators.
5. Discussion
The present investigation aims to identify the effective indicators on hospitals’ performance. Therefore, at first, indicators were extracted from the literature reviewed and categorized and they were classified by using experts ideas based on BSC framework of the selected key indicators. Then by using DEMATEL method, causal relations between BSC perspectives and key indicators were extracted. This method by considering the influence and effect among variants, effectively determined the performance evaluation indicators. Therefore, according to the results of this study, internal processes perspective has a central role in hospital performance. Also, customer perspective is the most affected perspective of BSC in the studied hospitals. Each of BSC perspectives is discussed subsequently.
5.1. Customer Perspective
In this study, the DEMATEL analysis showed that in hospitals, customer perspective is the main effect factor (lowest R - D). This result showed that if a change is created in other BSC views, it will have effect on the customer perspective indicators. In this perspective, satisfaction rate indicators and a number of patient complaints are considered as two key indicators of performances evaluations of governmental hospitals. The current study showed that these two indicators are under the effect of 17 other key indicators. Based on Figure 3, patient satisfaction indicator by the least grade of R - D is the most affected performance indicator. Also, in the study of Sheng-Li Si et al., Patient satisfaction has the lowest R - C that is consistent with the results of this study (29). The managers of hospitals, in order to improve patient satisfaction, can concentrate on reducing the length of stay, waiting time, hospital infections, surgery cancellation, staff absence, and increasing staff satisfaction rate and their training costs. By improving patient satisfaction, it can be expected that bed occupation factor will increase and discharge by personal satisfaction and complaint rate will reduce (Table 3). Patient satisfaction has become important due to the improvement challenge in the quality of care. Patient satisfaction, therefore, is one of the important indicators (30, 31). Studies performed on patient satisfaction showed that this indicator is related to improvement of health results, health services productivity, positive effect on business indicator related to health, reducing medical services consumption, less malpractice prosecution, and reducing mortality rate (30-33).
Also, the results showed that if hospitals do not have a suitable situation on performance indicators, the ground for increasing patients complain is prepared. On the other hand, the patients’ complain could have a negative effect on the ratio of total income to total expenditure and bed occupation of hospitals (Table 3). However, patient’s complaint showed their weakness in hospital performance, but it is a suitable instrument for improving care quality. Therefore, hospitals can use patients’ complain to improve patients safety and services quality (34-36).
5.2. Learning and Growth Perspective
The results showed that learning and growth perspective has the most powerful effect on another BSC perspective of the studied hospitals. Therefore, this perspective is identified as the main cause factor. Learning and growth is the most necessary base for success in every knowledge-based organization (5). Onuoha believed that clinical environments, especially hospitals are full of experiments for learning. But the lack of a supportive environment will cause learners to be despaired for searching experiments and as a result, loose learning and growth chances (37). Thus, it concludes that managers should pay more attention to their staff learning and growth in order to improve their organizational performance. In this regards, the results of the present study showed that hospital training expenses capita can have effect on 15 other performance indicators (Table 3). One of the learning and growth indicators in this study is staff satisfaction rate indicator. Also, in the study of Sheng-Li Si et al. staff satisfaction identified as one of the hospital KPIs (29). The results showed that staff satisfaction rate has influence on discharge against medical advice, clinical error, and patients’ satisfaction rates. Other studies also showed that staff satisfaction rate has influence on staff attitude towards patients, clinical functions, and patients’ results (38, 39). Also, job burnout, medical error, and malpractice are related to staff satisfaction (38, 40, 41). Therefore, investment for empowering this perspective of hospital performance can improve other perspectives and totally promote hospital performance.
5.3. Internal Processes Perspective
DEMATEL analysis showed that internal processes perspective has the most relation with other BSC perspective and plays a central role (highest R + D). In this study, most of the indicators were related to this perspective (10 indicators). Based on Figure 3, bed occupation indicator has the most relationship with other evaluation indicators of hospital performance. In other words, it plays central indicator role in hospital performance assessments. In the study of Sheng-Li Si et al. in terms of R + D, bed occupation is the third indicator (29). Also, clinical errors indicator with the most grade R - D is the most effective performance indicator. In other words, it can be said that clinical errors as compared to the other indicators have more effect on hospital performance. This result is consistent with the results of Sheng-Li Si et al. study. In their study accidents/ adverse events had the highest R - C (29). Therefore, by concentrating on this indicator, hospital performance can be promoted considerably. Because of this, in the past two decades, medical errors topic is taken into consideration in health systems (42). While medical errors have many reasons including human interactions and systems insufficiency, but concentrating on individuals instead of the system brings about an unsuitable culture for improvement of patients safety (42, 43). The current study results showed that clinical errors are affected both by individual factors (satisfaction rate, displacement, and staff absence) and systemic factors (training costs, bed occupation, and length of stay average and hospital infections). In general, the reasons for medical errors are put into three groups: human factors like the exhaustion, inadequate training and neglect; organizational factors like the policies, structures of the work place, and unsuitable distribution of personnel; and technical factors such as insufficient automation, insufficient instruments, and inefficient equipment (44).
Most of the medical errors may have backgrounds that at first grade are the results of hidden systemic factors. But individual-oriented approaches in contact with medical errors subject have prevented from the previous study of reasons and effective factors on the emergence of medical errors by using the common methods. In fact, the dominant culture of reproach is an important factor for high unacceptable numbers of medical errors (42, 45). According to the complexity of medical errors subject, it is necessary to use a method for its study that could identify reasons and factors deeply and systematically and direct us towards applicable and effective solutions. One of the methods which can help to understand the reasons for medical errors deeply is causal layered analysis (CLA). This method is introduced by Sohail Inayatullah, futurist scientist, which includes four layers (litany, social causes, discourse/worldview, and myth/metaphor) and searches to identify root reasons for a phenomenon such as medical errors (46).
5.4. Financial Perspective
These analyses confirmed that patient’ understandings of services quality are related to the financial activities of hospitals (47). Even in non-profit hospitals with the aim of not obtaining a benefit, they should pay attention to financial indicators. Therefore, managers of hospitals need credible financial indicators in order to determine the current situation and planning for improving their performance (48). The current study also showed that financial perspective of BSC is not the main effect factor or main cause factor and neither plays a central role. The reason for this subject is related to the studied society identity, because the studied hospitals are governmental and their main goal is not profitability. Sheng-Li Si et al. indicated that financial effectiveness is the once important issue in the management perspective of hospital. But, in their study financial measures had the highest value of R + D that was inconsistent with our findings (29). In private hospitals that their aim is to obtain a benefit, financial perspective may be identified as the main cause factor. In the study by Wu performed on banks, financial perspective is the main cause factor (28).
5.5. Conclusion
The study results showed that because of the causal relationship among indicators, assessment and performance improvement of the hospital is a complex and multi-dimensional activity. As a result, customer perspective is the main effect factor and learning and growth perspective is identified as the main cause factor. Also, internal processes perspective has the most relation with other BSC perspective and plays a central role. Therefore, in order to have a powerful assessment system and success in improving hospital performance instead of a single-dimension, attention should be payed to all dimensions of performance. For this purpose, BSC model is so helpful. This study showed that DEMATEL can be helpful in drawing basic relations and recognizing key indicators in the intricate system of hospital performance assessment.

