Introduction
Considering the ongoing changes in the nature of the world᾽s markets during the last two decades and more competitive pressure on companies bearing a great impact on their operations (1,2), the performance management has prompted many organizations to implement new performance measurement and management systems (3) to survive in this new competitive environment. It will become increasingly important for all major businesses to evaluate and modify their performance measures to adapt with rapid changing and high competitive business environment (4). Dealing with the new competitive environment, the scholars suggested some approaches containing dimensions such as comprehensive PM models (3). Designing a good PM model requires its adaptability with related performance indicators (5), which means the PM should be comprehensive to contain all organizational financial and non-financial indicators; internal and external indicators; leading and lagging indicators and short-term and long-term indicators (6). Moreover, the performance management system helps an organization to adopt itself with strategies and stakeholders` needs (7).
Regarding special characteristics of pharmaceutical industry specified as Research and Development (R&D) activities’ intensity (8, 9), the most most profitable industry (10), uncertainty of the product development process (11), the importance of intellectual property protection (12, 13) and lack of reported performance measurement, makes it a particularly interesting setting for this research, which focuses on designing an integrated PM model for the pharmaceutical industry.
Literature review
With respect to its origins in management disciplines, the performance management contains different kinds of activities, including planning and execution of actions needed to ensure that the performance objectives are achieved. In spite of its multidisciplinary, the field of performance management has developed from diverse origins and different measures, and the management techniques and approaches have developed independently (3). The most expressive area of the evolution of performance management, and the area perhaps with the most attention of research is performance measurement (PM), which defined as a process of quantifying the effectiveness and efficiency of actions related to the performance of an organization (5). It includes feedbacks from activities related to the customer᾽s expectations and strategic objectives, which indicate the needs for improvement and development (14, 15). Moreover, PM contains development of strategies or objectives, and the need to take actions in order to improve the performance based on the perspectives offered by the performance measures (16). The main reason for measuring performance is to use its result in organizational decision makings at different levels of organization; strategic, tactical and operational levels (7). In fact, the PM tries to monitor and evaluate how an organization may obtain its defined goals.
Many researchers have focused on how organizations can design more appropriate measurement and management systems (17). Based on the literature, numerous frameworks (7, 18-21) have been developed to be followed by the organizations in order to design and implement different PM systems (22). The objective of such frameworks is to help organizations determining the performance in such a way that can reflect their objectives and appropriately evaluate their performance. This is often done by defining performance indicators, which generally measure the efficiency and effectiveness of an organization (5). Defined indictors should be connected closely to the vision, strategies, goals and objectives (6) to appropriately evaluate the organizational improvement.
PM indicators
Defining specific goals and indicators for organizational performance, which directs activities of an organization, is considered as a main step in designing a PM model. Indicators should be specific, measurable, reachable, robust and documented and must support the organizational mission. Though, we may define many indicators for organization, they should be prioritized based upon their importance. They also should be selected regarding their criticality for the organizational goals. Indicators can be classified in three following categories (23):
• Key Result Indicators (KRIs): determine how an organization performs in a perspective.
• Performance Indicators (PIs): determine what performances should be done.
• Key Performance Indicators (KPIs): determine what an organization should do to increase its performance dramatically.
To describe the relationship between these three performance measures (23), we use an onion analogy (Figure1): “The outside skin describes the overall condition of the onion, the amount of sun, water, and nutrients that it has received; how it has been handled from harvest to supermarket shelf. However, as we peel the layers off the onion, we will find more information. The layers represent the various performance indicators, and the core, the key performance indicators”.
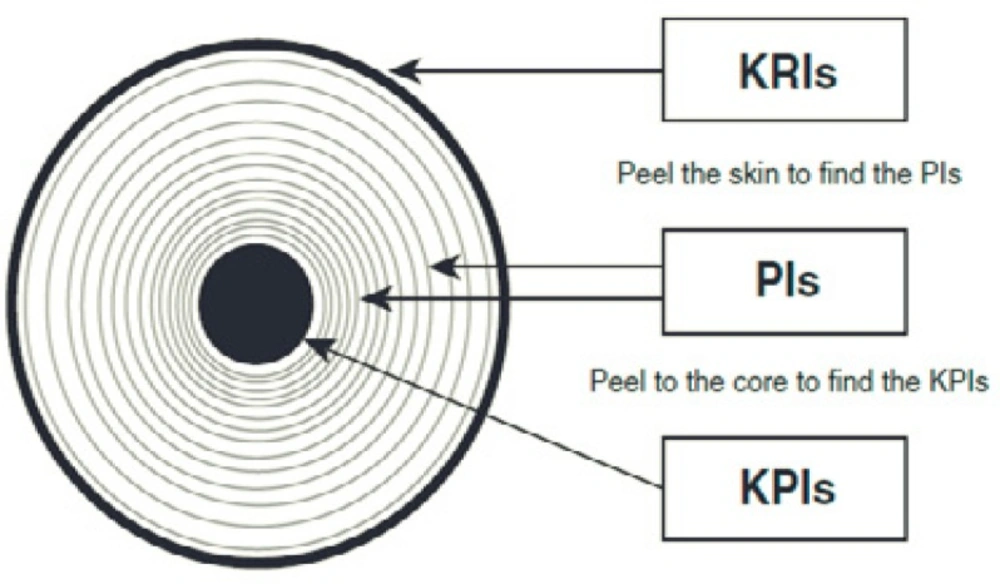
Figure1
Three types of performance measures (23).
To propose an appropriate PM system, the important things to be considered include how to define indicators that can cover all financial and non-financial performances, the relevance of indicators with organizational strategies (24) and also the relevance of these indicators with intentional characteristics of considered industry or company. For this, the use of KPIs and KRIs would be helpful.
Key result indicators (KRIs)
The KRIs shows the results of specific activity and provides a clear picture to show whether you are in a right direction or not. However, they are not helpful in improving these results. The KRIs include customer satisfaction, net profit before tax, profitability of customers, employee satisfaction and return on investment (23). KRIs provides information that is ideal for the boared of director, but not those involved in day-to-day management. Furthermore, KRIs typically covers a longer period of time and review on monthly/quarterly cycles, not on a daily/weekly basis as KPIs do.
Key performance indicators (KPIs)
KPIs provide a set of indicators focusing on those aspects of organizational performance that are the most crucial for the current and future success of the organization (23). Table 1 briefly compares the differences between KPIs and KRIs.
Table 1
Characteristics of KPI and KRI
| KPIs | KRIs |
|---|---|
| Non- financial | Financial and non-financial |
| Useful as a report for CEO | Useful as an executive summary for board of director |
| Conceivable for employees and corrective action can be done | Not suitable for employees and managers for identifying strength and weaknesses |
| It can be define personal responsibilities for indicators | Generally CEO is responsible for indicators |
| Have dramatic effects on performance and a KPI relate with more than one organizational goals | Summarize how much organizational goals achieved and a KRI relates only with one goal |
| KPIs can improve organizational performances | A KRI is the result of number of managed activities in organization |
Conceptual framework of the study
The main reason for measuring performance is to use its output in the organization`s decision making. Conceivably, the main function of PM is to define whether an organization achieves its goals or not (24). There is a hierarchical link between different levels of program in an organization and different levels of goals existing in an organization in respect to time horizon and importance. The main and the most important goal of organization is its mission, which explains the reason of organization`s existence and other goals and objectives defined regarding mission. The indicators can be used to measure how much the short-term and long-term goals have been obtained (Figure 2).
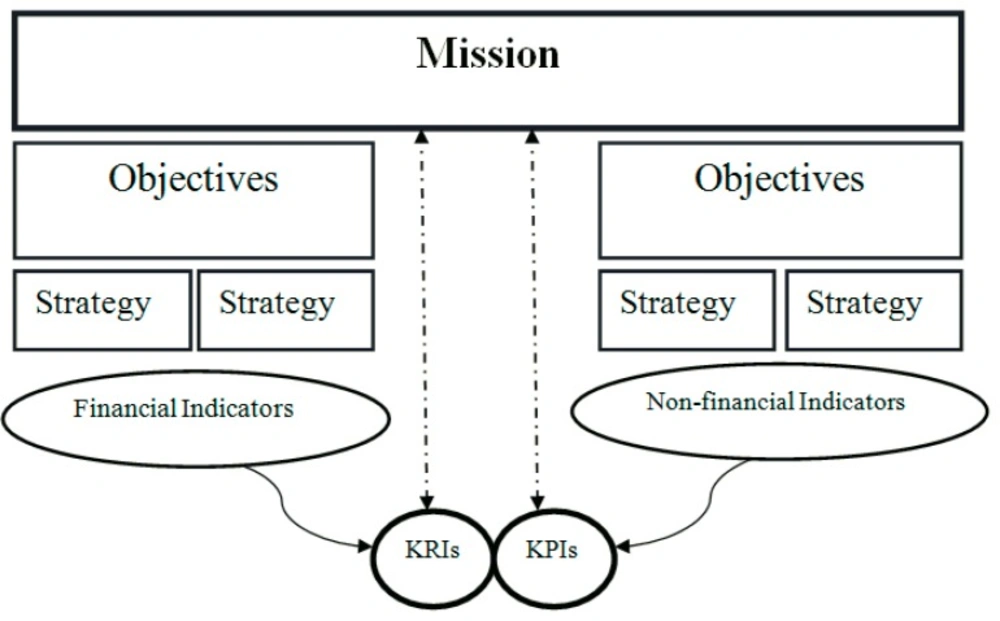
Figure 2
Conceptual framework of the study
Research method
This study was performed as an email survey of pharmaceutical companies in Iran. The samples were selected among 200 experts. Experts are those with manager position for at least 10 years in the pharmaceutical companies. To calculate the number of samples, Cochran formula (25) showed 50 samples and we selected the samples via a random sampling method. The survey respondents had titles such as Senior Manager, Finance Manager, Quality Manager, Manufacturing Manager, R&D Manager, Marketing Manager, Human Resource Manager and Quality Control (QC) Manager. As Table 2 shows, most of the participants have more than 10 years job experience in the pharmaceutical industry (80 percent) and a quarter of the participants were top managers. Accordingly, we chose the respondents from managers who had comprehensive knowledge about company’s process, products and the performance management of pharmaceutical companies. We sent out 50 questionnaires, 25 of them were returned (response rate 50 %).
Table 2
Sample characteristics
| Construct | Classification | Number | Percentage |
|---|---|---|---|
| Field of the work | Senior Manager | 6 | 24 |
| Finance Manager | 2 | 8 | |
| Manufacturing Manager | 5 | 20 | |
| R & D Manager | 4 | 16 | |
| Marketing Manager | 3 | 12 | |
| Human Resource Manager | 1 | 4 | |
| QC Manager | 4 | 16 | |
| Job experience | 6-9 years | 5 | 20 |
| 10-15 years | 10 | 40 | |
| Up 10 years | 10 | 40 | |
| Education | MSc. | 7 | 28 |
| Pharm.D. | 14 | 56 | |
| PhD | 4 | 16 |
A draft questionnaire was compiled based on literature and practical information from the pharmaceutical industry. The draft questionnaire was then pretested with academics and a pharmaceutical industry expert to check its content and face validity, and the questionnaire was modified based on their comments. The modified questionnaire was then piloted to check its suitability and appropriateness for the target population. The questionnaire was piloted by four experts from pharmaceutical industry.
The respondents were asked to quantify according to a 5-point Likert scale. Anonymity was required due to sensitivity issues relating to the pharmaceutical industry. Therefore, the anonymity of the respondents was preserved in this survey. To identify the KPIs and KRIs for pharmaceutical industry based on expert opinions, we tested our hypothesis with t-test and Kendall᾽s W-Test.
H1 = μ < 3 H0 = μ ≥ 3
Results
As Table 3 shows, 25 indicators were identified as KPIs in pharmaceutical context, three of which were rejected because they were not qualified based on the study hypothesis (indicators 28, 29 and 30) and the score of 2 other failed indicators were not statistically significant (indicators 14 and 18).
Table 3
KPIs of Pharmaceutical Company
| No | Formula | Mean | SD | Reference |
|---|---|---|---|---|
| 1 | Number of recalled products in 6 months / Total number of products in 6 months | 5 | 0 | (26) |
| 2 | Number of actual internal audit during last month / Total planned internal audit during last month | 5 | 0 | (26) |
| 3 | Number of on time predictive maintenance orders in 1 month / Total number of predictive in 1 month maintenance orders | 5 | 0 | (27) |
| 4 | Number of available connection channels in 1 month / Number of planned connection channels for customers in 1 month | 5 | 0 | (23, 28) |
| 5 | Number of customer complaints about the quality and delivery of products during last month / Total number of customer complaints during last year | 4.95 | 0.4 | (27, 29) |
| 6 | Average time from production license issue date to delivery / Number of working days | 4.83 | 0.36 | (26) |
| 7 | Average time between production date of permit and receipt for batch stock / Number of working days | 4.79 | 0.63 | (30) |
| 8 | Differences between staff award system and PM system in 3 months / Total value of staff awards in 3 months | 4.45 | 0.34 | (31) |
| 9 | Total hours for production lines failures during last month / Total planned time for production during last month | 4.33 | 0.6 | (27, 33) |
| 10 | Number of lower 70% of supplier satisfaction during 3 months / Total number of suppliers during 3 months | 4.32 | 0.23 | (27) |
| 11 | Total cost of material purchasing procurement for each materials during past six months / Total cost of material purchasing during last year | 4.25 | 0.12 | (23) |
| 12 | Overall equipment effectiveness: Planning rate *Availability rate* Performance rate * Quality rate | 4.23 | 0.36 | (33) |
| 13 | Physical and systemic inventory non-compliance during last 3 months / Total inventory items during last 3 months | 4.2 | 0.14 | (29) |
| 14 | Average time between issue of sale plan and production plan / Number of working days | 4 | 0.37 | (34) |
| 15 | Resolved non-compliance GMP in 3 months / Non-compliance in recent GMP compliance inspections in 3 months | 4 | 0.46 | (26) |
| 16 | Average time between invoice to stock sale`s money in last month / Average time between invoice to stock sale`s money in last year | 4 | 0.24 | (35) |
| 17 | Number of new confirmed sources / Total confirmed sources | 3.97 | 0.12 | (36) |
| 18 | Average raw materials order lead time during past 6 months / Average order lead time during last year | 3.82 | 0.06 | (37, 38) |
| 19 | Average time from purchase order issue and date of confirmation during last month / Average time from purchase order issue and date of confirmation during last year | 3.83 | 0.41 | (38) |
| 20 | Total delay time of material purchasing during last 6 months /T otal delay time of material purchasing during last year | 3.80 | 0.87 | (27) |
| 21 | Number of supplier rejected materials in last month / Number of supplier rejected materials in last year | 3.79 | 0.76 | (38) |
| 22 | Total number of corrective maintenance request in 1 year / Total number of maintenance request in 1 year | 3.71 | 0.65 | (27, 33) |
| 23 | Difference between critical planned and spare parts for 1 month / Total number of critical spare parts for 1 month | 3.64 | 0.69 | (27) |
| 24 | Difference between the time of requested issue and date of confirmation during last month / Difference between the time of requested issue and date of confirmation during last year | 3.46 | 0.32 | (38) |
| 25 | Number of rejected batches during last month / Total number of produced batches during last month | 3.2 | 0.47 | (27) |
| 26 | Hours of training programs per employee for 1 month / Total number of employees | 3.12 | 0.43 | (27) |
| 27 | Total production stopped because of utilities shortage / Total planned time for production | 3.1 | 0.24 | (27) |
| 28 | Actual production time for each product during last month / Total standard production time during last month | 2.83 | 0.89 | (27, 29) |
| 29 | Average rate of projects deviation from schedule time | 2.26 | 1.01 | (39) |
| 30 | Average time between customer query and sale contract / Number of working days | 2.12 | 0.94 | (38) |
As Table 4 shows, 12 indicators were identified as KRIs in pharmaceutical industry, which 1 indicator was rejected because it was not qualified based on hypothesis of the study (indicator 14) and the score of other failed indicator was not statistically significant (indicator 1).
Table 4
KRIs of Pharmaceutical Company
| NO | Formula | Mean | SD | Reference |
|---|---|---|---|---|
| 1 | Value of company`s IT investment during last 6 months / Value of company`s IT investment during current 6 months | 3.78 | 1.2 | (40) |
| 2 | Value of company sale to pharmacies during 3 months / Total value of sales to pharmacies during last 3 months | 5 | 0 | (23) |
| 3 | Value of net profit during last 3 months / Value of investment during last 3 months | 5 | 0 | (41) |
| 4 | Current Ratio: Current assets / Current liabilities | 5 | 0 | (42) |
| 5 | Current credit during last month / Total purchasing during last month | 4.60 | 0.18 | (42) |
| 6 | Total cost reduction of raw materials by changing products formulation / Total cost reduction of raw materials | 4.12 | 0.23 | (23) |
| 7 | Value of accounting profit during last month / Total value of company sales during last month | 4.12 | 0.34 | (43, 44) |
| 8 | Value of exported pharma products during last three months /T otal value of pharma products exported during 3 months | 4 | 0.53 | (30) |
| 9 | Value of sales during last 3 month / Value of inventories at stock during last 3 month | 4 | 0.41 | (27, 37) |
| 10 | Current debt / Sales (value) | 3.90 | 0.46 | (42) |
| 11 | Value of new products’ profit for 3 months / Value of total products profit | 3.67 | 0.35 | (44) |
| 12 | Total value of wasted materials for 1 month / Total value of materials for 1 month | 3.5 | 0.32 | (27, 29) |
| 13 | Value of company sale at internal pharma market during last 3 months / Total sale at internal pharma market during last 3 month s | 3 | 0.34 | (30) |
| 14 | Value of canceled invoice to customer during last 3 months / Value of company total sale during 3 months | 2.5 | 0.97 | (38) |
PM model of study
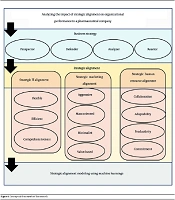
Finally, the proposed PM model of the study was presented in Figure 2 From structural framework perspective (3), this PM model, covers both the performance and the result measures of an organization, and also from procedural framework perspective, this model is based on Wisner and Fawcett nine steps model (45). As showed in Figure 2 based on the PM model proposed by this study for measuring the organizational performance, 25 KPIs and 12 KRIs should be considered and each indicator has an equal weight for measuring KPIs and KRIs and for measuring the organizational performance following formula extracted from the proposed model:
Discussion
Designing PM models is all about deciding on what measures should be selected, and importantly, which measures to be ignored. Due to budgetary constraints, the organizations should select the indicators that are critical for organizational success. In this study, we tried to define a number of limited measures in order to give clarity to what the organization is trying to achieve as well as the indicators preferred to be measured. However, some PM models try to do so (6), in this study, we selected the KPIs and KRIs which are crucial to assure the organizations achieving their key objectives and strategies and tracking their improvements on a single sheet of a paper. Based on the experts᾽ opinion, we identified the key indicators that have the most effects on the organizational performance. This help us to pay more attention to indicators with the maximum contribution in adding strategic value and thereby, to simplify the PM model regarding the number of key measures contributing to measure the performances. Moreover, with introducing KPIs, we propose the non-financial indicators, which are always missed in measuring the organizational performance.
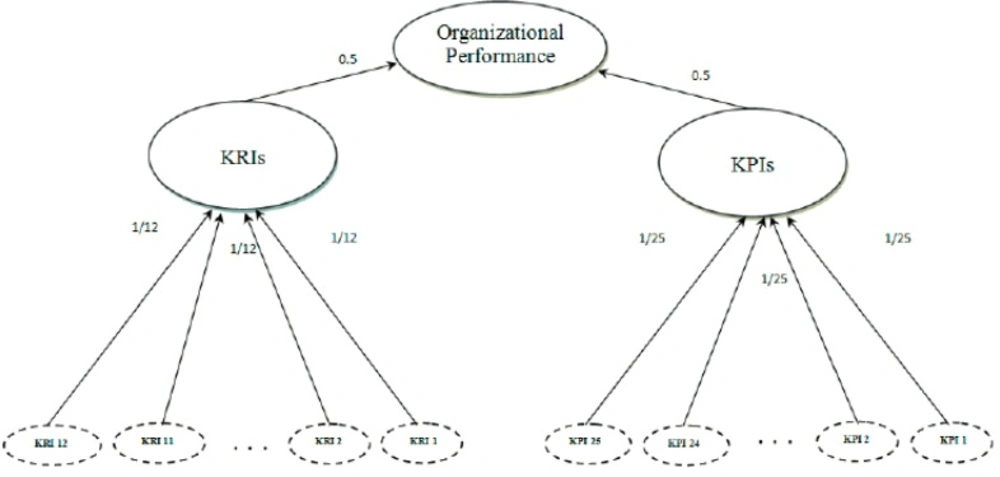
Figure 3
Integrated PM Model of the study
Limitation and implication
The study has some limitations. While this survey covered only the pharmaceutical companies in Iran, the results might be slightly different from global point of view. It would be interesting to compare the results with the results of pharmaceutical industry in other countries. Moreover, the model proposed in this study did not specify the existence of a causal relationship between different perspectives of measurement; e.g. between performance and result measurements, and also may not reflect the needs and demands of all the stakeholders of a company.
However, this study presents important information about the less published KPIs and KRIs in pharmaceutical industry. Companies can thus utilize this information to implement and develop their own indicators in the future. Moreover, this model helps the managers to consider not just the result, but also the performances of their organization, and in this way, they may help them to take decision about priorities and objectives for individual activities and processes to better manage their organization.
Conclusion
In this study, we proposed an integrated PM model for a typical pharmaceutical company. To propose such a model, we used both the relevant literature and the experts’ opinions. Distinct characteristic of this model includes measurement of preferred and concise crucial performance indicators, known as KPIs and KRIs for pharmaceutical industry. Though, this model is more appropriate for measuring the performances of pharmaceutical companies, it can also be useful for measuring the performances of other industries with some modification. We strongly recommend pharmaceutical managers to link these indicators with their payment and reward systems, which will dramatically affect the performance of employees, and consequently their organization`s success.