
1. Background
The high prevalence of hepatitis necessitates extensive research into the vulnerable factors contributing to such diseases. Genetic susceptibility is considered a therapeutic approach for these diseases (1). Several pathways are involved in the pathogenesis of viral hepatitis, and the alpha-1 antitrypsin (A1AT) gene is one of the candidate genes that may play a role in the development of the disease (2). The gene is located on the q arm of chromosome 14 at 14q32.1. It has seven exons and six introns. Mutations in this gene cause A1AT protein deficiency (3). A1AT is mainly synthesized by liver cells and mononuclear cells and is rapidly released into the plasma (4). Alpha-1 antitrypsin deficiency (A1ATD) is a hereditary disease that leads to chronic lung and liver diseases and can cause various levels of liver diseases, from asymptomatic transaminase increase to chronic liver disease, cirrhosis, and liver failure (5). The A1AT is a polymorphic glycoprotein with 394 amino acids and a molecular weight of 52 kDa, consisting of 3 β sheets, nine α helices, and a reactive-center loop. Point mutations and environmental factors can interact with the structure formation and conformation of proteins, taking them out of their natural state; therefore, the synthesized protein in the endoplasmic reticulum cannot be secreted into the cell (6, 7). The A1AT proteins, known as serine protease inhibitors (Pis), are involved in the coagulation and complement systems. Their primary function is to inhibit proteases such as elastase, collagenase, and trypsin. The A1AT, coded by the Pi locus, is a key player in this process.
This locus has many polymorphic positions, leading to the formation of different A1AT isoenzymes. The various polymorphisms within this gene can give rise to distinct protein variants (1, 2). The A1AT has significant genetic variability; at least 100 normal and defective alleles have been reported (8). The M allele is the most frequent allele of the gene in different populations and is divided into several subgroups. S (PiS) and Z (PiZ) are two common mutated forms of the gene. These mutations, involving the conversion of adenine to thymine in exon three at S and guanine to adenine in exon 5 at Z, have significant implications for genetic research. The 264th glutamate amino acid is converted to valine (Glu264 GAA/GTA Val) at S, and at Z, glutamate 342 is replaced with lysine (Glu342 GAG/AAG Lys) (9). The A1AT level in a healthy individual is approximately 3.1 milligrams per cubic centimeter. Both environmental and genetic factors can affect the plasma concentration of A1AT (10, 11). Carriers of different A1AT alleles may have different plasma concentrations, which are reported as a percentage of the normal allele. In the two more common protein alleles, S and Z, the A1AT level is 60% and 15% of the average A1AT level, respectively. This polymorphism has been associated with a possible increase in the risk of chronic liver diseases. In individuals with a ZZ homozygote genotype, the A1AT level is decreased. However, in MZ heterozygote individuals, the A1AT level is 60% of the level in healthy humans, providing a protective effect against liver diseases. The A1AT level in individuals with an SS genotype also decreases (11).
The Pi deficiency, which is caused by the presence of the PiZ homozygote, is one of the most common genetic disorders among Europeans and is associated with an increased risk of liver diseases in children and the onset of pulmonary emphysema in adults (12). Nowadays, studies on the relationship between the possible developments of hepatitis in patients with A1ATD are on the rise (13). The scope of this research is to study the genotypes and allele frequency of the A1AT gene in patients suffering from hepatitis C compared to healthy individuals to determine if there is an association between this polymorphism and hepatitis C virus (HCV) in our population (14). Despite numerous studies proving that several factors contribute to HCV infection, little attention has been paid to SERPINA1 gene polymorphisms, especially PiS (Glu264Val) and PiZ (Glu342Lys), as potential genetic risk factors. It has mainly been investigated whether they play a role in viral susceptibility rather than whether they are associated with liver cirrhosis and hepatocellular carcinoma.
2. Objectives
This study aimed to determine the prevalence of these two polymorphisms in patients with HCV infection from the northeastern Iranian population. Using HCV genotypes to gain new insight into its genetics, this study compares S and Z variants between patients and controls. A novel approach involves integrating host genetic variability with known environmental risk factors to improve individual susceptibility to viral hepatitis, screening strategies, and personalized approaches.
3. Methods
3.1. Study Population
After approval by the ethics committee of the Mashhad University of Medical Sciences and obtaining written consent, blood samples from patients with hepatitis C and healthy individuals were collected at the liver clinic at Qaem Hospital. Participants were divided into two groups: Patients and controls. Using an ELISA kit (Delaware Biotech, USA), patients with hepatitis B were excluded from the study. Each group consisted of 68 cases. In the study group, there were eight females and 60 males; in the control group, there were 39 females and 29 males (Table 1).
Table 1.
Demographic and Risk Factors Feature in Hepatitis C Virus Patients and Healthy Groups a
| Characteristics | Patients | Controls | P-Value |
|---|---|---|---|
| M: F | 60:8 | 29:39 | < 0.05 |
| Age (y) | 41.76 ± 10.61 | 37.39 ± 12.77 | < 0.05 |
| Addiction | 32 (47.05) | - | < 0.05 |
| Alcohol | 28 (41.17) | 2 (2.94) | < 0.05 |
| Transfusion | 31 (45.58) | 9 (13.23) | < 0.05 |
| Tattoo | 24 (35.29) | - | < 0.05 |
| ALT (U/L) | 38.60 ± 37.21 | 26.27 ± 21.63 | 0.1 |
| Increased ALT | 20 (29.41) | 11 (16.17) | < 0.05 |
Abbreviation: ALT, alanine aminotransferase.
a Values are expressed as mean ± SD or No. (%).
3.2. Biochemical Assay
Alanine aminotransferase (ALT) was measured using a commercial kit (Pars Azmoon, Iran). According to the manufacturer's instructions, the criterion for normal levels was considered less than 31 U/L for women and less than 41 U/L for men.
3.3. DNA Extraction
DNA was extracted from 200 μL of whole blood using a DNA extraction kit (Genet Bio, Korea).
3.4. Genetic Analysis
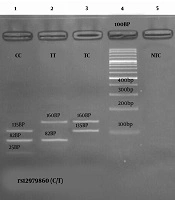
Genetic analysis of A1AT was conducted using the RFLP-PCR method. Two primers were used for the positions mentioned in the S and Z alleles (15). For the S mutant position, the forward primer 5′-AGGGGAAACTACAGCACCTCG-3′ and the reverse 5′-TGGGTACTGTTCTCCTCATCGAGCATG-3′ were used; for the Z mutant position, the forward primer 5′-GGCTGTGCTGACCATCGTC-3′ and the reverse 5′-AACTCTTCTTTA1ATGTCA1ATCGAGG-3′ were used. The PCR reaction samples were then placed in the PCR thermocycler (ABI, USA) in volumes of 30 ΜL containing 10 ng of DNA, 1X PCR buffer, 2.5 mM MgCl2, 200 μM dNTPs, and 0.5 U Taq DNA polymerase enzyme, with the primer concentration at 10 pmol. The PCR program for the S position of the A1AT gene was performed as follows: Denaturation for 5 minutes at 95°C, followed by 38 cycles (45 seconds at 95°C, 45 seconds at 53°C, and 30 seconds at 72°C), and a final step of 5 minutes at 72°C. The routine was the same for the Z position except for the extension temperature (Tm = 55°C). The length of the PCR products of the S and Z alleles was 285 bp and 250 bp, respectively. PCR products were then digested using the TaqI restriction enzyme (Fermentase, Germany). The length of fragments obtained from the digestion of both positions was 264 bp in the mutated form and 245 bp in the type S allele. The Z allele produces 209 bp fragments in the normal state (M) and 227 bp fragments in the mutated form. All fragments were visualized using 3% agarose gel. Genotype frequencies were tested for Hardy-Weinberg equilibrium for the A1AT gene.
3.5. Statistical Analysis
All statistical analyses were performed using SPSS software version 20 (SPSS_IBM). The significance level of the P-value was less than 0.05. Genotype and allele distribution frequencies were measured using the chi-square test.
4. Results
4.1. Demographics
The evaluation showed that 11.76% and 88.23% of patients under study were female and male, respectively. In the control group, 57.35% were female and 42.64% were male. The patients’ age range was 16 to 64, and this range was 15 to 65 in the control group. The average age of patients and the control group was 41.76 ± 10.61 and 37.39 ± 12.77, respectively. Table 2 shows the genetic and allelic frequencies of this gene. Among patients, 48 had normal ALT levels compared to 57 individuals with normal ALT in the control group.
Table 2.
Distribution of Genotypes Frequency of Alpha-1 Antitrypsin Gene Polymorphisms
| Variables | Control (N = 68) N (%) | Patients (N = 68) N (%) | P-Value Crude | Or Crude (95% C.I.) | P Value Adjusted* | Or Adjusted* (95% CI) |
|---|---|---|---|---|---|---|
| A1AT locus | ||||||
| MM | 49 (75.56) | 49 (76.56) | Ref | Ref | Ref | Ref |
| MS | 0 | 0 | - | - | - | - |
| SS | 3 (5.77) | 15 (23.44) | ||||
| MM | 49 (75.56) | 49 (76.56) | 0.0153 | 0.2 (0.05 - 0.7) | 0.0153 | 5 (1.36 - 18.37) |
| MS + SS | 3 (5.77) | 15 (23.44) | ||||
| Allele frequency | ||||||
| M | 98 (76.56) | 98 (76.56) | 0.0006 | 0.2 (0.08 - 0.5) | 0.0006 | 5 (1.99 - 12.55) |
| S | 6 (5.77) | 30 (23.44) | ||||
| A1AT locus | ||||||
| MM | 59 (100) | 53 (80.30) | Ref | Ref | Ref | Ref |
| MZ | 0 | 0 | - | - | - | - |
| ZZ | 0 | 13 (19.70) | - | - | - | - |
| MM | 59 (100) | 53 (80.30) | - | - | - | - |
| MZ + ZZ | 0 | 13 (19.70) | - | - | - | - |
| Allele frequency | ||||||
| M | 118 (100) | 106 (80.30) | - | - | - | - |
| Z | 0 | 26 (19.70) | - | - | - | - |
Abbreviation: A1AT, alpha-1 antitrypsin.
4.2. Polymorphism Analysis
The S and Z variants of A1AT also had higher frequencies in patients than in the control group; this difference is significant. Six patients (5.77%) in the control group and 30 patients (23.44%) in the patient group had the S variant. This difference remained significant after adjustment for confounders (addiction, alcohol, transfusion, tattoo) (adjusted P = 0.00006; OR = 5, 95% CI = 1.99 - 12.55). Moreover, the frequency of the Z variant in patients is higher than in the control group. This difference also remained significant after adjustment for confounders (adjusted P = 0.00006; OR = 5, 95% CI = 1.99 - 12.55).
4.3. Hepatitis C Virus Genotyping
All patients were negative for HIV. However, other risk factors were present in our patients as follows: Forty-seven percent addiction, 41% alcohol consumption, 31% transfusion, and 24% tattooing. In the control group, only 2% had alcohol consumption and 9% had tattooing. In both groups, there was a significant difference in terms of addiction, alcohol consumption, tattooing, and transfusion (P < 0.05), as shown in Table 1. About 60% of patients had an HCV genotype analysis, which included 3a: 53.02%, 1a: 15.41%, and 1a/1b: 33.34%. Figure 1 shows the relationship between genotypes of the HCV and some of the risk factors.
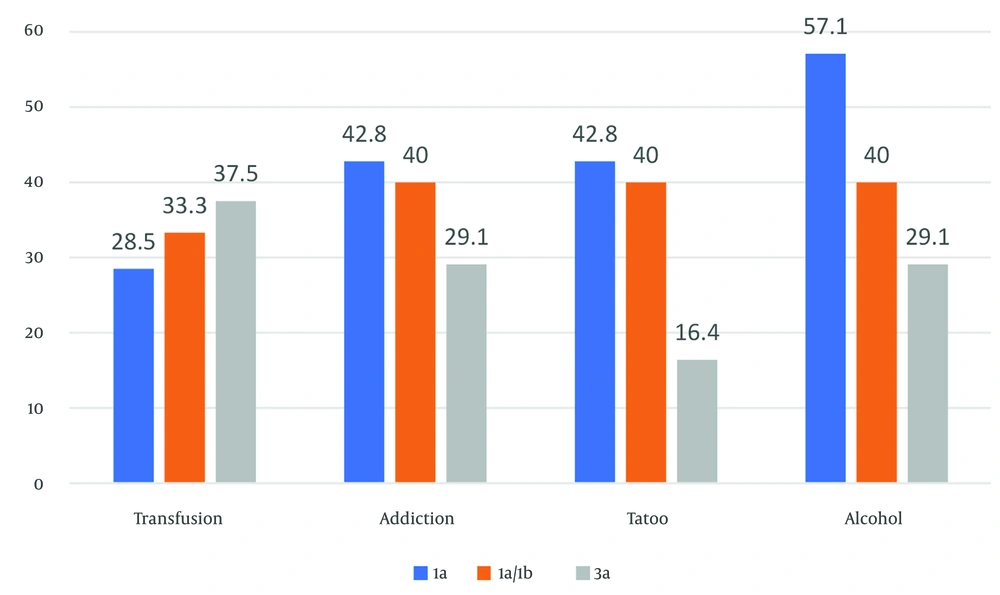
Figure 1.
The relationship between risk factors and hepatitis C virus (HCV) genotypes
4.4. Alanine Aminotransferase Analysis
The results of a biochemical test of ALT analysis indicated that about 48 patients and 57 healthy individuals were in the normal range of the ALT enzyme. It was found that the mean ALT level in the patient group was higher than that in the control group (26.27 ± 21.63 U/L); however, this difference did not represent a statistically significant difference, indicating that elevated ALT levels in this sample did not consistently correlate with hepatitis C status (Table 1).
5. Discussion
The A1AT is a protein produced by the liver and then secreted into the blood. This protein inactivates many enzymes in the bloodstream, but its primary function is to protect the lungs against the elastase enzyme. The decrease of A1AT and increased elastase functionality lead to high activity of this enzyme and the destruction of lung tissue proteins. In addition, in the case of A1AT dysfunction, this protein will accumulate in the liver cells and cause damage and the development of resistant hepatitis, especially in infants, in a way that a proportion of the patients will require liver transplants to continue their lives (3).
Researchers investigated the association between two common SERPINA1 polymorphisms, PiS (Glu264Val) and PiZ (Glu342Lys), and the risk of HCV infection in a select group of people. The S and Z variants were significantly different between HCV patients and the control group (P < 0.05). The S allele was present in 23.44% of the HCV group but only 5.77% of the control group. The difference was significant even after adjusting for possible confounders. There is an essential relationship between several known risk factors for HCV and our patients' prevalence. These factors included alcohol consumption (41.17%), intravenous drug use (47.05%), blood transfusion history (45.58%), and tattooing (35.29%). It has become apparent that genetic factors may interact with environmental factors contributing to HCV susceptibility. This highlights the need for a comprehensive understanding of the disease (9, 16, 17). The higher prevalence of SS and ZZ genotypes in HCV patients, which may reflect a potential genetic predisposition due to impaired A1AT function, is a significant finding (18). It is hypothesized that misfolded A1AT protein, resulting from PiS and PiZ mutations, may lead to hepatocellular stress and inflammation, thereby facilitating viral persistence or liver injury. However, the precise molecular mechanisms by which A1AT deficiency may increase HCV susceptibility remain to be elucidated. It remains unclear how A1AT deficiency links to HCV infection, despite numerous studies linking A1AT deficiency to liver diseases like cirrhosis and hepatocellular carcinoma. Therefore, further multicenter studies are needed to validate these associations and investigate their underlying pathophysiological mechanisms. Research should also focus on the use of A1AT-targeted therapies to modify the progression of diseases in individuals with genetic predispositions.
A survey was carried out on the relationship between the frequencies of the variant of this gene. The prevalence of hepatitis B indicated that 5.45% were ZZ homozygotes, confirming the fact that the prevalence of viral hepatitis is higher in people with some degree of defects in A1AT. In comparison, 19% of patients with hepatitis C were ZZ homozygotes in this study (16). Furthermore, according to a survey of patients with cirrhosis of the liver, 16% of them had defects in A1AT, among whom 40% were infected with hepatitis C. They found that viral hepatitis increases the risk of progression in these individuals' liver diseases. They also found that the prevalence of hepatitis in individuals with A1ATD is higher than in normal individuals.
Studies conducted on the structure of A1AT revealed that in the Z form of this protein, due to mutation, the amino acid glutamate is replaced by lysine at position 342. This replacement causes a misfolding in the A1AT structure, leading to polymer formation in the endoplasmic reticulum of hepatocytes. As a result of the formation of this polymer, the necessary changes for the secretion of A1AT do not occur in the endoplasmic reticulum; therefore, this form of protein remains in the endoplasmic reticulum of hepatocytes, resulting in subsequent damage (9, 17, 18).
In the present study, results demonstrated that the frequency of ZZ and SS variants in patients with hepatitis C is higher than that of the control group, and this difference is significant. In our study, the frequency of heterozygote variants (MS, MZ) in patients and the control group was zero. However, Settin et al. (19) reported frequencies of 31.3% and 7.14% in Egyptian HCV patients with liver cirrhosis and 2.1% and 4.28% in the control group for MS and MZ variants, respectively. The zero frequency of these genotypes in our study could be due to the number of participants, but it seems the frequency of these genotypes in our population is low. The results of the risk factors analysis also illustrated that the frequency of alcohol consumption (41.17%), addiction (47.05%), transfusion (45.58%), and tattooing (35.29%) was significantly higher in patients with hepatitis C, where we adjusted the results of our genotype and allele frequency comparison for these confounders. PiS and PiZ alleles are strongly associated with an increased prevalence of genetically compromised hepatoprotective responses, perhaps due to deficient A1AT. As a result of the impaired protection, hepatocytes may become more susceptible to viral cytotoxicity, immune-mediated damage, or chronic inflammation, all of which can contribute to liver disease progression in HCV infections (20). Also, SERPINA1 variants may be useful in stratifying at-risk populations based on genetic markers of predisposition. Identifying individuals at greater risk for HCV infection or severe outcomes could be accomplished through screening those with known risk factors. As a result, preventive strategies can be informed, and clinical monitoring could be intensified, potentially reducing death rates and healthcare costs.
Patients with both HCV infection and A1AT deficiency may require more tailored treatment approaches. Personalized approaches may lead to better outcomes, providing hope and optimism. Future clinical trials should include closer surveillance for fibrosis, hepatocellular carcinoma, or adjunctive anti-inflammatory or A1AT replacement therapies. Finally, the findings raise important questions about the interaction between host genetics and viral pathogenesis, supporting a precision medicine framework in infectious liver diseases. This promising approach could revolutionize the treatment of HCV, inspiring excitement and anticipation for the future. Further mechanistic studies are needed to explore whether A1AT variants directly influence viral replication, immune evasion, or treatment response in HCV-infected individuals. This call to action sparks the audience's curiosity and interest. However, to confirm such an effect, we may need a larger sample size and replication of this study in other populations.