
1. Background
The liver is an important organ of the human body and has the greatest ability to eliminate harmful toxins and produce useful substances necessary for its function. Liver cirrhosis is considered the terminal stage of liver failure and can lead to liver dysfunction, metabolic abnormalities, and death. Early diagnosis of liver fibrosis holds significant clinical importance. Liver puncture is an invasive examination that cannot be dynamically observed and may not be accepted by most patients. The specificity of serological diagnosis is relatively low. The Fibrotouch non-invasive liver fibrosis diagnosis system is limited by various factors, including obesity, or may be affected by inflammatory activities. Traditional B-ultrasound for portal hypertension cannot perform early liver fibrosis quantitative evaluation. Therefore, actively exploring non-invasive diagnostic methods that are easily acceptable to patients is a key issue. Traditional Chinese Medicine (TCM) holds that the liver opens the orifice in the eye. Hypermetabolism in the retina is supported by a well-organized vasculature to obtain binocular visual function. Dysregulated angiogenesis disrupts the transport of oxygen and nutrients, leading to an unbalanced metabolic supply and abnormal retinal function (1). The reproducibility of non-invasive optical coherence tomography angiography (OCTA) has been demonstrated in macular microvascular perfusion measurements. The OCTA can quantify retinal blood flow in patients, and evidence from previous studies demonstrated high myopic retinal microvascular abnormalities (1). Retinal microvasculature reflects the condition of systemic blood vessels, making it significant to explore the retinal changes in patients with hepatitis B cirrhosis.
2. Objectives
In this study, the changes in fundus capillaries and microstructure in patients with different stages of hepatitis B were examined to study the relationship between fundus blood flow and the stage diagnosis of hepatitis B cirrhosis. The aim was to explore the application of non-invasive eye examinations in the stage diagnosis of hepatitis B cirrhosis.
3. Methods
All subjects provided their informed consent forms. This study was approved by the Ethics Committee of the Affiliated Hospital of Shao Xing University. All recruitment and procedures adhered strictly to the principles of the Declaration of Helsinki.
3.1. Study Subjects
Patients aged 63 - 75 years with hepatitis B cirrhosis who presented to the ophthalmology department of our hospital from January 2024 to June 2024 were included in the study. The participants were clinically staged into the following two groups: Compensatory period group and decompensated period group.
3.1.1. Inclusion Criteria
(1) Patients met the diagnostic criteria for cirrhosis in the Guidelines for Prevention and Treatment of Chronic Hepatitis B.
(2) Hepatitis B infection.
(3) Evidence of histological or clinical cirrhosis.
(4) Confirmed liver hardening by imaging.
3.1.2. Exclusion Criteria
(1) Liver cirrhosis resulting from other causes.
(2) The image quality of the OCTA scan was < 7/10.
3.2. Ophthalmic Examination
All participants underwent comprehensive clinical ophthalmic examinations by an ophthalmologist, including best-corrected visual acuity (BCVA), refractive status, slit-lamp biomicroscopy, fundoscopy, and intraocular pressure (IOP) measurements using a fully automated tonometer TX-20P (Canon). All patients were examined by a professional technician using OCTA (TOPI-SIGMA 1000, TuPai), and the subject's information was kept confidential from the technician. In vascular retinal mode, the device underwent 12 mm × 12 mm OCTA acquisition centered on the fovea. ETDRS segment optical coherence tomography (OCT) scans and measures images of the region of interest. Additionally, the image can be divided into three circles with different diameters, measured in the following three areas: (1) The foveal region is defined as the fovea diameter of 1mm; (2) the perifovea area is 3 - 6 mm; and (3) the parafoveal region is between the fovea and the perifoveal region. The parafoveal and perifoveal regions are further divided into four quadrants, namely temporal, superior, nasal, and inferior (2-4). Finally, the retinal flow zone (FAZ) area, retinal blood flow without perfusion area, and flat choroidal capillaries were analyzed. Images of each layer with mean density were used to determine differences between the two groups. To ensure the accuracy of the study, those with image quality < 7/10 were eliminated.
3.3. Statistical Analysis
Statistical analysis was conducted using SPSS software (version 23.0; SPSS Corporation, Chicago, Illinois, USA).
(1) Qualitative variables are presented as numbers. Quantitative variables were presented as the mean value and the standard deviation.
(2) Qualitative variables were determined using the chi-square test.
(3) Differences in fundus blood flow between the two groups were analyzed using one-way ANOVA.
(4) Only eligible data were used in the final analysis.
(5) P-values of < 0.05 were considered statistically significant.
4. Results
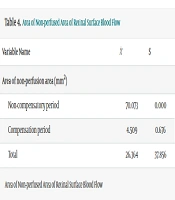
A total of 20 participants (40 eyes) took part in the analysis. The mean age of all eligible subjects was 69.00 ± 6.00 years, and there was no significant difference in age, sex, IOP, or refraction between the two groups (P > 0.05). The mean values of the compensated and decompensated cirrhosis in the FAZ area (mm2) of the superficial retina were 1.75/0.05, and the P-value of ANOVA results was 0.001, indicating that the statistical results showed significant differences in the FAZ area (mm2) (Table 1). There are differences between the compensatory period and the decompensated period of hepatitis B-related cirrhosis. The mean value of the FAZ area (mm2) was 0.71/0.075 respectively, and the P-value of the ANOVA result was 0.061, indicating that the statistical results were not significant, suggesting that different stages had no significant difference in the FAZ area (mm2) (Table 2). The mean values of the compensated and decompensation periods in the FAZ retinal area (mm2) were 1.6/0.063 respectively, and the P-value of the ANOVA result was 0.01, indicating that the statistical results were significant, suggesting that different stages showed significant differences in the FAZ area (mm2) (Table 3). The mean value of the compensated and decompensated periods of hepatitis B cirrhosis in the area (mm2) of the superficial retina was 70.073/4.509, respectively, and the P-value of ANOVA was 0.008. Thus, the statistical results were significant, indicating that different stages showed significant differences in the area (mm2) of the superficial retina (Table 4). The mean value of the compensated and decompensated periods of hepatitis B cirrhosis in the area (mm2) of the deep retina was 81.133/10.083, respectively, and the P-value of analysis of variance was 0.033. Therefore, the statistical results were significant, indicating that different stages showed significant differences in the deep retinal area (mm2) (Table 5). The mean value of the compensatory and decompensation periods of hepatitis B cirrhosis in the nonperfusion area (mm2) of the whole layer retina was 63.175/4.777, and the P-value of the ANOVA result was 0.003. Thus, the statistical results were significant, indicating that different stages have significant differences in the area (mm2) of the whole layer retina (Table 6). The mean value of the mean choroid capillary density between the compensated and decompensated periods of hepatitis B cirrhosis was 32.0/47.5, respectively, and the P-value of ANOVA results was 0.036. Therefore, the statistical results were significant, indicating significant differences in the mean choroidal capillary density between the different stages (Table 7).
Table 1.
Flow Zone Area of Superficial Retinal Blood Flow
| Variable Name | S | Variance Test | |
|---|---|---|---|
| Area of no flow area (mm2) | |||
| Non-compensatory period | 1.75 | 0.000 | F = 1149386.991, P = 0.001 |
| Compensation period | 0.05 | 0.001 | |
| Total | 0.617 | 0.982 | - |
Table 2.
The Flow Zone Area of Deep Retinal Blood Flow
| Variable Name | S | Variance Test | |
|---|---|---|---|
| Area of no flow area (mm2) | |||
| Non-compensatory period | 0.71 | 0.000 | F = 108.404, P = 0.061 |
| Compensation period | 0.075 | 0.05 | |
| Total | 0.287 | 0.368 | - |
Table 3.
The Flow Zone Area of Full-Thickness Retinal Blood Flow
| Variable Name | S | Variance Test | |
|---|---|---|---|
| Area of no flow area (mm2) | |||
| Non-compensatory period | 1.6 | 0.000 | F = 4066.992, P = 0.01 |
| Compensation period | 0.063 | 0.02 | |
| Total | 0.575 | 0.888 | - |
Table 4.
Area of Non-perfused Area of Retinal Surface Blood Flow
| Variable Name | S | Variance Test | |
|---|---|---|---|
| Area of non-perfusion area (mm2) | |||
| Non-compensatory period | 70.073 | 0.000 | F = 6271.246, P = 0.008 |
| Compensation period | 4.509 | 0.676 | |
| Total | 26.364 | 37.856 | - |
Table 5.
Area of Non-perfusion Area of Deep Retinal Blood Flow
| Variable Name | S | Variance Test | |
|---|---|---|---|
| Area of non-perfusion area (mm2) | |||
| Non-compensatory period | 81.133 | 0.000 | F = 362.337, P = 0.033 |
| Compensation period | 10.083 | 3.048 | |
| Total | 33.766 | 41.077 | - |
Table 6.
Area of the Non-perfusion Zone of Full-Thickness Retinal Flow
| Variable Name | S | Variance Test | |
|---|---|---|---|
| Area of non-perfusion area (mm2) | |||
| Non-compensatory period | 63.175 | 0.000 | F = 51203.796, P = 0.003 |
| Compensation period | 4.777 | 0.211 | |
| Total | 24.243 | 33.716 | - |
Table 7.
Mean Choroidal Capillary Density
| Variable Name | S | Variance Test | |
|---|---|---|---|
| Mean choroidal capillary density | |||
| Non-compensatory period | 32 | 0.000 | F = 320.333, P = 0.036 |
| Compensation period | 47.5 | 0.707 | |
| Total | 42.333 | 8.963 | - |
5. Discussion
Hemodynamic changes in a range of extrahepatic vascular beds have been demonstrated using modern vascular imaging techniques. However, although the macrocirculation is widely described in liver cirrhosis, the microcirculation has been relatively poorly studied. Emerging data suggest that, as in patients with severe sepsis, dysregulated systemic inflammation and altered microcirculation in different cirrhosis phenotypes may be associated with adverse clinical outcomes and be interrelated. Thus, evaluation of the microcirculation may play a potentially critical role in understanding the complex pathophysiology of individual patients, monitoring therapeutic interventions, and predicting the prognosis of different clinical states of cirrhosis (5). Although techniques for monitoring microcirculation have not been widely available in clinical applications, several methods have recently become available (6-8). It has been demonstrated that with the progression of the disease, patients with cirrhosis experience significant hemodynamic changes throughout the body, except in the hyperdynamic circulation in the portal system. "Liver opens the orifice in the eye" is an important concept in the theory of zang-fu organs in TCM. It posits that "the eye is the essence of the five viscera and the viscera." In clinical practice, the theoretical basis and diagnosis and treatment system of TCM syndrome differentiation and disease differentiation of "liver disease, eye" and "eye disease and liver" have been continuously improved and formed. The retina and choroid are important components of the blood supply to the eyeball, and their blood supply comes from peripheral terminal vessels. The retinal vasculature is an established noninvasive indicator of systemic microvascular health.
The OCTA is a technology that enhances flow detection based on OCT by improving the noise ratio, providing stratified display of the longitudinal section segmentation technology of the fundus microvascular structure, and allowing quantitative analysis of various parameters. It features rapid imaging technology and outputs high-resolution images similar to angiography after software processing. The biggest advantage of OCTA is its ability to output vascular structure imaging based on OCT, enabling en-face scan layered display of vascular structures, which was not possible with previous OCT examinations. It also allows for 3D display of microvascular structures. The OCTA can use software to output image segmentation, comparison, and calculate the quantitative results of the image parameters. This allows for the exploration of the fundus network image characteristics of membrane microvessels in patients with cirrhosis. The size of each parameter value can be analyzed and compared using statistical methods to identify links and subtle changes between them, which can aid in the early diagnosis of cirrhosis, disease staging, intervention, treatment, and follow-up. The OCTA can improve work efficiency through software upgrades of its system, providing high-resolution images of the cirrhosis fundus retina in a short time and delivering clinically needed parameters through image analysis. In the context of hepatitis B cirrhosis, the application of OCTA could potentially help clinicians detect early microvascular changes in the eye, which may reflect the systemic hemodynamic alterations associated with liver disease. This could lead to earlier diagnosis and more accurate staging of cirrhosis, ultimately improving patient management and prognosis. Moreover, OCTA may serve as a monitoring tool to assess the effectiveness of treatment over time, offering a new perspective for the comprehensive evaluation of patients with liver diseases. Therefore, the use of OCTA and information technology is key to exploring the non-invasive diagnosis of cirrhosis. We evaluated and quantified hepatitis B cirrhosis using OCTA stratification of fundus blood flow. This information revealed some changes in the retinal vasculature and microstructure, and the results showed significant differences in almost all levels of the retina and choroid in different stages of hepatitis B cirrhosis, except for the FAZ area in the deep retina (P = 0.061). Therefore, we speculate that OCTA could be used for the staging diagnosis of hepatitis B cirrhosis. The results of this study showed that fundus blood flow was closely related to the stage diagnosis of hepatitis B cirrhosis, leading us to speculate that non-invasive ocular examination could be used for the stage diagnosis of hepatitis B cirrhosis. In subsequent studies, OCTA and other non-invasive detection techniques should be actively used to evaluate eye blood supply and study the relationship between fundus blood flow and the stage diagnosis of hepatitis B cirrhosis, providing a theoretical basis for the stage diagnosis of hepatitis B cirrhosis.