1. Background
Primary biliary cholangitis (PBC) is a chronic autoimmune liver disease that leads to the destruction of small intrahepatic bile ducts, subsequently resulting in biliary cirrhosis (1). The incidence of PBC is increasing, with epidemiological surveys revealing a range of 1.9 - 40.2 cases per 100,000 people (2). The primary pathogenesis of PBC involves the destruction of intrahepatic bile ducts by T cells, which triggers an inflammatory response in the body (3). Currently, the primary predisposing factors for PBC are genetic factors, including MHC class II, MHC class III, and CTLA-4 exons, and environmental factors, such as recurrent urinary tract infections, smoking, and exposure to toxic chemicals. However, genetic factors are currently considered the most influential (4, 5). Biliary epithelial cells and hepatocytes of PBC patients exhibit elevated levels of human leukocyte antigen (HLA) class I and II molecules (6). Clinical studies have shown that CD4+ T cells play a significant role in PBC development. Typically, PBC patients exhibit an increase in Th1 and Th17 cells and a decrease in Treg cells (7). Animal studies have revealed that Treg cells play a vital role in PBC development. CD25-deficient mice also suffer from portal vein inflammation and bile duct damage, mirroring the conditions observed in PBC patients (8). Anti-mitochondrial antibodies (AMAs), a common marker for PBC found in 95% of patients, were detected in mice with mutations in the transcription factor Foxp3 (9).
Stroke is a leading cause of death and acquired impairment in adults worldwide, imposing a substantial financial burden on society. In 2016, the adult mortality rate of stroke was 86.5 (range: 83.3 - 89.9) per 100,000 individuals (10). Established risk factors for stroke include tobacco use, increased blood pressure, heart disease, and diabetes (11). However, emerging evidence indicates that stroke is a complex disease, and the recognized risk factors alone cannot fully explain all the risks associated with stroke (12). Treg cells are known to play a significant immunomodulatory role in the context of stroke. However, it remains uncertain whether Treg cells have a positive effect on stroke outcomes. Research indicates that Treg cell circulation is lower in stroke patients than in controls. Another study revealed that Treg cells act as neuroprotective modulators of brain inflammation following ischemic stroke. Moreover, these cells mitigate secondary infarct growth (13).
Dyslipidemia is highly prevalent in patients with PBC. Dyslipidemia is also considered a significant risk factor for stroke. However, no studies have examined the association between PBC and stroke.
2. Objectives
In our research, we aimed to investigate the relationship between PBC and stroke via Mendelian randomization (MR).
3. Methods
3.1. Design of the Experiment
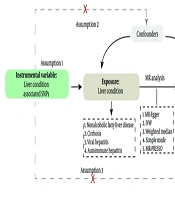
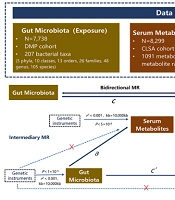
The MR analysis design of the association between PBC and stroke is briefly outlined below. From the pooled data of a genome-wide association study (GWAS), we conducted two MR analyses to explore the associations between PBC and various stroke types. Furthermore, we examined lipoproteins, apolipoproteins, and immune cells as mediators to determine any factors mediating the relationship between PBC and stroke, according to the three guiding principles (14, 15). The investigation was premised on the following assumptions, as shown in Figure 1: (1) A substantial association exists between genetic variation and exposure; (2) genetic mutations are unrelated to other confounding variables; (3) only exposure is associated with genetic variation and outcome. Finally, ethical approval was not necessary, as the summary statistics used were publicly available.
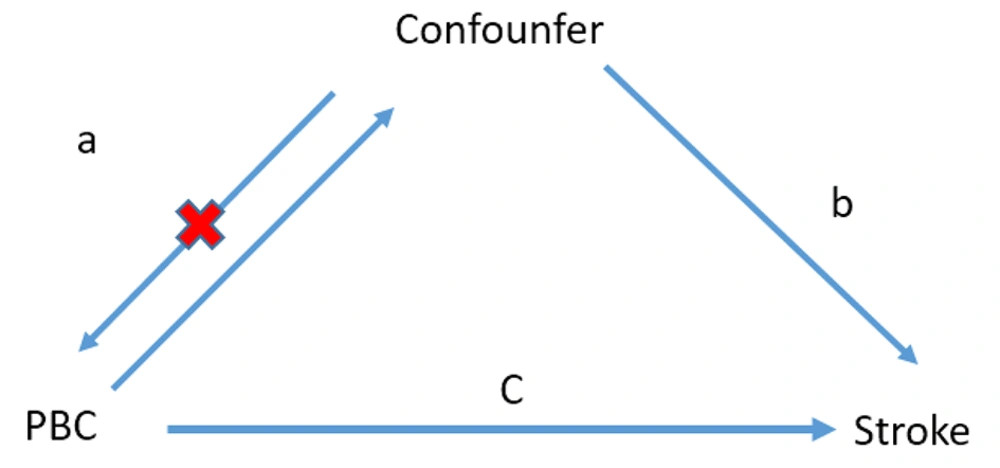
Figure 1.
Description of the experimental design of this study. The total effects were decomposed into (1) indirect effects via a two-step approach (a is the effect of AITD on cytokines, b is the effect of cytokines on stroke, and c is the total effect of AITD on stroke). (2) Direct effect = c - a × b). Scale-mediated is the indirect effect divided by the total effect.
3.2. Data Sources
The MEGASTROKE project, established by the International Stroke Genetics Consortium, provided access to the public database of stroke genetic data (details of the plan have been reported elsewhere). Briefly, we conducted a meta-analysis of 40,585 cases (34,217 ischemic stroke) and 406,111 European ancestry controls via summary statistics from 29 GWASs (16). The GWAS data for PBC include five cohorts with 8,021 cases and 16,489 controls of European origin (17). Summary statistics for Treg cells and lipids are publicly available from the GWAS catalogue (18).
3.3. Screening of Instrumental Variables for Mendelian Randomization Analysis
Initially, genome-wide significant SNPs (P < 5 × 10⁻⁸) were selected to obtain appropriate instrumental variables (IVs) from different GWAS data (19). Next, linkage disequilibrium of the selected IVs was ensured by choosing kb = 10,000 and r2 < 0.001 as the parameters. We then chose SNPs with F > 10 stroke IVs to ensure good instrumental strength (20, 21). Finally, the exposure and outcome datasets were harmonized to obtain genetic instrument effects on the outcome and to eliminate palindromic SNPs.
3.4. Statistical Analysis
A random-effects inverse-variance weighting (IVW) method was used to estimate the bidirectional causality between PBC and stroke. This method assumes that all MR assumptions are valid. However, given that the IVs might have influenced the results via alternative pathways, horizontal pleiotropic effects may exist and potentially bias the IVW causality estimates. Therefore, we conducted sensitivity analyses based on the MR-Egger and weighted median methods, allowing us to accurately determine causality even in the presence of invalid SNPs.
The MR relies on three key IV assumptions of the primary analysis. To assess the validity of these assumptions, we applied the following methods. Initially, the correlation hypothesis stroke was used to calculate r2, which measures the proportion of variation in the exposure variable explained by genetic variation. Next, we computed the F statistic to evaluate the instrumental strength in the relationship between the IVs and exposure variables, with a lower F statistic representing weak instrumental strength. Furthermore, MR-Egger regression intercepts and their respective 95% confidence intervals (CIs) were employed to examine the degree of stroke in the arbitrary estimates potentially caused by directional pleiotropy, which prevents limiting assumptions.
Moreover, we assessed horizontal pleiotropy via the MR pleiotropy residual sum and outlier (MR-PRESSO) global test, followed by excluding the outlier SNPs through the MR-PRESSO outlier test. Additionally, the possibility of significant differences between the new and previous IVs was investigated when the outlier IV was removed. We also examined the heterogeneity of the IVW and MR-Egger methods via Cochran's Q statistic and funnel diagrams. Various sensitivity analyses (such as stroke leave-one-out and individual SNP analyses) were then conducted to ascertain whether individual SNPs affected primary causality.
Furthermore, we estimated causality for binary outcomes via odds ratios (ORs) and 95% CIs. Finally, we presented the causal estimates, P-values, and their standard errors for binary and continuous outcomes, with each P-value being bilateral. All analyses were conducted via the TwoSampleMR and MR packages of R software (version 4.3.0, www.r-project.org).
4. Results
4.1. Relationship Between Primary Biliary Cholangitis and Stroke
We identified 47 SNPs for stroke IVs in PBC patients and 15 SNPs in stroke patients, which met the generally accepted genome-wide significance threshold (P < 5 × 10⁻⁸, r2 < 0.001, kb = 10,000) for exposure. Detailed data are provided in Appendix in the Supplementary File. We analyzed the relationship between PBC and stroke via bidirectional MR, and the results are shown in Figure 2 and Table 1. The results of IVW, MR-Egger, and weighted median regression showed that PBC increased the risk of stroke (OR, 1.02; 95% CI, 1.00 - 1.04; P = 0.002). However, there was no evidence of reverse causality between genetically predicted PBC and stroke (OR, 0.91; 95% CI, 0.60 - 1.37; P = 0.652). Stroke does not increase the risk of developing PBC.
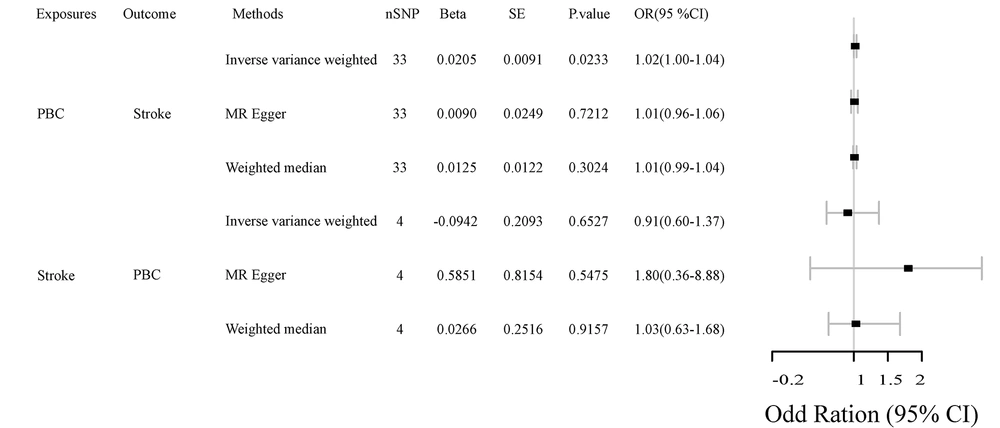
Figure 2.
Bidirectional Mendelian randomization (MR) analysis between primary biliary cholangitis (PBC) and stroke
Table 1.
Correlations Between Primary Biliary Cholangitis and Stroke According to Mendelian Randomization Analysis
| Exposures | NSNP | Beta | se | P-Value |
|---|---|---|---|---|
| PBC | ||||
| Stroke | ||||
| Inverse variance weighted | 33 | 0.020533 | 0.009052 | 0.023315 |
| MR Egger | 33 | 0.008961 | 0.024886 | 0.721155 |
| Weighted median | 33 | 0.012537 | 0.012157 | 0.302443 |
| Stroke | ||||
| PBC | ||||
| Inverse variance weighted | 4 | -0.09418 | 0.209309 | 0.652739 |
| MR Egger | 4 | 0.585066 | 0.81541 | 0.547545 |
| Weighted median | 4 | 0.026633 | 0.25156 | 0.915684 |
Abbreviation: PBC, primary biliary cholangitis; MR, Mendelian randomization.
4.2. Relationships Between PBC and Different Types of Stroke
To further analyze the relationship between PBC and stroke, we classified stroke into different subtypes: Any ischemic stroke (AIS), large artery stroke (LAS), cardioembolic stroke (CES), and small vessel stroke (SVS). As shown in Table 2 and Figure 3, the IVW results indicated significant correlations between genetically predicted PBC and certain types of stroke. Specifically, PBC significantly increases the risk of AIS (OR, 1.02; 95% CI, 1.00 - 1.05; P = 0.013) and CES (OR, 1.04; 95% CI, 1.00 - 1.08; P = 0.019). However, there was no significant association between PBC and LAS (OR, 1.00; 95% CI, 0.95 - 1.05; P = 0.92) or between PBC and SVS (OR, 1.04; 95% CI, 1.00 - 1.09; P = 0.071). The association between PBC and different types of stroke was further evaluated by MR-Egger and weighted median regression, which also showed no correlation.
Table 2.
Correlations Between Primary Biliary Cholangitis and Different Types of Stroke According to Mendelian Randomization Analysis
| Exposures | NSNP | Beta | se | P-Value |
|---|---|---|---|---|
| PBC | ||||
| AIS | ||||
| Inverse variance weighted | 33 | 0.024657 | 0.009984 | 0.01352 |
| MR Egger | 33 | 0.003860 | 0.027515 | 0.889455 |
| Weighted median | 33 | 0.010824 | 0.013503 | 0.422796 |
| CES | ||||
| Inverse variance weighted | 33 | 0.040346 | 0.019615 | 0.039694 |
| MR Egger | 33 | 0.087854 | 0.054213 | 0.115248 |
| Weighted median | 33 | 0.035918 | 0.024108 | 0.136253 |
| LAS | ||||
| Inverse variance weighted | 33 | 0.002694 | 0.026867 | 0.920143 |
| MR Egger | 33 | -0.08442 | 0.073605 | 0.260182 |
| Weighted median | 33 | -0.03004 | 0.02997 | 0.316251 |
| SVS | ||||
| Inverse variance weighted | 33 | 0.041978 | 0.02333 | 0.071965 |
| MR Egger | 33 | 0.002659 | 0.065019 | 0.967645 |
| Weighted median | 33 | 0.046927 | 0.029643 | 0.113408 |
Abbreviations: PBC, primary biliary cholangitis; AIS, any ischemic stroke; MR, Mendelian randomization; LAS, large artery stroke; CES, cardioembolic stroke; SVS, small vessel stroke.
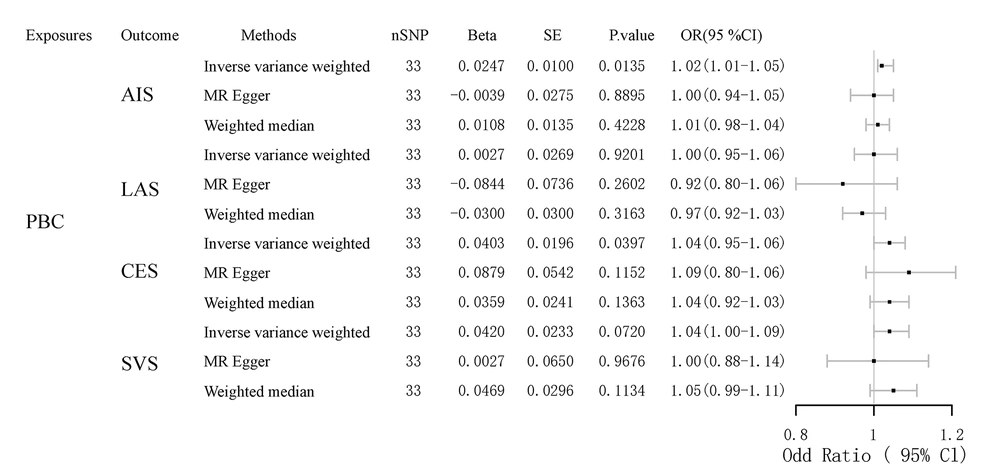
Figure 3.
Mendelian randomization (MR) analysis between primary biliary cholangitis (PBC) and different types of stroke
4.3. Role of Resting Tregs in Mediating the Association Between Primary Biliary Cholangitis and Stroke
To further investigate the relationship between PBC and stroke, we selected lipid metabolism and immune cells as mediators. The mediators associated with lipid metabolism include HDL, LDL, total cholesterol, apolipoprotein A, and apolipoprotein B. The mediators related to immune cells include data related to T cells, B cells, and NK cells. As shown in Figure 4 and Table 3, we first identified seven immune cell-related data points that could serve as mediators between PBC and stroke by bidirectional MR analysis. Further analysis revealed that the percentage of resting CD4 regulatory T cells (% CD4 regulatory T cells) mediated the direct causal relationship between PBC and AIS, accounting for 4.7% of the effect. While the mediating effect of 4.7% may seem small, it is nonetheless noteworthy when compared to the mediating effects identified. Furthermore, it has been demonstrated that fasting insulin and type 2 diabetes mediate 7.40% and 9.15% of the total effect of dyslipidemia on the risk of nonalcoholic fatty liver disease, respectively (22). Fibroblast growth factor 5 mediated 4.19% and 4.54% of the total effect of systolic and diastolic blood pressure on susceptibility to heart failure.
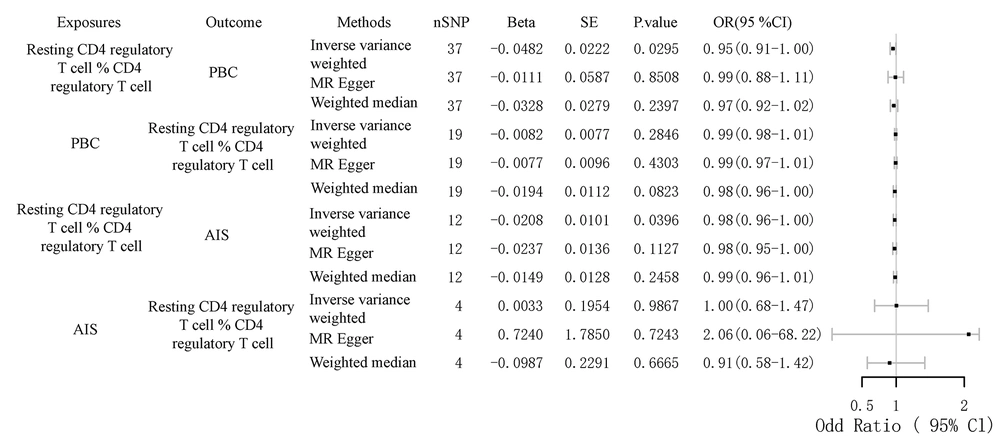
Figure 4.
Forest plot to visualize the causal effects of the mediator with primary biliary cholangitis (PBC) and any ischemic stroke (AIS)
Table 3.
Causal Effects of the Mediator with Primary Biliary Cholangitis and Any Ischemic Stroke
| Exposures | NSNP | Beta | se | P-Value |
|---|---|---|---|---|
| PBC | ||||
| rTreg %CD4 Treg | ||||
| Inverse variance weighted | 37 | -0.06098 | 0.027699 | 0.027698 |
| MR Egger | 37 | -0.06842 | 0.07369 | 0.359519 |
| Weighted median | 37 | -0.09571 | 0.030074 | 0.001460 |
| rTreg %CD4 Treg | ||||
| PBC | ||||
| Inverse variance weighted | 19 | -0.00821 | 0.007677 | 0.284606 |
| MR Egger | 19 | -0.00772 | 0.009553 | 0.430329 |
| Weighted median | 19 | -0.01939 | 0.011158 | 0.082283 |
| rTreg %CD4 Treg | ||||
| AIS | ||||
| Inverse variance weighted | 12 | 0.010104 | 0.039632 | -0.02079 |
| MR Egger | 12 | -0.02367 | 0.013613 | 0.112718 |
| Weighted median | 12 | -0.01487 | 0.012066 | 0.217667 |
| AIS | ||||
| rTreg %CD4 Treg | ||||
| Inverse variance weighted | 4 | -0.17588 | 0.145633 | 0.227158 |
| MR Egger | 4 | 0.145997 | 0.261752 | 0.606744 |
| Weighted median | 4 | 0.021102 | 0.117562 | 0.857547 |
Abbreviations: PBC, primary biliary cholangitis; MR, Mendelian randomization; rTreg, resting Treg; AIS, any ischemic stroke.
5. Discussion
5.1. Main Findings
In this study, we analyzed GWAS data from a European population to investigate the potential relationships between PBC and different types of stroke. The results of our MR analyses are consistent with the majority of clinical data revealing that PBC significantly increases the risk of stroke, but stroke does not alter the risk of PBC, which is consistent with most reports. Further research on different types of stroke found that PBC increased the risk of AIS and CES but did not affect the risk of LAS and SVS. In addition, our study revealed that immune cells — Tregs — are involved in the association of PBC with stroke risk, with 4.7% of this association being mediated by Treg cells. This study is the first to explore the causal relationship between PBC and stroke via MR methods and to identify Tregs as mediators.
5.2. Comparison with Previous Research
Past studies on PBC have revealed that 75 - 95% of patients with PBC develop hypercholesterolemia. This is evidenced by elevated levels of total cholesterol, triglycerides, and LDL cholesterol (23). It is believed that this occurs due to the alteration of cholesterol metabolism by PBC, causing cholestasis and reduced bile acid secretion, resulting in reduced bile acid synthesis and downregulation of hepatic cholesterol synthesis and LDL receptor activity, as well as changes in the composition of LDL, resulting in a reduction in the amount of LDL cleared from the circulation (24). Hyperlipidemia is considered an important risk factor for stroke and other cardiovascular diseases. Compared with the general population, clinically observed patients with PBC and hypertension appear to have a significantly increased risk of cardiovascular events and mortality. In addition, PBC patients with metabolic syndrome experience significantly more cardiovascular events than PBC patients without metabolic syndrome (24, 25). However, our findings diverge from these observations, as we discovered that lipid metabolites and proteins do not appear to be mediators between PBC and stroke risk. Instead, Treg cells mediate the risk factors for PBC and stroke.
5.3. Potential Mechanisms
Treg cells are a class of suppressor lymphocytes that are essential for immunomodulation and maintenance of immune homeostasis. Traditionally, Treg cells are considered to constitute a subpopulation of CD4+ T cells characterized by high expression of CD25 (interleukin-2R alpha chain) and intracellular FoxP3+, which are dependent on interleukin-2 for survival and exert dominant tolerance through cell contact-mediated inhibitory mechanisms (26). However, further studies have revealed that Treg cells can be classified into multiple subpopulations and that different subpopulations differ in nature and function. The first group of Treg cells, which are derived from the thymus, expresses CD45RA, CD25, and Foxp3. This group, known as naive Tregs (nTregs) or resting Tregs (rTregs), is abundant at birth but decreases in number with age (27). The second type, referred to as activated Treg cells (aTregs), does not express CD45RA but highly expresses CD25 and Foxp3. Both rTregs and aTregs perform primarily immunosuppressive functions. A third group of Treg cells, known as non-Tregs, does not express CD45RA, FOXP3, or CD25. When activated, these cells secrete inflammatory cytokines but do not produce suppressive effects. rTregs have been shown to be reduced in autoimmune diseases, suggesting a potential role for rTregs in alleviating autoimmune diseases (28). Meanwhile, some studies have found a decrease in rTregs in peripheral blood in patients with atherosclerosis. Atherosclerosis is an important risk factor for stroke. This may be the reason why lower rTreg numbers mediate an increased risk of stroke (28).
Our study revealed that PBC causes changes in the number and proportion of Treg cells, especially rTreg cells, which aligns with the findings of previous studies. Previous studies have found that polymorphisms of CTLA-4 are associated with the incidence of PBC, while CTLA-4 expression levels in PBC patients are significantly lower than in the normal population (22). The results of animal experiments showed that the symptoms of PBC could be effectively improved by exogenous CTLA-4 supplementation. Clinical studies have found that serum levels of IL-2 are significantly lower in patients with PBC than in the normal population. Animal studies have shown that low doses of IL-2 can restore the Treg pool and increase the number and proportion of Tregs in peripheral blood (7, 29, 30). Wang et al. previously reported that the percentage of CD4+ CD25+ Tregs among CD4+ T cells was significantly reduced in patients with PBC. This leads to the activation of reactive T cells, inducing the secretion of inflammatory cytokines, such as IFN-γ, which in turn leads to tissue-specific injury (31, 32). These findings suggest that PBC causes rTreg activation, leading to a reduction in the number of rTregs. However, it is possible that the aTregs could not exert sufficient immunosuppressive effects due to lower CTLA-4 and IL-2 levels. It even leads to some of the Tregs triggering tissue damage, thus causing an increased risk of stroke. This is consistent with our conclusion that PBC triggers a decrease in the number of rTregs.
The role of Treg cells in stroke remains unclear, and some researchers have reported a decrease in the number of Treg cells in stroke patients. Experimental over-transference of Treg cells, or an increase in the number of endogenous Treg cells, was found to protect the brain 1 - 7 days after ischemic injury (33). In addition, the results from animal models of stroke further suggest that increasing the number and/or function of Tregs can prevent ischemic brain injury. Treg cells may mitigate the risk and severity of stroke by limiting excessive immune responses both in the central nervous system (CNS) and peripherally, ameliorating acute blood-brain barrier injury, and promoting neural stem cell proliferation for brain repair (34). In our study, the overall changes in Treg cells appeared to affect the risk of stroke, and only rTregs acted as a mediator between PBC and stroke. Given that Treg cells also seem to play bidirectional roles in stroke, it is noteworthy that in some animal models, the volume of cerebral infarcts in mice is significantly reduced 24 hours after stroke following Treg cell depletion and increases again when Treg cells are reconstituted within 3 weeks. Some researchers believe that Tregs have no effect on stroke. We speculate that different Treg subtypes may play distinct roles in stroke and that the increase in CTLA-4 levels after stroke could activate rTregs to become aTregs, which exhibit stronger inhibitory effects. This could explain why an increased number of rTreg cells reduces stroke risk (13).
5.4. Conclusions
In this study, we utilized MR to analyze the causal relationship between PBC and stroke, incorporating a broader range of population sequences. For the first time, our study revealed that rTreg cells appear to mediate the increased risk of acute ischemic stroke associated with PBC, although this association was only 4.7%. In future studies, exploring the roles of different Treg subtypes may provide further insights.
5.5. Limitations
Our study suggests that PBC may cause acute ischemic stroke through a mechanism mediated by rTreg cells. PBC causes a decrease in the number of rTreg cells, and this reduction in the proportion of rTreg cells triggers an increased risk of acute ischemic stroke. However, our conclusions still have major limitations. The samples for GWAS sequencing included in this study were from European populations, and the conclusions may not be applicable to African and Asian populations. Second, our conclusions still need to be validated in clinical cohorts. We also lack direct experimental data on rTreg-mediated mechanisms.
5.6. Future Directions
The focus of our future work will be to obtain direct experimental data on rTreg-mediated mechanisms. Additionally, exploring the roles of different Treg subtypes may provide further insights.