
1. Background
Hepatocellular carcinoma (HCC), a common primary liver malignancy worldwide, accounts for more than 900,000 new cases and approximately 700,000 deaths annually (1). Its incidence varies by region, particularly in Asia and Africa (2). Traditional treatments for HCC include chemoembolization, radioembolization, radiation therapy, and surgery (3). In recent years, immunotherapy and targeted therapy have been developed for advanced disease. Although these treatments have improved treatment efficacy, drug resistance remains a concern (4, 5). Identifying new molecular biomarkers could help individualize treatment for patients with HCC.
Platelets are small, anucleate blood cells essential for coagulation and hemostasis following mechanical injury to blood vessels. Platelet counts have shown promise as prognostic markers in several malignancies, including melanoma, lung cancer, and prostate cancer (6, 7). Tumor cells can trigger platelet activation, including procoagulant activity, aggregation, and adhesion, through immunoreceptor tyrosine-based activation motif signaling (8). Abnormal platelet activation may further promote tumor cell migration and cancer-related thrombosis (9). Receptors expressed on platelets may also facilitate tumor growth and metastasis (10). The roles of platelets in HCC metastasis, invasion, growth, and development have been well documented (11). Several platelet-related genes (PRGs) involved in HCC progression have been investigated and validated (12). A better understanding of crosstalk between cancer cells and platelets could help clinicians develop antiplatelet drugs.
2. Objectives
This study aimed to establish a PRG-based prognostic assessment system for HCC. Differentially expressed platelet-related genes (DE-PRGs) associated with HCC were screened using The Cancer Genome Atlas (TCGA) liver cancer database. Machine learning analyses were used to select optimal DE-PRGs and construct a risk-score model to predict prognosis. A nomogram incorporating independent prognostic factors was developed to improve prognostic assessment. In addition, immune cell infiltration was analyzed using CIBERSORT, and drugs associated with DE-PRGs were explored to clarify their potential roles in the tumor immune microenvironment. These analyses were intended to provide a theoretical basis for personalized treatment and prognostic assessment in patients with HCC.
3. Methods
3.1. Data Sources
The training dataset, downloaded from the Xena database, included 423 samples: 373 HCC samples and 50 normal control samples (CTRL). Expression data were generated using Illumina HiSeq 2000 and normalized to TCGA Level 3 log2(FPKM + 1) (Fragments Per Kilobase of transcript per Million).
The GSE121248 and GSE76427 datasets, obtained from the National Center for Biotechnology Information Gene Expression Omnibus (GEO) database, contained normalized expression data. GSE121248 was used to validate PRG set scoring and included 107 liver tissue samples (70 HCC and 37 CTRL); expression data were generated using the Affymetrix Human Genome U133 Plus 2.0 Array platform. GSE76427 was selected to validate the survival prediction model. It contained 167 samples, including 115 HCC tumor specimens with clinical prognostic information; expression data were generated using the Illumina HumanHT-12 V4.0 expression beadchip platform.
3.2. Screening for HCC-Related DE-PRGs
3.2.1. Screening for DE-PRGs
Differentially expressed genes (DEGs) between HCC and CTRL were identified using limma (v3.34.7) in R 4.3.1, with thresholds of false discovery rate < 0.05 and absolute log2 fold change > 0.5 (13). A set of 300 PRGs was obtained from the literature (PMID: 36463115) (14). The intersection of DEGs and PRGs yielded DE-PRGs.
3.2.2. Weighted Gene Coexpression Network Analysis
Weighted gene coexpression network analysis (WGCNA; v1.61) (15) in R 4.3.1 was applied to the training dataset to identify disease-associated modules and construct a coexpression network (minimum module size = 100; cutHeight = 0.995). Module–disease correlations were then calculated. Genes in modules significantly associated with disease were retained and intersected with DE-PRGs to identify disease-related DE-PRGs. Gene Ontology (GO) and Kyoto Encyclopedia of Genes and Genomes enrichment analyses of these genes were performed using DAVID v6.8 (P < 0.05).
3.3. Construction and Validation of the PRG Score
A PRG score was calculated for each sample using gene set variation analysis (GSVA; v1.36.3) (16) in R 4.3.1, based on the expression levels of disease-related DE-PRGs. Samples were divided into high-score and low-score groups using the median PRG score. Principal component analysis was performed based on the PRG scores, and the Wilcoxon test was used to compare the expression distributions of disease-related DE-PRGs between the groups. A receiver operating characteristic (ROC) curve was constructed using pROC (v1.18.5) in R 4.3.1 (17) to assess the ability of the PRG score to distinguish HCC from controls. The 95% confidence intervals (CIs) for the area under the curve (AUC) were calculated using the DeLong method. The PRG score and its ability to predict the risk of death were also evaluated in the GSE121248 validation dataset.
3.4. Construction of a DE-PRG Prognostic Model
3.4.1. Development of the Risk Score Model
Prognosis-associated DE-PRGs were identified using univariable Cox regression with survival (v2.41 - 1) (18) in R 4.3.1, based on TCGA HCC expression and survival data (P < 0.05). Least absolute shrinkage and selection operator (LASSO) regression was then performed using lars (v1.2) (19) in R 4.3.1 to select the optimal DE-PRGs. The optimal penalty parameter λ was selected using 10-fold cross-validation (log λ = -3.78) to support stable parameter selection. The risk score model was constructed using the LASSO prognostic coefficients (Supplementary Table S1) and the expression levels of the optimal DE-PRGs.
3.4.2. Evaluation of the Prognostic Performance of the Risk Model
Risk scores were calculated separately for samples in the TCGA training dataset and the GSE76427 validation dataset. Samples were divided into high-risk and low-risk groups using the median risk score. Kaplan–Meier (KM) curves generated using survival (v2.41 - 1) (20) in R 4.3.1 were used to compare overall survival between the groups. Prognostic performance was further evaluated using time-dependent ROC analysis with timeROC (v0.4) in R 4.3.1. The 95% CIs for the AUCs were estimated using the asymptotic normal approximation.
3.5. Construction of a Nomogram Based on Independent Prognostic Factors
Univariable and multivariable Cox regression analyses were performed using survival in the training dataset to identify independent clinical prognostic factors. The analyses included age, stage, grade, vascular invasion, and recurrence data for tumor samples. All missing values were coded as “NA.” The survival package automatically detected these entries and performed a complete-case analysis, using samples with nonmissing information for each variable to fit the models. A log-rank P < 0.05 was used to identify significant associations. Missing data for each clinical variable are detailed in Supplementary Table S2.
A nomogram was constructed using rms (v5.1 - 2) in R 4.3.1 (21) to assess the prognostic roles of independent clinical factors. It integrated these factors with the risk score from the prognostic model. Using survcomp (v1.34.0) in R 4.3.1, the nomogram was internally validated by bootstrap resampling with 1,000 replicates. Bootstrap-corrected calibration curves were plotted, and Harrell’s concordance index (C-index) was calculated for 1-, 3-, and 5-year survival to evaluate calibration and discrimination. Time-dependent ROC curves for 1-, 3-, and 5-year overall survival were generated using timeROC (v0.4), and 95% CIs for the AUCs were estimated using the asymptotic normal approximation.
3.6. Immune Cell Infiltration Analysis and Network Construction
The tumor immune microenvironment comprises immune cells within and around tumors and can be characterized by their proportions in tumor tissues. CIBERSORT (22) was used to estimate immune cell proportions in TCGA HCC samples. The Wilcoxon test was used to compare immune cell distributions between risk groups. Associations between the risk score and the proportions of immune cells that differed significantly between groups were then analyzed. GeneMANIA (23) was used to identify factors associated with DE-PRGs and construct a DE-PRG-centered network. GO functional enrichment analysis of the genes in the network was performed using DAVID v6.8 (24).
3.7. Construction of DE-PRG-Related Drug Networks
HCC-related factors were screened in the Comparative Toxicogenomics Database (25) using the keyword “hepatic cellular carcinoma.” Small molecules associated with the optimal DE-PRGs were then obtained, and a network linking these molecules to the signature DE-PRGs was constructed.
4. Results
4.1. Identification of DE-PRGs Associated with Disease Status
A total of 2714 DEGs were identified between HCC and CTRL, including 1117 downregulated and 1597 upregulated genes (Figure 1A). A set of 300 PRGs was obtained from previously published data. The intersection of these gene sets yielded 66 DE-PRGs (Figure 1B). WGCNA identified 14 as the appropriate power value (Figure 1C). Using this value, the dissimilarity coefficient between nodes was calculated, and a hierarchical clustering tree was constructed, identifying 9 coexpression modules (Figure 1D). Correlations between each module and disease status were evaluated. Two modules, blue and green, with absolute correlation coefficients greater than 0.3 were selected (Figure 1E). Both showed a strong correlation between gene significance and module membership (MM) (Figure 1F). The intersection of the 66 DE-PRGs and genes in these modules yielded 17 disease-related DE-PRGs: ABCC4, ADRA2B, ADRA2C, CD109, DAGLA, ECM1, F8, FOS, GNA14, GNG4, IGF1, IGF2, PF4, PLCB1, SERPINA3, SPP2, and TRPC6.
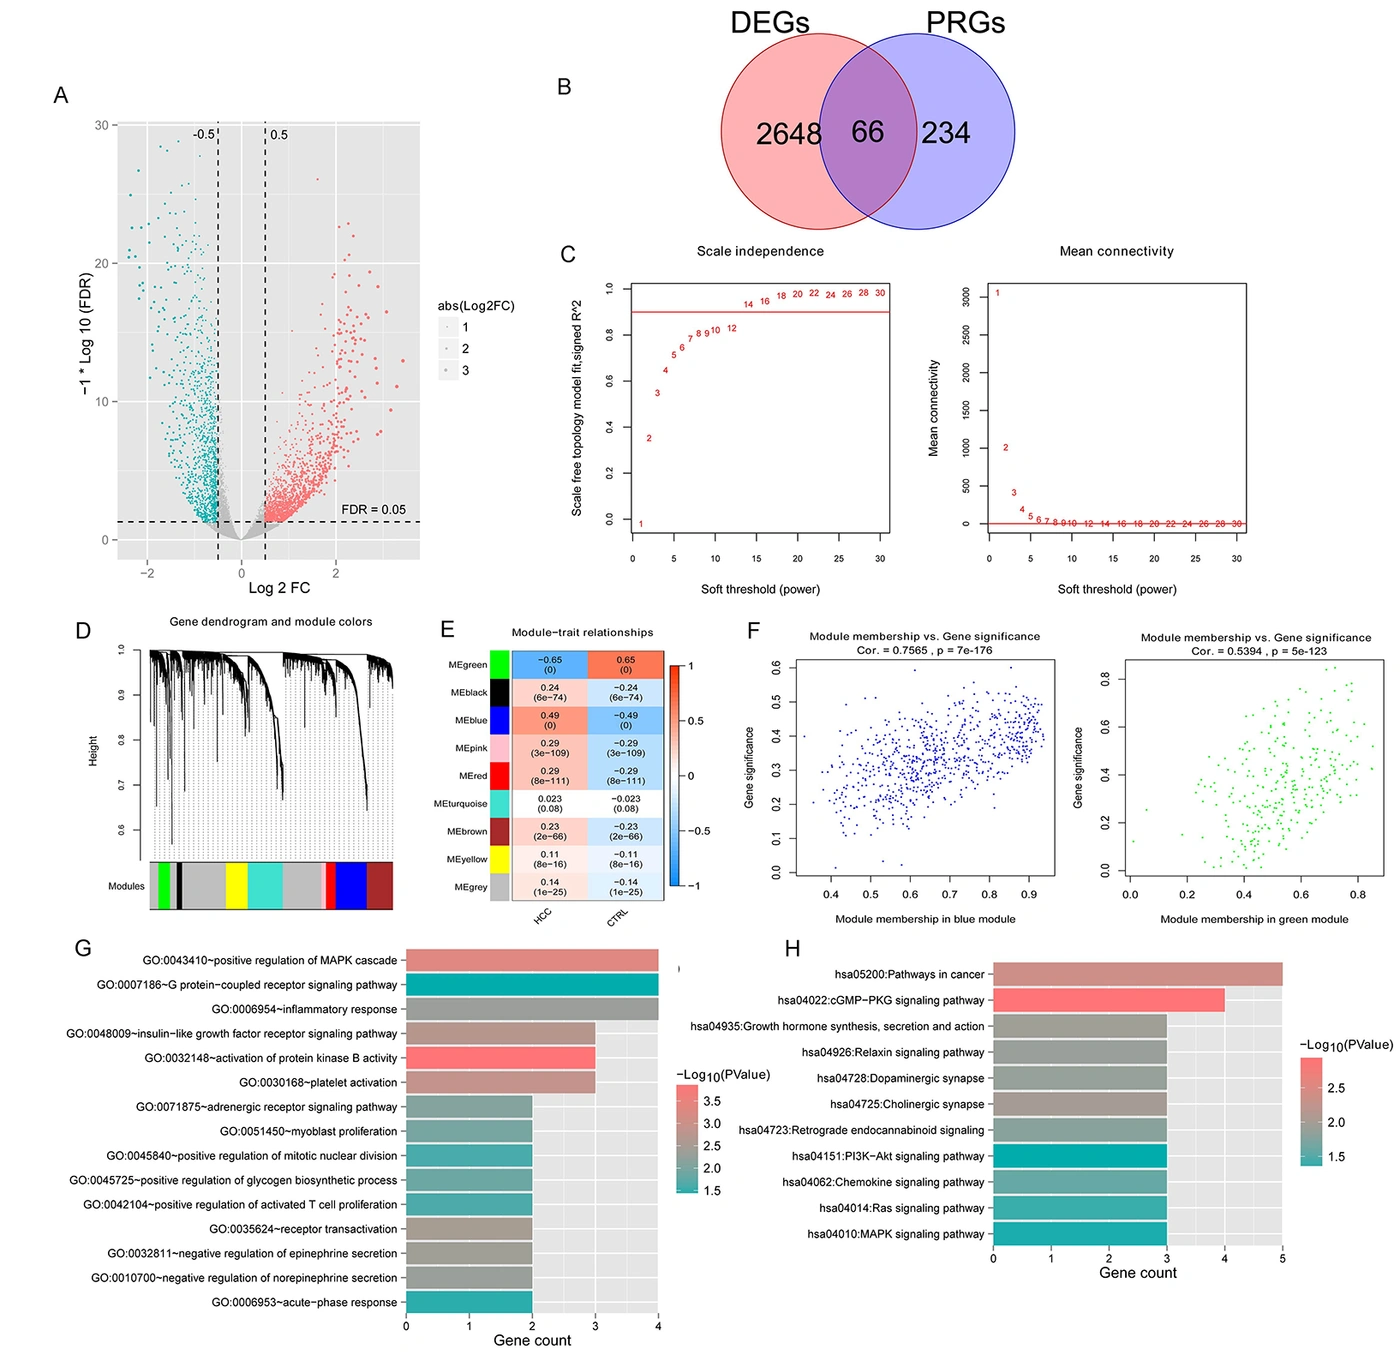
Figure 1.
Differentially expressed platelet-related genes and functional enrichment. A, Volcano plot of log2FC-log10FDR. Green and red dots indicate significantly downregulated and upregulated genes, respectively. The black horizontal line indicates false discovery rate (FDR) < 0.05, and the 2 vertical lines indicate |log2fold change (FC)| > 0.5. B, Venn diagram. C, Left: Selection of the adjacency matrix power parameter. The horizontal axis shows the power parameter, and the vertical axis shows the squared correlation coefficient between log(k) and log(p(k)) in the corresponding network. The red line indicates a squared correlation coefficient of 0.9. Right: Mean gene connectivity at different power values. The red line indicates mean network node connectivity of 1 at the adjacency matrix power shown in the left panel. D, Module clustering tree; each color indicates a different module. E, Heatmap of correlations between modules and disease status. F, Correlations between gene significance and module membership (MM) in the blue and green modules. G, Gene Ontology analysis. H, Kyoto Encyclopedia of Genes and Genomes pathway analysis. The horizontal axis shows the number of genes, and color indicates significance.
Functional analysis showed that these 17 disease-related DE-PRGs were primarily enriched in 15 biological processes (Figure 1G), including “GO:0032148~activation of protein kinase B activity,” “GO:0043410~positive regulation of MAPK (Mitogen-Activated Protein Kinase) cascade,” and “GO:0030168~platelet activation.” They were also enriched in 11 Kyoto Encyclopedia of Genes and Genomes pathways (Figure 1H), including “hsa04022: cGMP-PKG signaling pathway,” “hsa05200: Pathways in cancer,” and “hsa04725: Cholinergic synapse.”
4.2. Association Between the PRG Score and Prognosis
Based on the expression levels of the 17 disease-related DE-PRGs in TCGA, the PRG score stratified samples into high-score and low-score groups (Figure 2A). Principal component analysis showed that samples could be separated into 2 clusters, indicating distinct high-score and low-score subgroups within the dataset (Figure 2B–C). Expression of the 17 disease-related DE-PRGs differed significantly between the groups (Figure 2D).
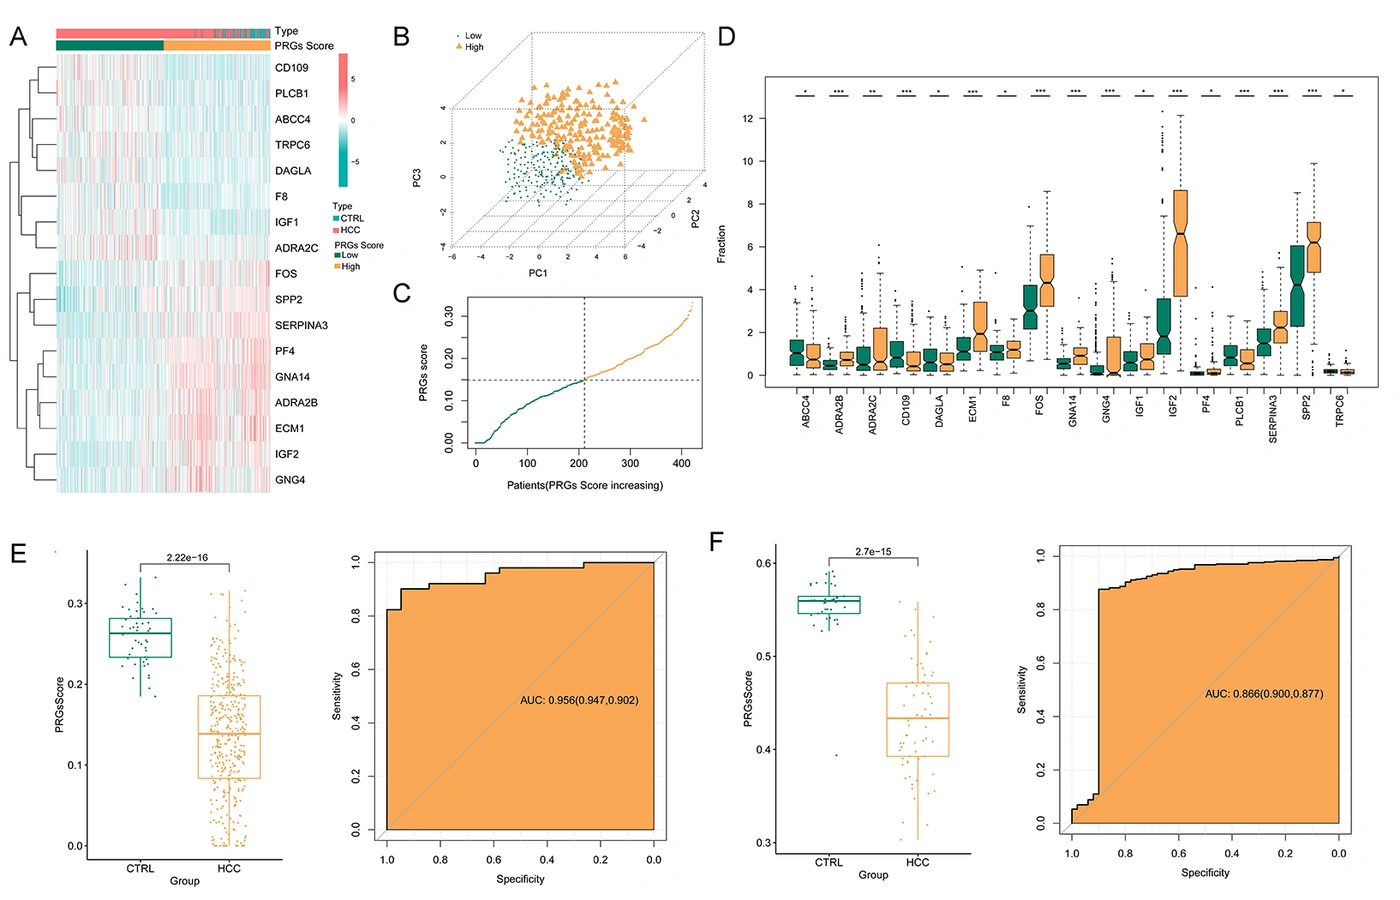
Figure 2.
Platelet-related gene (PRG) score and predictive performance. A, Heatmaps of the expression levels of 17 disease-related differentially expressed platelet-related genes. B, Principal component analysis based on the PRG score. C, Distribution of PRG scores from low to high. D, Expression distributions of the 17 disease-related differentially expressed platelet-related genes in the high-score and low-score groups. E, PRG score distributions in hepatocellular carcinoma and controls (left) and receiver operating characteristic curves showing predictive performance in The Cancer Genome Atlas training dataset. F, PRG score distributions in hepatocellular carcinoma and controls (left) and receiver operating characteristic curves showing predictive performance in the GSE121248 validation dataset.
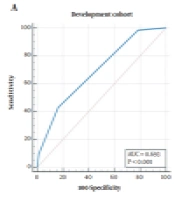
The PRG score was significantly lower in HCC samples than in controls in both the TCGA training dataset (Figure 2E) and the GSE121248 dataset (Figure 2F). The AUC was 0.956 (95% CI, 0.94 - 0.97) in TCGA and 0.866 (95% CI, 0.80 - 0.93) in GSE121248, indicating that the PRG score could distinguish HCC from controls.
4.3. Construction of DE-PRG Prognostic Models
A total of 10 prognosis-associated DE-PRGs were identified by integrating the 17 disease-related DE-PRGs with clinical prognostic information. LASSO regression selected 6 optimal DE-PRGs: ABCC4, CD109, IGF1, GNG4, SPP2, and GNA14. The parameter plot is shown in Supplementary Figure S1. Higher expression of ABCC4, CD109, and GNG4 was associated with shorter survival, whereas higher expression of IGF1, SPP2, and GNA14 was associated with longer survival (Figure 3A).
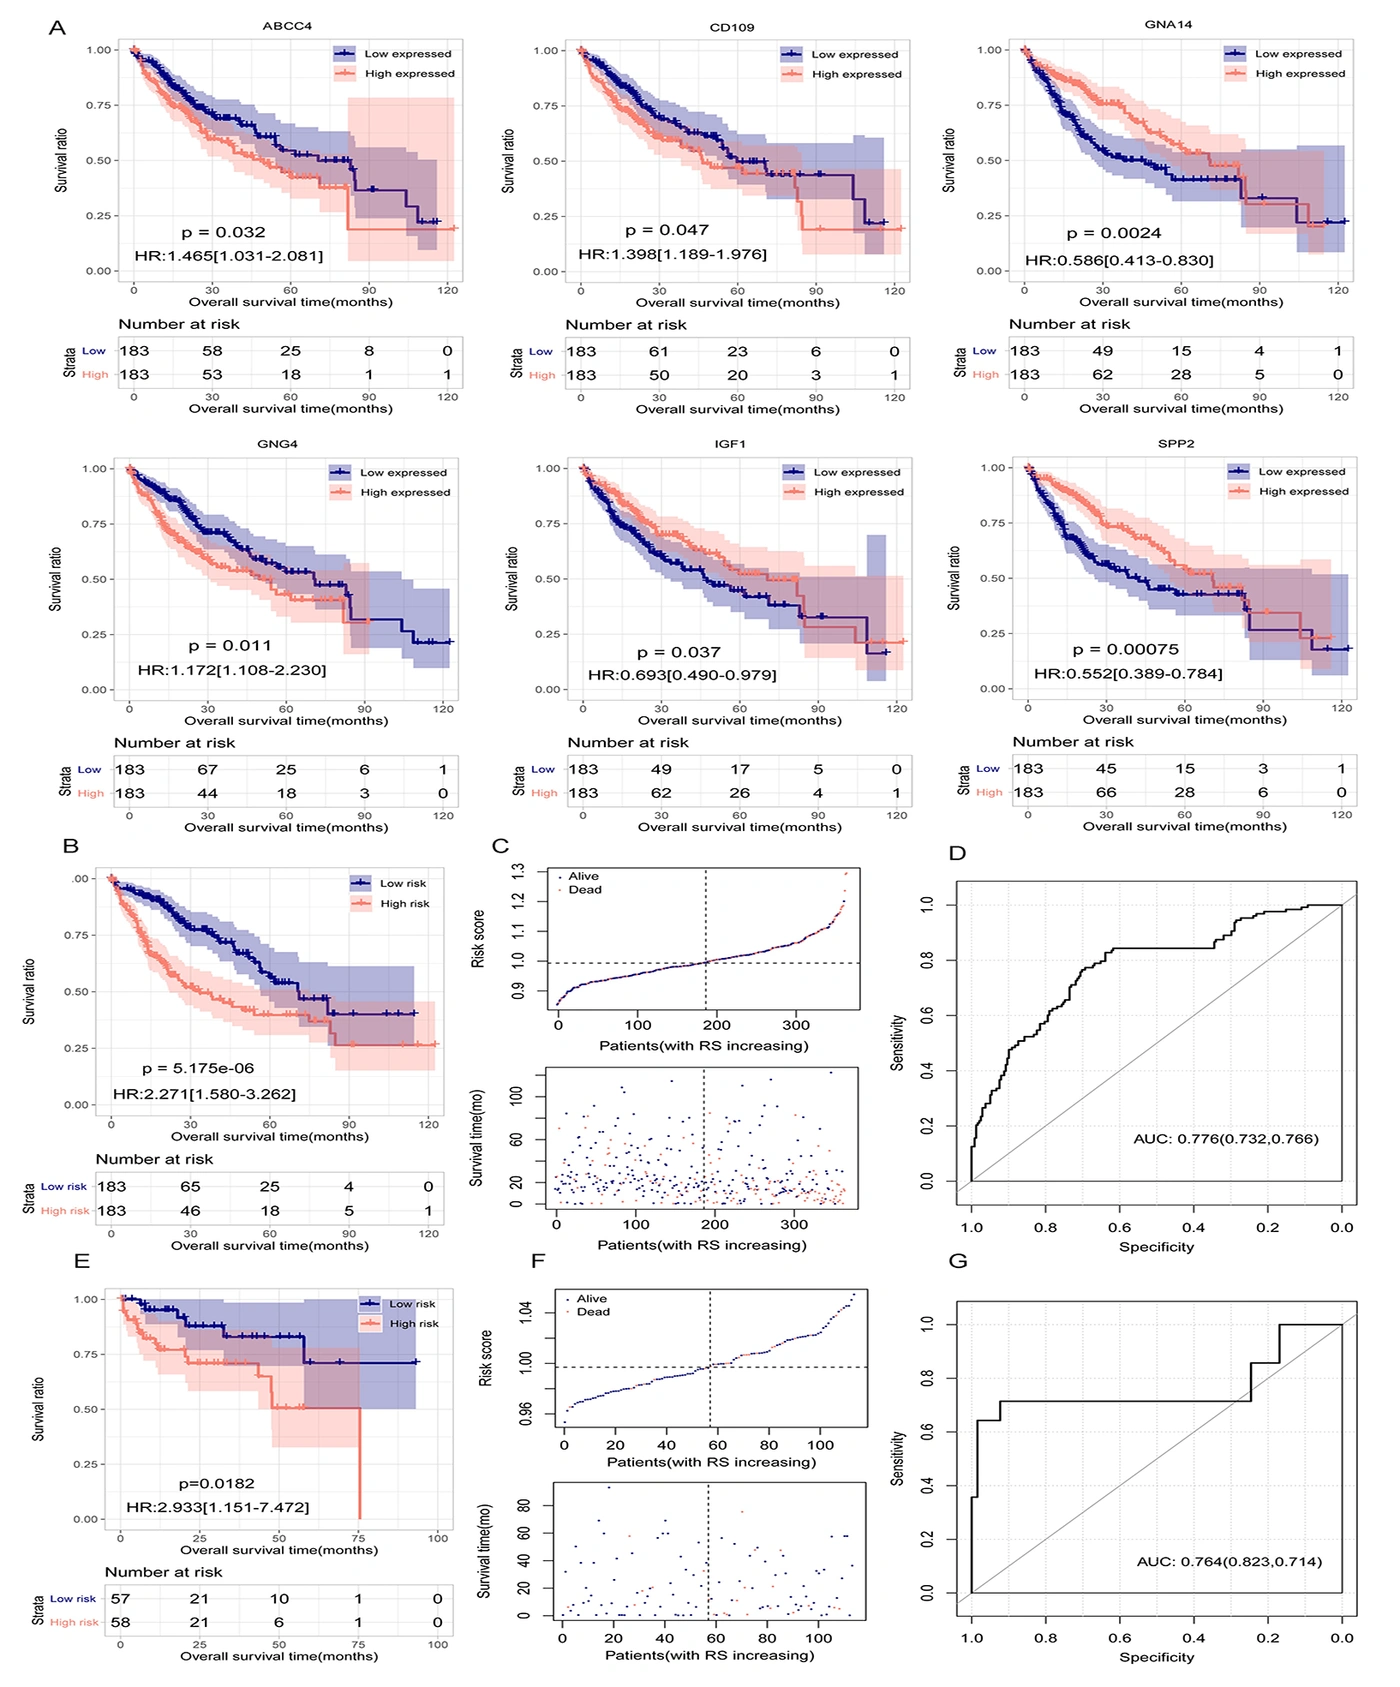
Figure 3.
Risk score and prognosis. A, Kaplan–Meier (KM) curves for ABCC4, CD109, IGF1, GNG4, SPP2, and GNA14. B, KM curves based on the 6 optimal differentially expressed platelet-related genes (DE-PRGs) in The Cancer Genome Atlas. C, Risk score distribution and survival time and status. D, Receiver operating characteristic curve for the prognostic model based on the 6 optimal DE-PRGs. E, KM curves based on the 6 optimal DE-PRGs in GSE76427. F, Risk score distribution and survival time and status. G, ROC curves for the prognostic models based on the 6 optimal DE-PRGs.
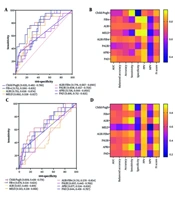
KM analysis based on the 6 optimal DE-PRGs in TCGA showed longer overall survival in the low-risk group (Figure 3B and C). The AUC was 0.776 (95% CI, 0.72 - 0.83), indicating prognostic value (Figure 3D). Similarly, KM analysis of GSE76427 showed longer overall survival in low-risk patients (Figure 3E and F), with an AUC of 0.764 (95% CI, 0.68 - 0.85) (Figure 3G).
4.4. Identification of Independent Prognostic Factors and Construction of the Survival Nomogram
Univariable and multivariable Cox regression analyses of the training dataset identified age, pathologic stage, and risk score model status as independent prognostic factors (Table 1). A nomogram was constructed using age, pathologic stage, and risk score. Scores for each variable were summed to obtain a total score for predicting survival at 1, 3, and 5 years (Figure 4A). The C-index values at these time points were 0.731, 0.780, and 0.789, respectively. Calibration curves comparing observed and predicted survival probabilities were close to the ideal calibration line, indicating good predictive accuracy (Figure 4B). ROC analysis yielded AUCs of 0.771 (95% CI, 0.72 - 0.82), 0.790 (95% CI, 0.74 - 0.84), and 0.777 (95% CI, 0.72 - 0.83) for 1-, 3-, and 5-year survival, respectively, indicating strong discrimination (Figure 4C).
Table 1.
Identification of Independent Clinical Prognostic Factors
| Clinical characteristics | Univariable Cox | Multivariable Cox | ||
|---|---|---|---|---|
| HR (95% CI) | P value | HR (95% CI) | P value | |
| Age (y) | 1.012 (1.001 - 1.026) | 4.681E-02 | 1.013 (1.001 - 1.028) | 4.742E-02 |
| Gender (male/female) | 0.809 (0.568 - 1.153) | 2.397E-01 | – | – |
| Pathologic M (M0/M1) | 4.032 (0.967 - 12.83) | 5.198E-02 | – | – |
| Pathologic N (N0/N1) | 2.004 (0.491 - 8.181) | 3.827E-01 | – | – |
| Pathologic T (T1/T2/T3/T4) | 1.675 (0.973 - 2.009) | 1.121E-01 | – | – |
| Pathologic stage (I/II/III/IV) | 1.661 (1.354 - 2.038) | 6.012E-07 | 1.538 (1.244 - 1.901) | 6.830E-05 |
| Histologic grade (G1/G2/G3/G4) | 1.124 (0.889 - 1.421) | 3.293E-01 | – | – |
| Vascular invasion (yes/no) | 1.319 (0.871 - 1.998) | 1.894E-01 | – | – |
| Tumor recurrence (yes/no) | 1.458 (0.903 - 2.043) | 1.406E-01 | – | – |
| Risk score model status (high/low) | 2.271 (1.580 - 3.262) | 5.175E-06 | 1.849 (1.249 - 2.736) | 2.130E-03 |
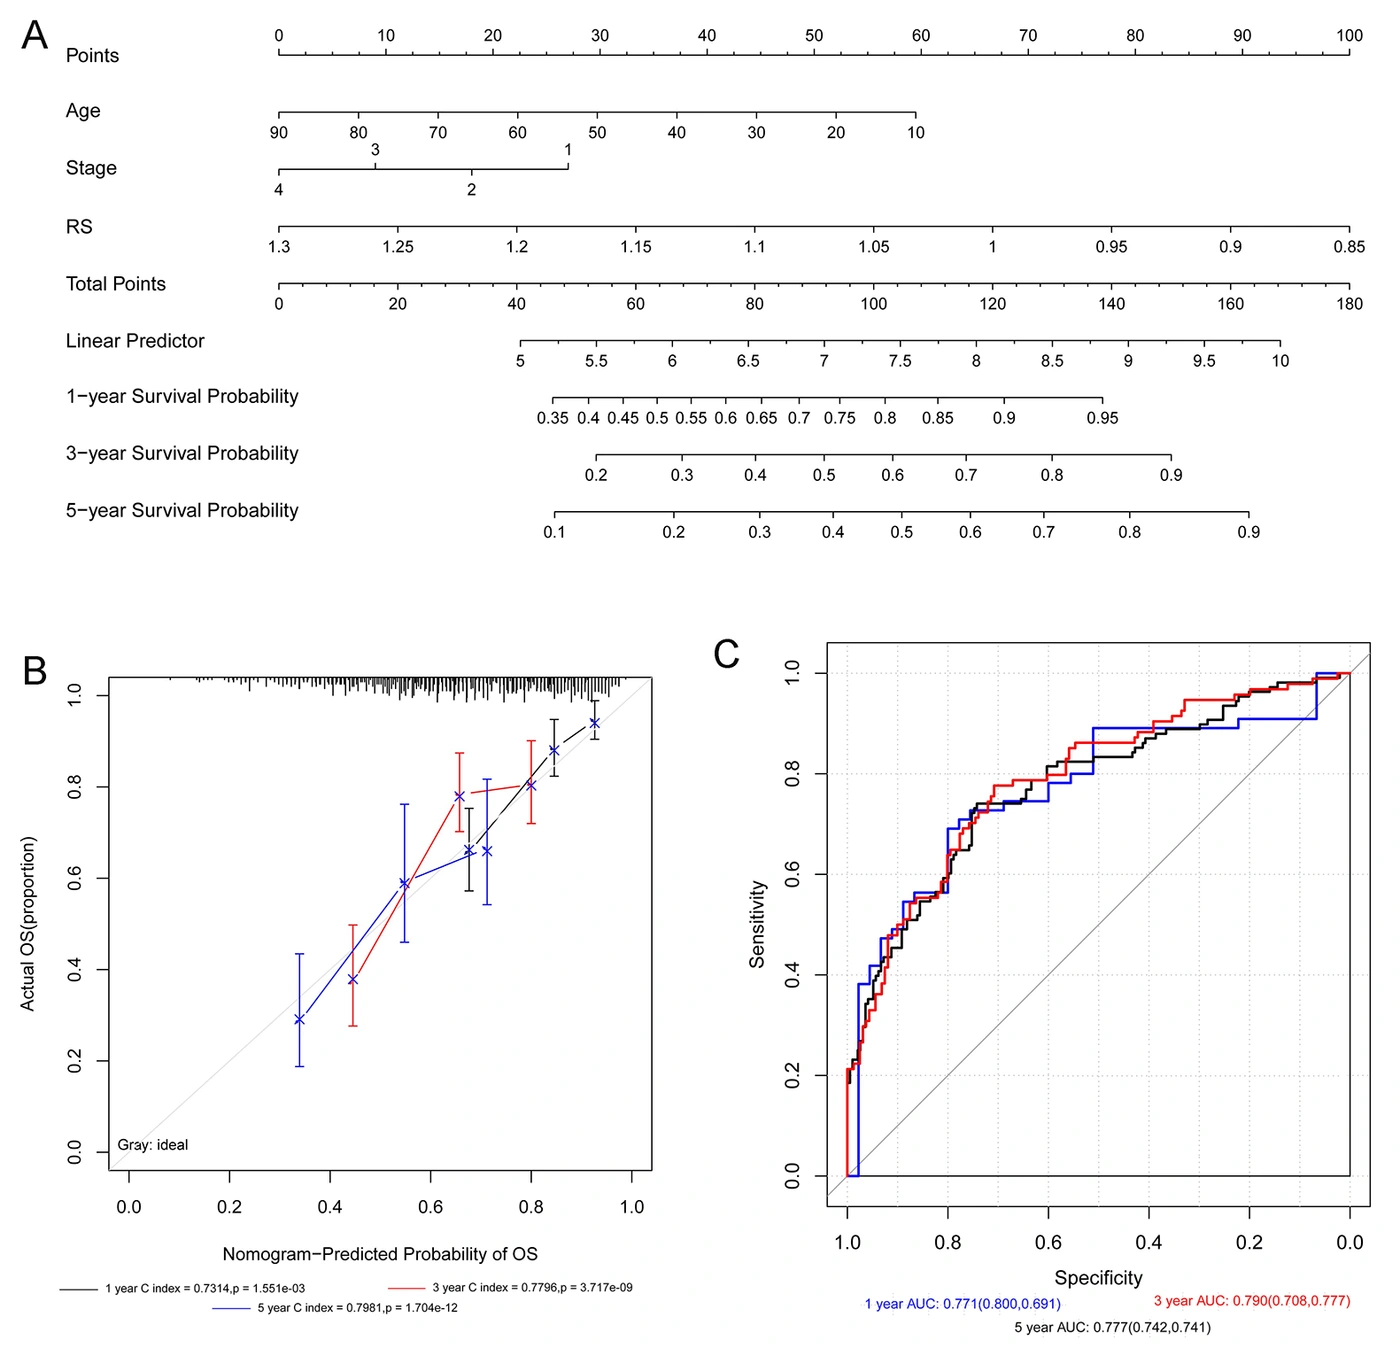
Figure 4.
Survival nomogram based on age, pathologic stage, and risk score. A, Nomogram incorporating independent prognostic factors to predict survival. B, Calibration curves comparing predicted and observed 1-, 3-, and 5-year survival. The horizontal axis shows predicted survival, and the vertical axis shows observed survival. C, Receiver operating characteristic curves for predicting 1-, 3-, and 5-year survival.
Abbreviations: HR, hazard ratio; CI, confidence interval; RS, risk score; M, distant metastasis; N, regional lymph node metastasis; T, primary tumor; G, histologic grade. Univariable and multivariable Cox analyses refer to Cox proportional hazards regression. A dash (–) indicates a variable not included in the multivariable model.
4.5. Risk Groups and Immune Cell Analysis
Immune cell infiltration was evaluated using CIBERSORT, and differences between groups were assessed using the Wilcoxon test. Nine immune cell populations differed significantly between the high-risk and low-risk groups: plasma B cells, M0 macrophages, regulatory T cells (Tregs), follicular helper T cells, activated CD4+ memory T cells, resting CD4+ memory T cells, monocytes, activated mast cells, and neutrophils (Figure 5A). M0 macrophages, Tregs, follicular helper T cells, activated CD4+ memory T cells, plasma B cells, and neutrophils were positively correlated with the risk score. Resting CD4+ memory T cells and activated mast cells were negatively correlated with the risk score (Figure 5B and C).
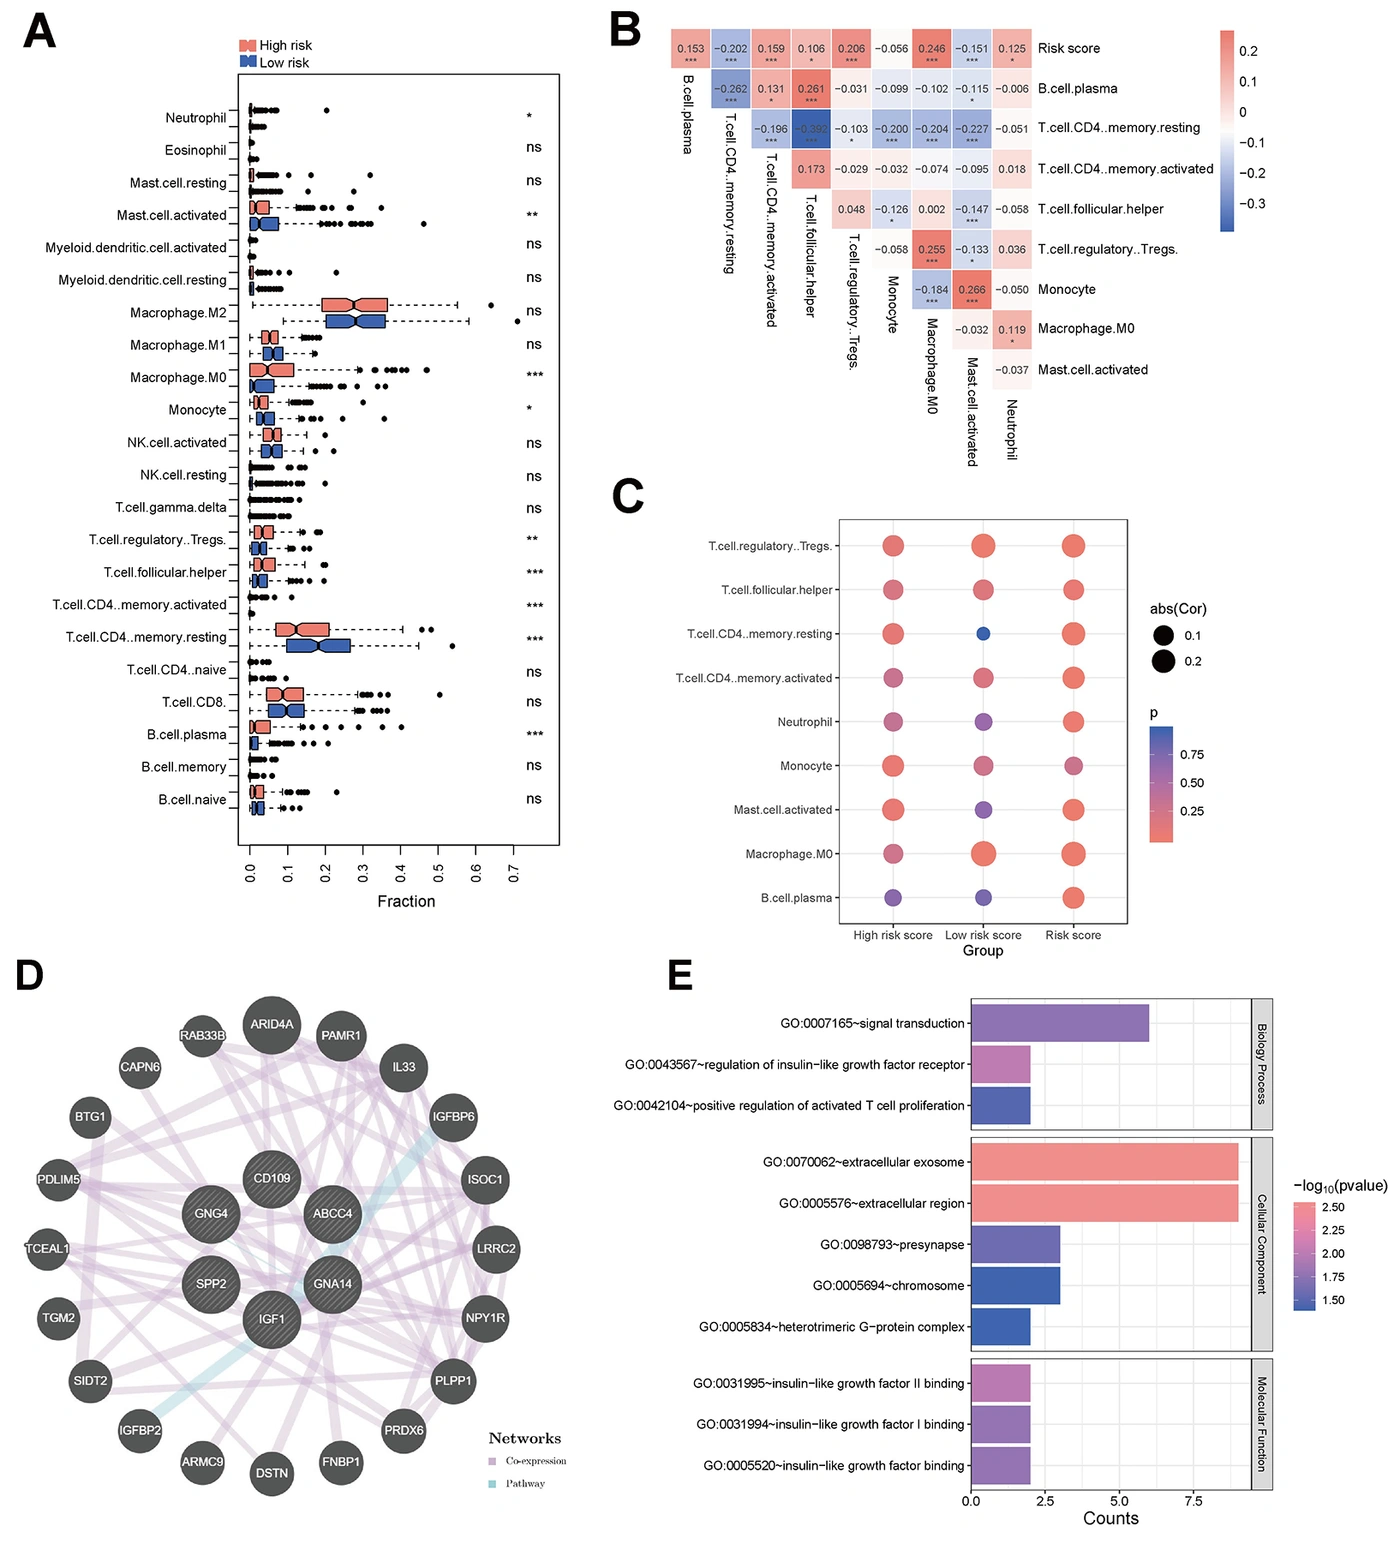
Figure 5.
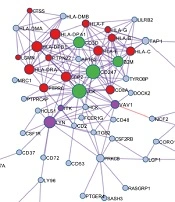
Immune cell infiltration in high-risk and low-risk groups and functional analysis of the 6 optimal differentially expressed platelet-related genes. A, Distributions of immune cell infiltration proportions by risk group. B, Heatmap of correlations between risk score and differentially infiltrated immune cells. Red and blue indicate positive and negative correlations, respectively; values are correlation coefficients. C, Correlations between risk score and differentially infiltrated immune cells in the high-risk, low-risk, and overall groups. Point color indicates the P value, and point size indicates the absolute correlation coefficient, showing the significance and strength of associations. D, Interaction network of the 6 signature DE-PRGs constructed using GeneMANIA. Purple edges indicate coexpression, and light blue edges indicate pathway associations. *P < 0.05, **P < 0.01, ***P < 0.005.
A network of the 6 optimal DE-PRGs was constructed using GeneMANIA (Figure 5D). Genes in the network were significantly enriched in 3 biological processes, including “GO:0043567~regulation of insulin-like growth factor receptor,” “GO:0007165~signal transduction,” and “GO:0042104~positive regulation of activated T cell proliferation,” as well as in 5 cellular component terms and 3 molecular function terms (Figure 5E).
4.6. Construction of Drug Networks Associated with Signature DE-PRGs
Small molecules associated with the 6 optimal DE-PRGs were selected, yielding 90 pairs of associations. As shown in Figure 6, 25 small molecules were associated with these genes, including acetaminophen, aflatoxin B1, and arsenic trioxide.
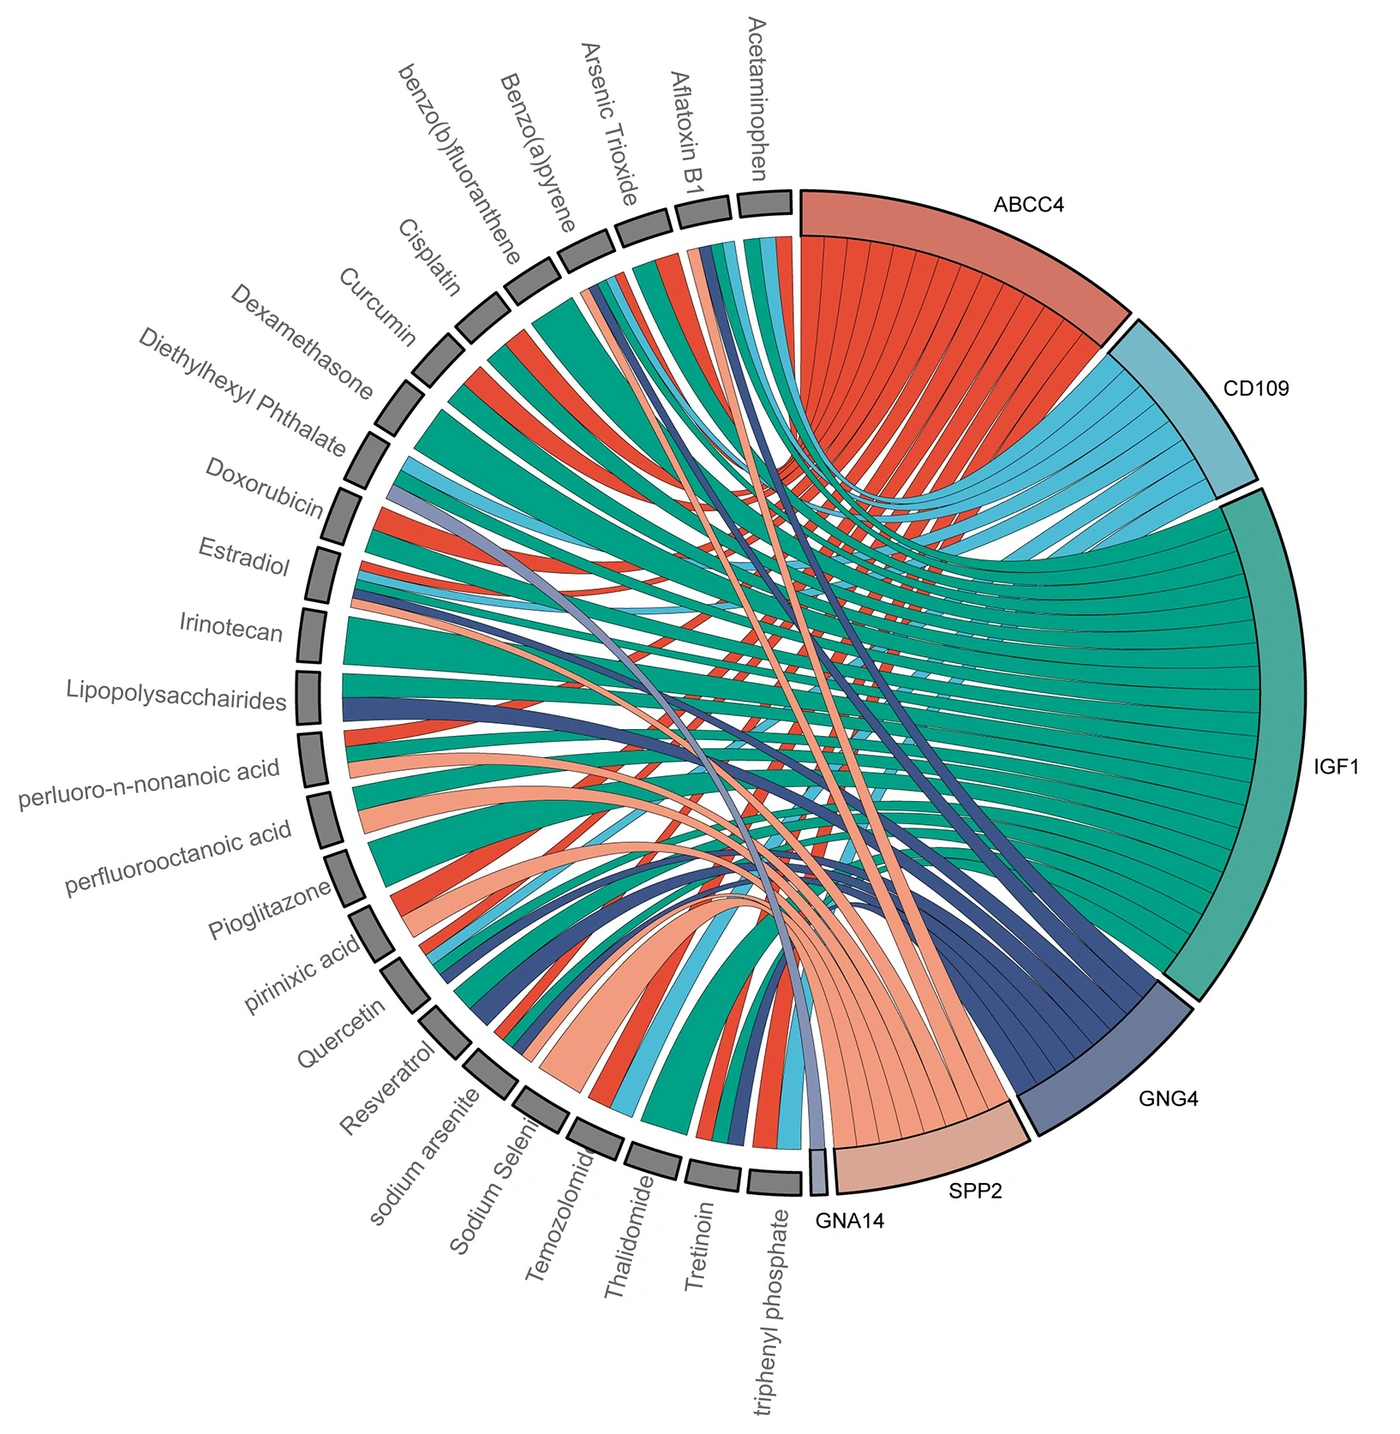
Figure 6.
Association network of the 6 optimal differentially expressed platelet-related genes and 25 disease-related factors.
5. Discussion
Evidence of crosstalk between platelets and tumor cells is growing (26, 27). In this study, 6 optimal DE-PRGs (ABCC4, CD109, IGF1, GNG4, SPP2, and GNA14) were prognostic in HCC, with AUCs of 0.776 in the training set and 0.764 in the external validation set. A nomogram integrating the risk score, age, and pathologic stage achieved AUCs of 0.771, 0.790, and 0.777 for 1-, 3-, and 5-year overall survival, respectively. Several prognostic models have been developed previously, with varying predictive performance. For example, a model based on 3 genes (PAFAH1B3, SERPINE1, and AP3B1) yielded AUCs of 0.754, 0.657, and 0.688 at 1, 2, and 3 years, respectively (7). A risk signature based on 12 PRGs developed by Li et al. yielded corresponding AUCs of 0.772, 0.731, and 0.717 (14). More recently, Zhang et al. developed a 3-gene model (CCNJL, NR0B1, and TRIM54) that combined a platelet signature score and a risk score, with AUCs of 0.83, 0.76, and 0.79 at 1, 2, and 3 years, respectively (12). Incorporating additional factors may therefore improve predictive performance.
The 6 optimal DE-PRGs have been investigated in several malignancies, including HCC. SPP2 downregulation has been observed in HCC, and this gene is involved in liver fibrosis, cirrhosis, and metabolic homeostasis in HCC (28). ABCC4, a member of the ATP-binding cassette transporter superfamily, functions as a membrane efflux transporter and is expressed in several tissues (29). Recent research has identified ABCC4 as a potential therapeutic target in pancreatic cancer, suggesting a role in its pathophysiology and opportunities for targeted treatment (30). CD109 encodes a glycosylphosphatidylinositol-anchored glycoprotein in the α2-macroglobulin/C3/C4/C5 protein family, which is characterized by a thioester-containing domain (31). These proteins are involved in immune regulation and extracellular matrix interactions. In lung adenocarcinoma, CD109 upregulation promotes metastasis through activation of Hippo-YAP (Yes-associated protein) signaling, driving epithelial–mesenchymal transition and the acquisition of cancer stem cell properties (32). IGF1 and IGF2 can influence several tumor-associated biological processes, including maintenance of cell function, cell survival, target cell differentiation, and growth induction (33). GNA14, a member of the G-protein α family, harbors mutations that contribute to cancer development and progression (34). GNG4, 1 of the 14 γ subunits of the human G-protein complex, participates in GTPase activity, GDP–GTP (Guanosine Triphosphate-Guanosine Diphosphateexchange), and interactions between G proteins and their effectors. GNG4 hypermethylation and consequent downregulation have been reported in bladder cancer (35), whereas GNG4 upregulation has been observed in colorectal cancer (36). These genes may be promising biomarkers for HCC treatment.
In this study, 9 immune cell populations differed significantly between the high-risk and low-risk groups, including plasma B cells, Tregs, M0 macrophages, and activated mast cells. Continuous exposure to antigens is thought to drive immune cell infiltration, enabling tumors to evade host defenses (37). In HCC, Tregs are enriched in tumor tissues, and their role in suppressing effector T-cell function has been well documented (38). Hepatocarcinogenesis is modulated by dynamic crosstalk between malignant and immune cells. Previous studies have associated myeloid-derived suppressor cells and Tregs in the tumor microenvironment with poor prognosis, whereas dendritic cells, natural killer cells, and T cells have been associated with favorable prognosis (39). Monitoring the immune contexture is therefore relevant to patients with HCC.
5.1. Study Limitations
This study has several limitations. Although the predictive performance of the prognostic model and the 6 core signature genes was validated using GSE121248 and GSE76427, clinical applicability requires further confirmation using large, comprehensive datasets of patients with HCC. The pathways associated with these genes and the mechanisms through which they regulate HCC progression require in vitro validation. The observed associations between genes and immune cell infiltration are hypothesis-generating and require validation through immunotherapy response analyses or prospective clinical cohorts.
5.2. Conclusions
This study evaluated the prognostic potential of PRGs in HCC. By integrating HCC-related DEGs with PRGs, 6 optimal DE-PRGs (ABCC4, CD109, IGF1, GNG4, SPP2, and GNA14) were identified and used to construct a risk-score model. The model distinguished high-risk from low-risk patients in the training and validation sets, with AUCs of 0.776 and 0.764, respectively. A nomogram integrating age, pathologic stage, and risk score showed good predictive performance for 1-, 3-, and 5-year survival, providing a potential tool for prognostic assessment in HCC. Immune infiltration analysis showed significant associations between the risk score and several immune cell types. Drug network analysis identified 25 potential small-molecule compounds, providing preliminary leads for future functional and translational research.