
1. Background
The novel coronavirus disease 2019 (COVID-19) was recognized in late 2019 as a cluster of cases of viral pneumonia in Wuhan, China. Since then, it spread swiftly from continent to continent, resulting in a pandemic (1). The clinical signs and symptoms of COVID-19 are different at the onset of the disease. Fever (83 - 99%), cough (59 - 82%), anorexia (40 - 84%), fatigue (44 - 70 %), shortness of breath (31 - 40 %), sputum production (28 - 33 %), and malaise (11 - 35 %) were the major presenting clinical symptoms of SARS-CoV-2 infection (2). Severe complications such as acute respiratory distress syndrome (ARDS), septic shock, and multi-organ failure may occur in 20% of the infected patients. Viral pneumonia, which can progress to ARDS, is a leading cause of morbidity and mortality from COVID-19 infection. The risk of mortality infected with COVID-19 is 3 to 6 percent (2-4). The mortality risk in patients with COVID-19 is significantly higher in co-morbidities such as hypertension, diabetes, and coronary heart disease (5). Patients with cancer are highly vulnerable in the COVID-19 pandemic due to the immune-compromised state of cancer or its treatment and co-morbidities. Recent studies have shown that patients with COVID-19 malignancy are more likely to have severe and fatal complications (4, 6-8). Patients with a history of cancer, especially those receiving anticancer therapy, are at higher risk of COVID-19 mortality (9, 10). Since the pandemic began, treating patients with cancer safely and rationally has become a continuous challenge for healthcare providers (11). The distinct risk factors such as Chemotherapy and other immunosuppressive treatments need to be balanced with the risk/benefit of short-term and long-term consequences of postponing cancer treatment in patients with COVID-19 infection.
Amidst the COVID-19 pandemic, healthcare providers must conduct risk-benefit analyses for individual patients regarding the use of chemotherapy. Several studies have shown that chemotherapy was not associated with mortality following COVID-19 (12, 13).
In contrast, several studies and articles have reported that chemotherapy has increased mortality (7, 14, 15). The apparent inconsistencies across studies may reflect the limited information available regarding the effect of chemotherapy in patients with a history of cancer on the mortality rate from COVID-19 disease. Therefore, this study was designed to fill this gap of knowledge.
2. Objectives
This study aimed to compare the COVID-19 mortality rate in cancer patients with and without a history of chemotherapy.
3. Methods
3.1. Participants and Setting
This study occurred in an urban primary and secondary academic hospital in Ilam, Iran. Since March 2020, this hospital has become a dedicated care center for treating patients with COVID-19 infection. In this study, all patients with COVID-19 who were admitted to the hospital were eligible for enrolment into the Ilam COVID-19 monitoring and evaluation project (Ilam-CEMP). The Ilam-CEMP is one of the first registries in the country (Iran) that enables near real-time monitoring of essential data and trends about the effect of COVID-19 on patients. Inclusion criteria were patients whose tests were positive for SARS-Cov-2 from a nasopharyngeal swab. This study's primary outcome was in-hospital mortality or discharge from the hospital.
The registry was launched in March 2020 and had 2350 records as of March 2021. In this study, 64 COVID-19 patients with cancer were included, of which 27 of them underwent chemotherapy. At the same time, 256 controls matched cases by age, gender, and without a history of cancer were randomly selected from the same registry dataset. Patients with active cancer were defined as those receiving treatments for cancer such as adjuvant, radical, curative, neo-adjuvant settings, or chemotherapy within the past two months. The Ilam-CEMP database of COVID-19 patients with cancer was launched with the support of the Ilam University of Medical Sciences Oncology professional bodies. The premise behind the database design was to utilize a public health surveillance registry to update the information as possible. Furthermore, the activities are designed to yield a suitable surveillance network to preliminary support healthcare outcomes research and other research initiatives to guide reliable rapid clinical decision-making following the Iran Ministry of health policy framework for health and social care research.
3.2. Design
This is a retrospective study, even though the data was taken prospectively from the Ilam-CEMP clinical data registry. The Ilam University of Medical Sciences Ethics Committee approved this study. The follow-up period was calculated from the initial diagnosis to the date of death or recovery and discharge.
3.3. Data Analysis
Data were analyzed in Stata.10 software using cox proportional hazard regression models. The significance level < 0.2 were considered in the univariate model to identify potentially relevant variables. So, the univariate model was used only to select variables to enter the final (multivariate) model based on Hosmer and Lemeshow's (2003) suggestion (16). The result was based on multivariate at the significant level of 0.05. Proportional hazard assumption (PH) was checked based on the Schoenfeld residuals test, which indicated that variables do not violate the PH assumption.
4. Results
A total of 2350 patients with COVID-19 in an urban primary and secondary academic hospital in Ilam, Iran, between March 5, 2020, and March 21, 2021, were included in the registry project. We analyzed 64 (2.7%) patients diagnosed with cancer and symptomatic COVID-19. In this study, 64 patients with cancer were compared to 256 patients (by age and gender) without cancer at Iran's urban academic hospital.
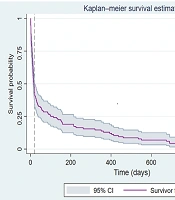
Out of 64 patients with cancer, 28 (44%) were treated with chemotherapy in the last two months. Just under two-thirds (56%, N = 36) of patients with cancer required intensive care unit (ICU) admission, and up to 37% (N = 24) needed mechanical ventilation. More than two-fifths (45%, N = 29) of the patients with cancer died in the hospital during the follow-up period. Over half of those (57%, N = 16) who received chemotherapy for cancer died in the hospital. During the 12-month follow-up period, 35(13.6%) patients in the control group died. The median survival of patients with cancer was 17 days compared with 28 days for the control group (Figure 1).
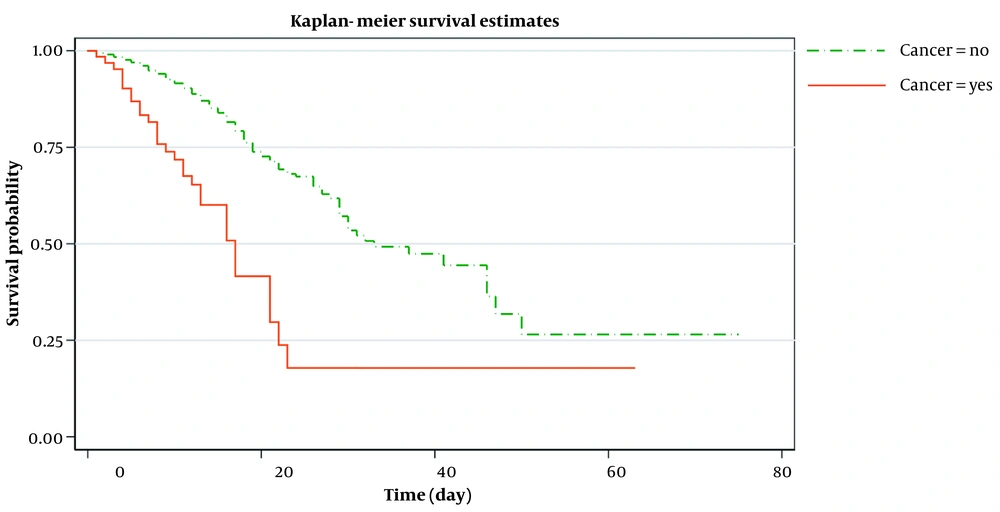
Figure 1.
Kaplan-Meir estimated survival after symptom onset and death or hospital discharge in cancer and non-cancer patients
The baseline socio-demographic and clinical measures were compared between the case and control groups (Table 1). Cancer was associated with significantly more frequent ICU admission than the non-cancer patients (control group) (P < 0.001). Cox proportional hazard regression model (PH) at both univariate and multivariate levels was used to estimate the association between chemotherapy administration in cancer patients with COVID-19 and the death rate. The PH assumption was met for all included variables.
Table 1.
Demographic and Clinical Variables of Patients with SARS-CoV-2 Infection a
| Characteristics | Cancer | Non-cancer | P-Value |
|---|---|---|---|
| Total number | 64 | 256 | - |
| Age (y) | 63.9 ± 2.5 | 62.1 ± 0.8 | 0.30 |
| Sex | 0.96 | ||
| Male | 34 (53.1) | 135 (52.7) | - |
| Female | 30 (47) | 121 (47.2) | - |
| BMI (kg/m2) | 26.2 ± 0.9 | 27.2 ± 0.3 | 0.23 |
| Smoking status | 0.43 | ||
| Non-smoker | 59 (98) | 240 (94 ) | - |
| Ex-smoker | 1 (1.7) | 4 (1.6) | - |
| Smoker | 0 (0) | 7 (2.7) | - |
| Unknown | 4 (6.3) | 5 (2) | - |
| Intensive therapy unit | 36 (56.2) | 68 (26.6) | < 0.001 |
| Co-morbidities | |||
| Diabetes | 11 (17.2) | 64 (25) | 0.19 |
| Cardiovascular disease | 14 (21.9) | 76 (29.7) | 0.21 |
| Hypertension | 21 (32.8) | 97 (37.9) | 0.45 |
| Chronic lung disease | 20 (7.8) | 5 (7.8) | 1.00 |
| Chronic kidney disease | 14 (5.5) | 5 (7.8) | 0.48 |
| Cerebrovascular disease | 8 (3.1) | 2 (3.1) | 1.00 |
Abbreviation: BMI, body mass index.
a Values are expressed as No. (%) or mean ± SE.
Univariate Cox regression was conducted for each predictor (Table 2). Our findings indicated that COVID-19 mortality was significantly associated with the history of active cancer, age, gender, body mass index (BMI), ICU admission, chronic kidney disease (CKD), chronic lung disease, diabetes, cerebrovascular disease, and chemotherapy given in the past two months before confirmed COVID-19. Subsequently, variables that achieved a P-value < 0.2 in the univariate analysis were entered into the multivariate Cox regression model.
Table 2.
Univariate Cox Proportional Hazard Analysis for Related Factors of COVID-19 Mortality
| Characteristics | Crude Hazard Ratio (95% CI) | P-Value |
|---|---|---|
| Age (y) | 1.03 (1.01 - 1.05) | 0.005 a |
| Sex | ||
| Female | 1 b | - |
| Male | 1.76 (1.07 - 2.95) | 0.03 a |
| BMI | 0.94 (0.87 - 0.99) | 0.04 a |
| Smoking status | ||
| Non-smoker | 1 | - |
| Ex-smoker | 0.61 (0.14 - 2.62) | 0.49 |
| Smoker | 1.62 (0.50 - 5.19) | 0.42 |
| Intensive therapy unit | 10.8 (5.11 - 22.72) | < 0.001 a |
| Chronic kidney disease | 1.87 (0.85 - 4.11) | 0.12 a |
| Cardiovascular disease | 1.16 (0.69 - 1.96) | 0.58 |
| Hypertension | 0.93 (0.56 - 1.56) | 0.79 |
| Chronic lung disease | 2.06 (1.01 - 4.19) | 0.04 a |
| Diabetes | 1.45 (0.84 - 2.51) | 0.18 a |
| Cerebrovascular disease | 2.97 (1.18 - 7.51) | 0.02 a |
| Active cancer | 2.79 (1.70 - 4.59) | < 0.001 a |
| Chemotherapy in the past three months c | 3.14 (1.77 - 5.57) | < 0.001 a |
a Significant.
b Reference category.
c Chemotherapy administered between 8 and 2 weeks before SARS-CoV-2 test positivit.
To adjust the effects of confounders and estimate a pure association between chemotherapy administration in cancer patients with COVID-19 and death rate, we used an individual matching design for age and gender variables. Cox multivariate analysis showed that active cancer and ICU admission were significantly associated with COVID-19 mortality (Table 3). Gender and diabetes appeared to be associated with COVID-19 mortality; however, these associations did not reach statistical significance. In the adjusted model (adjusted Hazard Ratio, 2.27; 95%CI, and 1.25 - 4.13; P = 0.007), cancer substantially increased the mortality risk of COVID-19 infection.
Table 3.
Cox Proportional Hazard Analysis for Related Factors of Mortality in Patients with COVID-19 in the Multivariate Model
| Risk Factors | Adjusted Hazard Ratio (95% CI) | PH Assumption a | P-Value |
|---|---|---|---|
| Age (y) | 1.00 (0.97 - 1.02) | met | 0.87 |
| Sex | met | - | |
| Female | 1 b | - | - |
| Male | 1.77 (0.95 - 3.29) | - | 0.07 |
| BMI | 0.95 (0.88 - 1.03) | met | 0.25 |
| Intensive therapy unit | 6.68 (2.97 - 15.01) | met | < 0.001 c |
| Active cancer | 2.27 (1.25 - 4.13) | met | 0.007 c |
| Chronic kidney disease | 1.42 (0.59 - 3.45) | met | 0.43 |
| Chronic lung disease | 1.71 (0.78 - 3.71) | met | 0.18 |
| Cerebrovascular disease | 2.36 (0.70 - 7.89) | met | 0.16 |
| Diabetes | 1.81 (0.92 - 3.56) | met | 0.08 |
a Proportional hazard assumption.
b Reference category.
c Significant.
Figure 2 shows the estimated smoothed-hazard function for the case and control groups adjusted for covariates. A subgroup analysis was then conducted to see how receiving chemotherapy within eight weeks before confirmed COVID-19 affected the mortality rate following COVID-19 infection compared to those who did not receive chemotherapy. The graph of the unadjusted hazard curve obtained from fitting a Cox model is illustrated in Figure 3. The figure indicates that cancer patients with chemotherapy have a higher hazard rate than patients without that. Our findings indicated no significant association between the mortality rate from COVID-19 infection and receiving chemotherapy in the last two months before confirmed COVID-19 (adjusted HR; 1.65, 95% CI: 0.60 - 4.56, P = 0.33) compared to patients who did not undergo chemotherapy (Table 4).
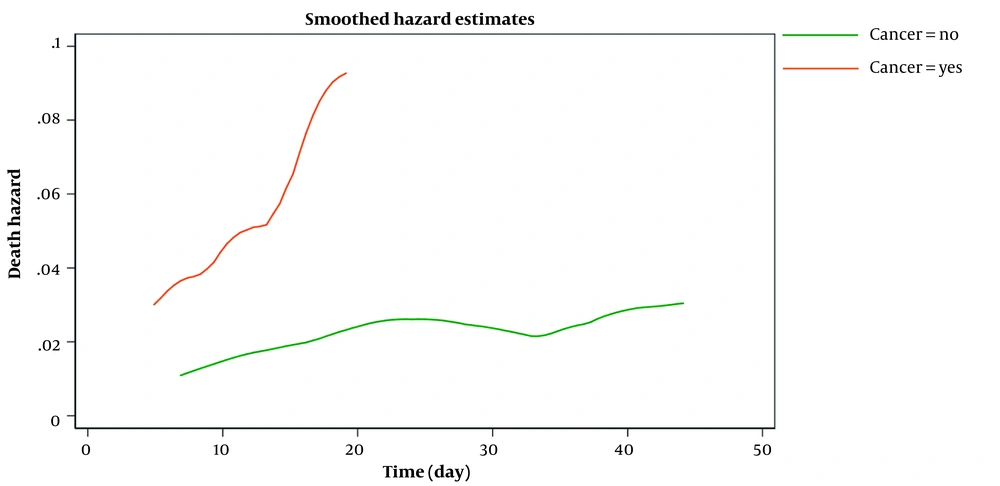
Figure 2.
Smoothed death hazard after symptom onset and death or hospital discharge in cancer and non-cancer patients (adjusted model)
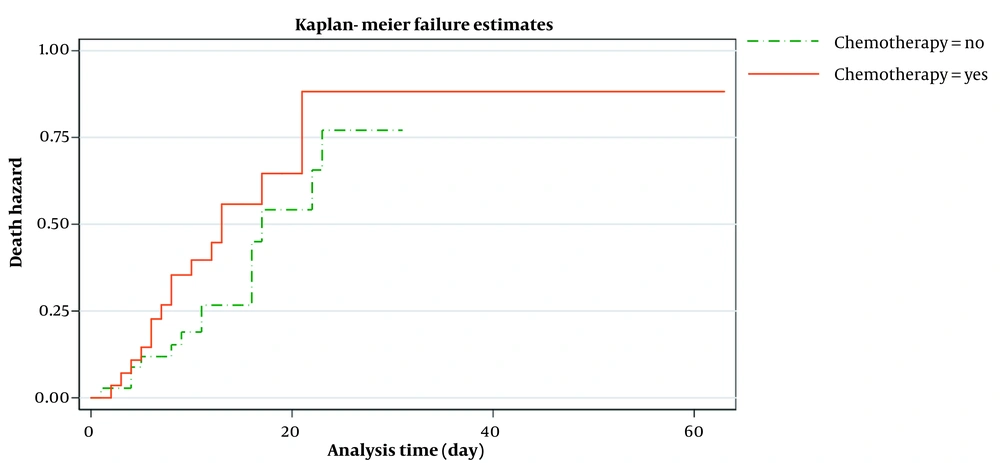
Figure 3.
Kaplan-Meir estimated hazard after symptom onset and death or hospital discharge in cancer patients with and without chemotherapy
Table 4.
Multivariate Cox Analysis Comparing Chemotherapy in Patients with Cancer and COVID-19, Adjusted for Other Variables
| Risk Factors | Adjusted Hazard Ratio (95% CI) | PH Assumption a | P-Value |
|---|---|---|---|
| Age (y) | 0.99 (0.95 - 1.02) | met | 0.46 |
| Sex | met | - | |
| Female | 1 b | - | - |
| Male | 1.40 (0.46 - 4.26) | - | 0.55 |
| Intensive therapy unit | 5.28 (1.54 - 18.17) | met | 0.01 c |
| Hypertension | 0.81 (0.26 - 2.58) | met | 0.72 |
| Chronic lung disease | 0.95 (0.25 - 3.53) | met | 0.94 |
| Cerebrovascular disease | 5.02 (0.82 - 30.88) | met | 0.08 |
| Metabolic disease | 14.52 (1.23 - 171.67) | met | 0.03 c |
| Chronic kidney disease | 1.23 (0.28 - 5.36) | met | 0.78 |
| Chemotherapy in the past two months d | 1.65 (0.60 - 4.56) | met | 0.33 |
a Proportional hazard assumption.
b Reference category.
c Significant.
d Chemotherapy administered between 8 and 2 weeks before SARS-CoV-2 test positivity.
5. Discussion
The COVID-19 pandemic has greatly affected multiple aspects of cancer research. While having a remarkable effect on the health care system globally, the COVID-19 pandemic created unique challenges and interrupted usual care for patients with cancer (17). The clinical characteristics and interaction of COVID-19 with co-morbidities and anticancer therapies are poorly stated and based on small sample size retrospective studies. Due to the low prevalence of cancer and COVID-19 coexistence, healthcare providers will only see a few patients with both conditions. As a result, developing national and international data-sharing policies is critical during this unprecedented demand for rapid learning and evidence of best practices. The Ilam-CEMP database was designed to answer essential questions about co-morbidity, cancer treatment, and COVID-19. This database provides clinically meaningful output and supports rapid and rational clinical decision-making. We attempted to describe the socio-demographic, clinical characteristics, and outcomes of COVID-19 patients with and without malignancy and sought to assess how the presence of cancer and the receiving chemotherapy affect the mortality rate following COVID-19 infection. In our cohort of patients with COVID-19, death was observed in many patients. Our analysis indicated that more than two-fifths of the patients with cancer died in the hospital during the follow-up period. Previous reports suggested that patients with cancer are at higher risk of COVID-19 infection and experience higher mortality than the general population (18). Our analysis indicated that just over half of those who received chemotherapy for cancer died in the hospital. Our results align with the previous report that showed patients with cancer, especially those receiving chemotherapy, are at increased risk of mortality following COVID -19 infection (14). Risk factors for COVID-19 mortality were found to concur well with the existing literature in which history of active cancer, age, gender, BMI, ICU admission, CKD, chronic lung disease, diabetes, cerebrovascular disease, and chemotherapy given in the past two months before confirmed COVID-19 predicted mortality in COVID-19 (19, 20). The admission rate to ICU was high, at about 56%, compared with a death rate of approximately 45%. This finding raises questions about whether having the diagnosis of cancer and COVID-19 increases the needs of these patients for intensive care support. The findings of this study indicated that chemotherapy is given within 8 weeks before confirmed COVID-19 was not associated with COVID-19 mortality compared to those who had not received any treatment at the time of the study. Multivariate analysis to delineate the effect of giving chemotherapy within 8 weeks before confirmed COVID-19 on the mortality rate following COVID-19 infection did not reach statistical significance, possibly due to the relatively small sample in our cohort.
Although the numbers of patients were small, similar results were reported in previous findings (12, 15).
Further investigations with more patients are needed to confirm or refute this finding. To sum up, cancer is an independent risk for mortality following COVID-19. Continuous "self-shielding" policies should be encouraged to reduce the risk of viral transmission and severe COVID-19 (12). Patients with cancer should have access to the intensive care unit. However, in response to a frequently asked clinical question from patients with cancer about whether chemotherapy enhances the risk of dying from COVID-19 infection and their cancer-related risks, our response should be not necessarily so (12).
Therefore, we encourage clinicians to mainly discuss the benefit of receiving chemotherapy rather than the potential risk from COVID-19. Our findings suggest that advanced age and co-morbidities have a major role in cancer and COVID-19 mortality. This has significant implications for elderly patients with cancer as they often have other co-morbidities. Therefore, clinicians must balance the risks and benefits before committing elderly patients or patients with co-morbidities to chemotherapy. Further studies in a large cohort of patients with longer follow-up periods are needed to completely evaluate how variations in demographic, socio-economic, and geographical backgrounds play a role in changing the risk profile of cancer and co-morbidities in COVID-19. We acknowledge that there were some limitations to our study. Our analysis was based on RT-PCR, in which a false negative was not considered. As a result, cases of COVID-19 in patients with cancer may be under-reported in our study, especially those with no or mild symptoms that do not need hospital care. Prioritization and delays in specific cancer therapies could have introduced bias into our cancer cohort that we could not exclude. A selection bias may have occurred because of poor performance in some patients who have stopped chemotherapy.
The presence of selection bias can limit our capacity to evaluate the actual risk of anticancer treatments in patients with better performance status. However, we tried to address these limitations using multivariate analysis with age and co-morbidities adjustment. As a result, this study has much strength. We ensure a robust study design using a cohort design, with reasonably well-matched pairs in groups in a single institution. Only patients from the same center were included in our study to minimize the variation due to different geographical and demographical outcomes following COVID-19.
5.1. Conclusions
The findings suggest the claim that chemotherapy will increase the patient's risk of dying from COVID-19 should be viewed with caution. In addition, risk factors such as age and co-morbidities should be considered when prioritizing patients for anticancer therapy rather than the potential benefit from anticancer therapy alone. These recommendations help inform decisions about the treatment of established diseases and the continuation of clinical research.