
1. Background
Colorectal cancer (CRC) ranks as the third most prevalent cancer and the fourth leading cause of cancer-related fatalities globally. The chance of experiencing CRC is nearly 4% to 5%, and the odds of developing the disease are related to individual characteristics or behaviors, like age, pre-existing conditions, and lifestyle choices. The complexities in treating CRC necessitate realizing the molecular foundation of each person's susceptibility to the disease and specifying the elements that trigger tumor formation, promote its growth, and affect its response or resistance to anti-cancer drugs (1-3).
Adipose tissue has been acknowledged as a functioning endocrine organ influencing human physiology and health (4). Adipokines are cell-signaling molecules generated by body fat that exhibit functional tasks in metabolic/energy status, obesity, and inflammation. C1q/TNF-related proteins (CTRPs) are a new family of secretory adipokines that include 15 members with structural and functional features similar to adiponectin. Both adiponectin and CTRPs are members of the CTRP superfamily, which has been established to have diverse and contrasting impacts on lipid metabolism, inflammation, apoptosis, cardiovascular disease, aging-related disease, and ischemic injury (5, 6). Nevertheless, there is little research on the role of CRTPs related to cancers and malignancies.
The CTRP9 has gained increased traction in the past decade due to its essential role in physiological and pathological states. This glycoprotein has various modifications in its collagen domain after translation, such as hydroxylated/glycosylated lysines and hydroxylated prolines (7, 8). The CTRP12, also called adipolin, is mainly released by fat tissue. Anti-inflammatory effects and insulin-sensitizing are two known properties of this adipocytokine. Studies suggest that obesity-induced pathological conditions reduce adipolin expression in adipose tissue. However, the mechanism of expression regulation of adipolin is not completely understood (9-11).
2. Objectives
So far, serum changes of adipokines in various diseases and their associations with disease severity have been extensively studied. However, few studies have focused on serum changes of adipokines, especially CTRPs, in malignancies and cancers. We purposed to determine the serum values of CTRP9 and CTRP12 in CRC patients (CRCs) and compare them to healthy controls (HCs). We also examined the correlation of these adipokines with CRC pathology, laboratory tests, and the paraclinical data of these patients.
3. Methods
This case-control study included 44 CRCs and 44 HCs. CRC patients were diagnosed through physical examination and colonoscopy. The HCs with diabetes, cardiovascular disease, inflammatory conditions, and CRC patients consuming vitamin D supplements were excluded from the study. CRC samples were obtained from a previous study (code 110622) with the ethical code: IR.GOUMS.REC.1401.190 approved at the Golestan University of Medical Sciences at 5 Azar Hospital in Gorgan, Iran.
After signing written informed consent according to the Helsinki Declaration Ethical Principle, all HCs donated 5 mL of peripheral blood. Sera were immediately separated by centrifugation at 2500 rpm and stored in a freezer at -70°C until the tests were performed. ELISA kits were used to measure CTRP9 (ZellBio GmbH, Germany; Cat. No: ZB-13848C-H9648), CTRP12 (ZellBio GmbH, Germany; Cat. No: ZB-13692C-H9648), and vitamin D (IDEAL TASHKHIS, Iran; Cat. No: 6724-96) according to the manufacturer's protocol. Fasting blood sugar (FBS), urea, creatinine, and lipid profiles (cholesterol, triglycerides, HDL-c, and LDL-c) were measured, using colorimetric methods.
SPSS v.16 software was used to analyze all data, and GraphPad Prism 5.04 statistical software was utilized to prepare graphs. The normality of variables was checked by the Shapiro-Wilk test. Serum values of both adipocytokines were compared based on nominal and rank variables by Mann-Whitney U-test, independent t-test, and Kruskal-Wallis tests. The correlation of parameters was determined, using Spearman's correlation coefficient test. The receiver operating characteristic (ROC) curve analysis was conducted to evaluate the diagnostic utility of CTRP9 and CTRP12 in distinguishing CRC patients from HCs. The significance level was P-value < 0.05.
4. Results
Two groups were adjusted in age and gender. The FBS and TG were statistically higher in the CRCs compared to HCs, while urea and creatinine were significantly higher in the HCs. Total cholesterol, LDL-C, HDL-C, and 25 (OH) vitamin D were not significantly different between the groups (Table 1).
Table 1.
| Variables | CRCs (n = 44) | HCs (n = 44) | P-Value |
|---|---|---|---|
| Gender (female) | 25 (56.8) | 23 (52.3) | NS |
| Age (y) c | 51.55 ± 13.43 | 50.34 ± 11.06 | NS |
| FBS (mg/dL) d | 128.14 ± 49.95 | 96.30 ± 11.09 | 0.001 e |
| Urea (mg/dL) c | 28.11 ± 7.36 | 31.68 ± 7.88 | 0.031 f |
| Creatinine (mg/dL) d | 0.94 ± 0.22 | 1.07 ± 0.13 | 0.001 e |
| TG (mg/dL) d | 140.25 ± 52.38 | 112.75 ± 41.97 | 0.009 g |
| Total cholesterol (mg/dL) c | 170.36 ± 30.44 | 157.77 ± 33.03 | NS |
| LDL-C (mg/dL) c | 100.75 ± 20.97 | 95.98 ± 25.81 | NS |
| HDL-C (mg/dL) d | 48.39 ± 9.08 | 46.70 ± 9.89 | NS |
| 25 (OH) Vitamin D (ng/mL) c | 31.47 ± 16.36 | 36.98 ± 17.80 | NS |
Abbreviations: NS, not significant; CRC, colorectal cancer; HC, healthy control; ns, not significant; FBS, fasting blood sugar; TG, triglyceride; HDL-c, high-density lipoprotein-cholesterol; LDL-c, low-density lipoprotein-cholesterol.
a Values are expressed as No. (%) or mean ± SD.
b FBS and TG in CRC are significantly higher than in HC, while urea and creatinine in HC are higher than in CRC significantly.
c Independent sample t-test
d Mann-Whitney U test.
e P < 0.001.
f P < 0.05.
g P < 0.01.
The comparison of CTRP9 and CTRP12 between the CRCs and HCs indicated a significant increase in CTRP9 in the CRC patients (P-value = 0.009). However, CTRP12 was not different between the groups (P-value = 0.443), as illustrated in Figure 1A and B.
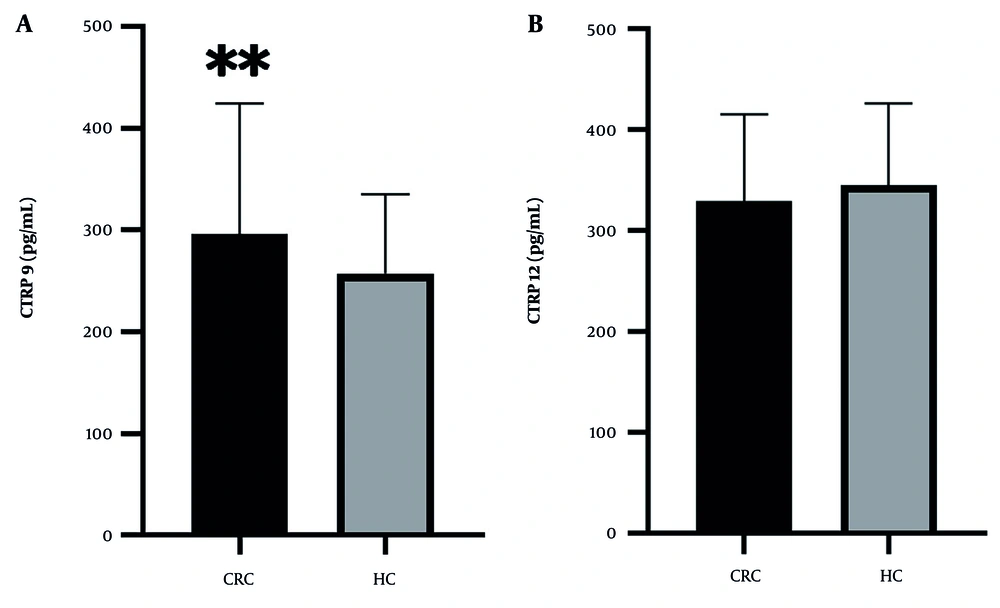
Figure 1.
Comparison of CTRP9 and CTRP12 between colorectal cancer (CRC) and HC. A, In the CRC group, CTRP9 was higher than HC (295.87 ± 128.63 vs 257.46 ± 77.56, P-value = 0.009); B, CTRP12 was not significantly different in CRC from HC (329.39 ± 85.81 vs 344.70 ± 81.45, P-value = 0.443). ** P-value < 0.01, CRC: Colorectal cancer, HC: Healthy control
The compression of CTRP9 based on the history, examination, and paraclinical data of the CRC patients is given in Table 2. The CTRP9 measures were significantly higher in patients with no familial CRC surgery history (P = 0.038) and in patients who passed away because of CRC (0.019).
Table 2.
Compression of CTRP9 and CTRP12 Based on Demographic, History, Examination, and Para Clinical Data of Colorectal Cancer Patients a
| Variables | CRC | CTRP9 (pg/mL) | P-Value | CTRP12 (pg/mL) | P-Value |
|---|---|---|---|---|---|
| Gender b | NS | NS | |||
| Male | 19 (43.2) | 282.47 (101.44) | 315.19 (73.47) | ||
| Female | 25 (56.8) | 278.35 (74.08) | 331.20 (88.19) | ||
| BMI b | NS | NS | |||
| < 25 | 27 (61.4) | 282.47 (81.45) | 331.20 (73.16) | ||
| ≥ 25 | 17 (38.6) | 272.89 (74.07) | 324.00 (83.20) | ||
| Past surgical history b | NS | NS | |||
| Yes | 27 (61.4) | 280.4 (71.1) | 331.20 (81.68) | ||
| No | 17 (38.6) | 283.5 (95.2) | 326.40 (69.72) | ||
| Familial CRC surgery history b | 0.038 c | 0.018 c | |||
| Yes | 8 (18.2) | 246.6 (138.0) | 297.37 (80.05) | ||
| No | 36 (81.8) | 294.8 (75.0) | 333.60 (76.99) | ||
| Alcohol consumption b | NS | NS | |||
| Yes | 9 (20.4) | 30.9.3 (176.4) | 302.40 (144.55) | ||
| No | 35 (79.6) | 277.3 (73.9) | 331.20 (73.47) | ||
| Smoking b | NS | NS | |||
| Yes | 19 (43.2) | 287.6 (102.5) | 331.20 (77.26) | ||
| No | 25 (56.8) | 277.3 (72.2) | 331.20 (80.21) | ||
| Rectal bleeding b | NS | NS | |||
| Yes | 35 (79.6) | 277.3 (73.9) | 367.20 (98.71) | ||
| No | 9 (20.4) | 307.2 (226.5) | 328.80 (74.48) | ||
| Tumor differentiation d | NS | NS | |||
| Well | 19 (43.2) | 283.5 (62.9) | 331.20 (67.66) | ||
| Moderate | 18 (40.9) | 273.2 (100.1) | 331.20 (95.16) | ||
| Poor | 7 (15.9) | 302.4 (143.8) | 324.00 (77.51) | ||
| Pathological T stage d | NS | NS | |||
| T2 | 7 (15.9) | 244.3 (72.2) | 285.52 (77.22) | ||
| T3 | 27 (61.4) | 302.4 (80.8) | 331.20 (68.36) | ||
| T4 | 10 (22.7) | 261.3 (106.3) | 349.20 (75.49) | ||
| Tumor stage b | NS | NS | |||
| I/II | 28 (63.6) | 294.8 (71.4) | 326.40 (79.59) | ||
| III | 16 (36.4) | 173.2 (114.4) | 331.20 (65.66) | ||
| Primary tumor location d | NS | NS | |||
| Ascending colon | 10 (22.7) | 334.7 (157.4) | 342.00 (104.44) | ||
| Transvers colon | 4 (9.1) | 243.8 (126.0) | 309.37 (104.14) | ||
| Descending colon | 8 (18.2) | 283 (219.5) | 331.20 (119.05) | ||
| Sigmoid | 17 (38.6) | 282.5 (68.6) | 336.00 (64.53) | ||
| Rectum | 5 (11.4) | 272.9 (58.2) | 286.37 (97.81) | ||
| Lymph vascular invasion b | NS | NS | |||
| Present | 28 (63.6) | 283.0 (70.9) | 331.20 (78.31) | ||
| Not identified | 16 (36.4) | 278.9 (82.6) | 330.00 (75.43) | ||
| Perineural invasion b | NS | NS | |||
| Present | 14 (31.8) | 273.2 (156.3) | 299.07 (89.51) | ||
| Not identified | 30 (68.2) | 283.0 (62.3) | 331.20 (71.79) | ||
| Mortality e | 0.019 c | NS | |||
| Dead | 4 (9.1) | 422.7 (493.2) | 375.60 (352.45) | ||
| Alive | 40 (90.9) | 277.8 (72.4) | 330.00 (76.07) |
Abbreviations: NS, not significant; IR, interquartile range; BMI, Body Mass Index; CTRP9, C1q-TNF related protein 9; CTRP12, C1q-TNF related protein 12; CRC, colorectal cancer.
a Values are expressed as No. (%) or median (IR).
b Mann-Whitney U test.
c P < 0.05.
d Kruskal–Wallis test.
e Independent t-test.
As depicted in Figure 2, Spearman's correlation coefficient test displayed a significant association between the serum values of CTRP9 and CTRP12 (R = 0.591, P < 0.001). However, no significant correlations were observed between these two adipokines regarding CEA, CA19.9, BMI, FBS, TG, total cholesterol, LDL-c, HDL-c, urea, creatinine, or vitamin D.
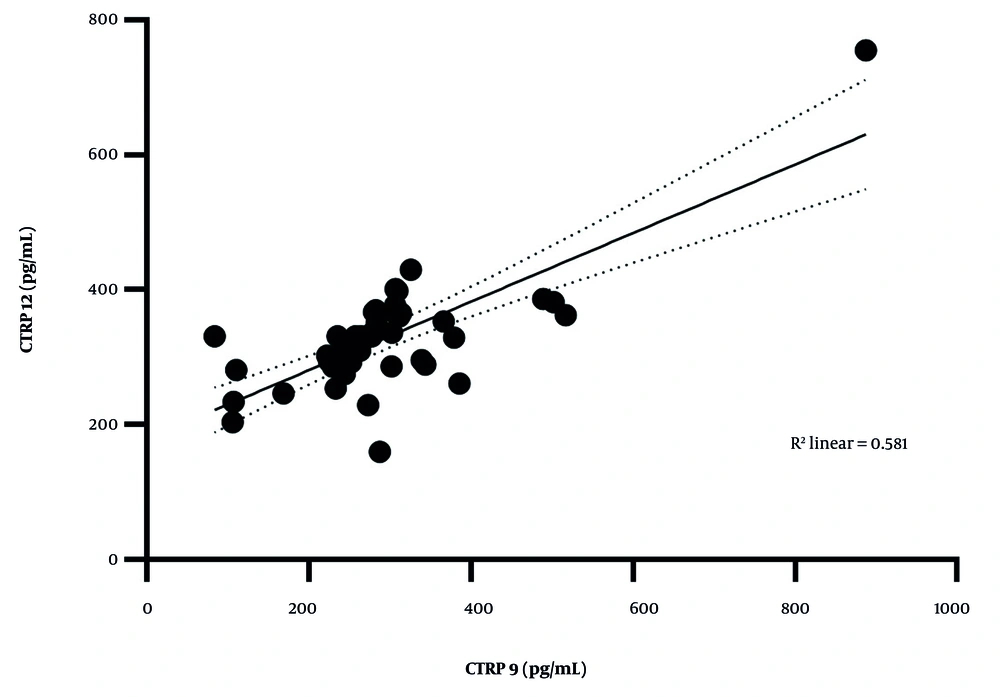
Figure 2.
Positive and significant correlation between serum levels of CTRP9 and CTRP12. Spearman correlation analysis demonstrated that CTRP9 and CTRP12 have a positive correlation in colorectal cancer (CRC) patients (R = 0.591, P < 0.001). CTRP9: C1q-TNF related protein 9, CTRP12: C1q-TNF related protein 12.
The ROC curve analysis revealed that CTRP9, with a cut-off point > 279.89 pg/mL, exhibited an area under the curve (AUC) of 0.661 (95%CI: 0.544 - 0.778; P = 0.0093). This eventuates a sensitivity of 52.27% (95%CI: 37.94% - 66.25%), a specificity of 84.09% (95%CI: 70.63% - 92.07%), and a likelihood ratio of 3.29, as illustrated in Figure 3. In contrast, CTRP12 did not provide appropriate values for discriminating the CRC patients from the HCs (AUC = 0.452: P = 0.443).
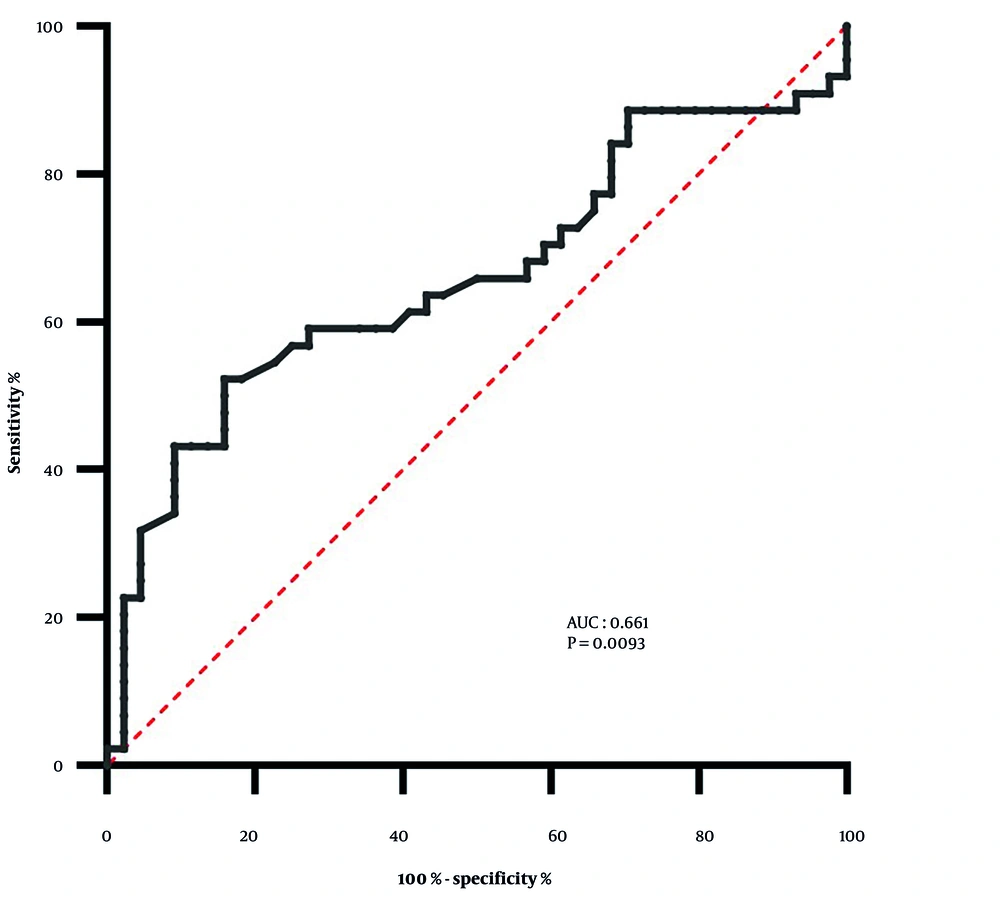
Figure 3.
Diagnostic utility of CTRP9 in colorectal cancer (CRC). Receiver operating characteristic (ROC) curve was performed to evaluate the efficiency of CTRP9 in CRC diagnosis. At the optimal cut-off value of 279.89 pg/mL, CTRP9 presents a sensitivity of 52.27% (95%CI: 37.94% - 66.25%), a specificity of 84.09% (95%CI: 70.63% - 92.07%), and a likelihood ratio (LR) of 3.29 for diagnosing CRC. CTRP9: C1q-TNF related protein 9, CTRP12: C1q-TNF related protein 12.
5. Discussion
This study intended to determine the serum measures of CTRP9 and CTRP12 in CRCs and compare them to HCs. Our results showed that, unlike CTRP12, the amount of CTRP9 was higher in the CRC patients. In addition, CTRP9 serum values were significantly increased in the CRC patients who died within 3 months of follow-up. Both CTRP9 and CTRP12 serum levels were significantly lower in patients with a family history of surgery due to CRC.
CTRP9 is one of the secretory paralogs of adiponectin. Joshi et al. observed a null connection between adiponectin and CRC (12). In Guadagni et al., CRC patients had lower values of adiponectin in their serum compared to HCs (13). To our best knowledge, no study has measured the serum levels of CTRP9 in CRC patients, making our study the first in this regard. Our results also showed for the first time that CTRP9 could serve as a diagnostic marker with appropriate specificity for CRC.
CTRP12, or adipolin, is an adipokine with anti-inflammatory activities that plays a role in glucose control by increasing insulin sensitivity. The role of CTRP12 has been significantly investigated in metabolic disorders and cardiovascular diseases (14-16). However, studies have been limited regarding the role of this adipokine, secreted from adipose tissue, in malignancies and cancers.
Previous studies have investigated the relationship between several adipokines and obesity in cancerous patients (17). Obesity has been considered a predisposing and a risk factor for many cancers, including CRC (18). It has been shown that obese people have increased expression levels of different adipokines, such as adiponectin, leptin, and resistin, compared to lean people (19). However, our results did not suggest an increase in the serum levels of CTRP9 and CTRP12 in CRC patients with BMI > 25 compared to patients with normal BMI. In a study by KisKac et al., a direct correlation was observed between CTRP9 and vitamin D. However, such a relationship was not found in our study (20).
This study displayed a direct correlation between the serum values of CTRP9 and CTRP12 in CRC patients. To the best of our knowledge, there has been no prior research evaluating the relationship between the serum levels of these two adipokines. Finding the mechanism and cause of the relationship between the serum levels of these adipokines requires further study.
Our study shows that CTRP9 can be used as a good marker with appropriate specificity for CRC diagnosis, and its increase is associated with negative outcomes in CRC patients. Further studies are needed to confirm or refute our results.