1. Background
Colorectal cancer (CRC) is one of the leading causes of cancer-related morbidity and mortality worldwide, imposing substantial socioeconomic and psychological burdens on patients and their families. In 2022, approximately 2 million new cases of CRC were diagnosed globally, making it the third most common malignancy in terms of incidence. Furthermore, CRC accounted for an estimated 0.9 million deaths, ranking second among all cancer-related mortalities worldwide (1, 2). In China, CRC is also a major public health concern and ranks fifth in cancer-related deaths (3). Notably, the average age at onset of CRC is declining, which further complicates prevention and early intervention strategies (4). Therefore, elucidating the underlying mechanisms and associated risk factors of CRC is of paramount importance for improving early diagnosis and therapeutic outcomes.
Surgical resection remains the cornerstone of curative treatment for CRC. Early-stage detection significantly increases the likelihood of achieving curative outcomes through surgical or endoscopic intervention. However, due to the lack of widespread screening programs across many Asian countries, a large proportion of patients are diagnosed at advanced stages. These patients often present with severe clinical symptoms and distant metastases, thereby limiting the feasibility of curative surgery and contributing to poor survival outcomes. Currently, commonly employed diagnostic methods for CRC include digital rectal examination (DRE), fecal occult blood testing (FOBT), serum tumor markers, abdominal and pelvic computed tomography (CT), and colonoscopy. Among these, histopathological confirmation via endoscopic biopsy remains the gold standard. Nevertheless, colonoscopy is invasive and cost-intensive, limiting its applicability in population-wide screening. In contrast, peripheral blood tests are simple, rapid, minimally invasive, and cost-effective. Given the increasing evidence linking systemic inflammation to tumorigenesis and cancer prognosis, investigating the clinical relevance of peripheral inflammatory markers in CRC may offer promising adjunctive tools for disease assessment.
Inflammation plays a dual role in tumor biology. While acute inflammatory responses can mediate anti-tumor immunity, chronic inflammation is recognized as a key contributor to tumor initiation, progression, and metastasis (5). Numerous inflammatory markers — such as white blood cell (WBC) count, neutrophils (NE), platelets (PLT), lymphocytes (LY), and high-sensitivity C-reactive protein (Hs-CRP) — are routinely used to assess systemic inflammation (6-10). In recent years, composite indices including the neutrophil-to-lymphocyte ratio (NLR), platelet-to-lymphocyte ratio (PLR), and Systemic Immune-Inflammation Index (SII) have emerged as more dynamic indicators of the host inflammatory status (11, 12).
The NLR and PLR have been extensively studied for their prognostic relevance in various malignancies. A meta-analysis demonstrated that elevated NLR is associated with shorter overall survival (OS) and progression-free survival (PFS) in CRC patients, while the prognostic value of PLR remains controversial (13). Some studies have reported that preoperative PLR does not correlate with survival outcomes in CRC (14), although subgroup analyses have indicated that elevated PLR may predict poor prognosis in left-sided colon cancer, but not in right-sided disease (15).
Similarly, SII has been identified as an independent prognostic factor in several cancers, including esophageal squamous cell carcinoma (16), nasopharyngeal carcinoma (17), and breast cancer (18). Higher SII values have been consistently linked to worse survival outcomes, highlighting its potential clinical utility.
2. Objectives
Based on this context, the present cross-sectional study aimed to investigate the association between systemic inflammatory indicators and CRC in a Chinese population. We analyzed peripheral blood parameters, including WBC, NE, PLT, LY, Hs-CRP, as well as relevant pathological features, in 281 CRC patients and 315 healthy individuals. Our goal was to evaluate the potential of these inflammatory indicators — particularly NLR, PLR, and SII — as putative risk factors and their correlation with tumor size and clinical stage. The findings contribute to a better understanding of the inflammatory microenvironment in CRC and offer clinical insights that may support future strategies in risk stratification and disease management.
3. Methods
3.1. Study Population Selection Criteria
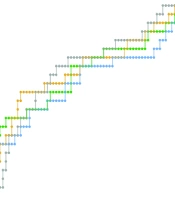
Patients diagnosed with CRC who underwent surgical treatment at the First Affiliated Hospital of Soochow University between January 2021 and January 2022, as well as individuals undergoing routine physical examinations during the same period, were enrolled into this study based on predefined inclusion and exclusion criteria. Ultimately, a total of 596 participants were included, comprising 281 (47.15%) CRC patients and 315 (52.85%) healthy controls (Figure 1). Comprehensive clinical and demographic data of all included subjects were collected for analysis. This study was approved by the Ethics Committee of the First Affiliated Hospital of Soochow University, and informed consent was obtained from each participant prior to enrollment.
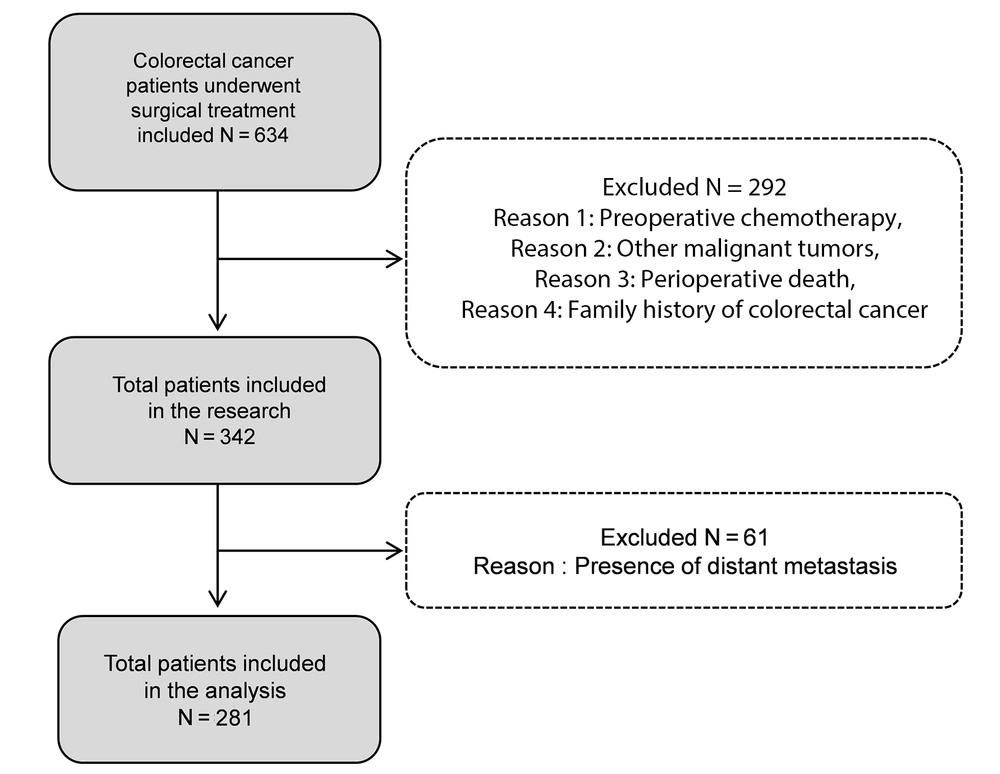
Figure 1.
Flowchart of patient selection. This flowchart illustrates the inclusion process of colorectal cancer (CRC) patients in the study. Based on predefined inclusion and exclusion criteria, a total of 281 patients with CRC were enrolled for analysis.
In this study, peripheral blood samples were obtained preoperatively from CRC patients who had not undergone any antitumor treatment prior to surgery. Therapeutic strategies differed based on tumor staging. Patients with carcinoma in situ or minimally invasive cancer (Stage I) typically underwent endoscopic resection without subsequent adjuvant therapy unless additional risk factors were identified. For patients diagnosed with Stage II or III CRC, radical surgical resection was the primary treatment approach, followed by postoperative chemoradiotherapy tailored according to the patient's clinical tolerance and individualized risk assessments. Patients with Stage IV CRC generally presented with distant metastases, had often undergone preoperative chemotherapy, or were unable to tolerate surgical intervention, thus receiving palliative chemotherapy instead. Only patients with Stage I to III CRC were enrolled, explicitly excluding Stage IV patients.
The inclusion criteria for the CRC group specified that patients must be newly diagnosed with CRC (first-time diagnosis), have postoperative pathology confirmed as colorectal adenocarcinoma, and possess complete and intact clinical records. Exclusion criteria involved patients with a prior history of any other malignancy; familial adenomatous polyposis (FAP) or hereditary nonpolyposis CRC (HNPCC); death occurring within one month following surgery; preoperative clinical evidence of infection, such as fever, cough, or expectoration; concurrent hematological disorders; history of preoperative blood transfusion; missing essential clinical data, including height and weight; and any form of preoperative antitumor therapy.
The healthy control group comprised individuals undergoing routine physical examination, specifically those diagnosed through colonoscopy as having colorectal polyps without evidence of malignancy, and whose clinical records were complete and intact. Exclusion criteria for this group included individuals with a previous history of malignancy or inflammatory bowel diseases such as ulcerative colitis or Crohn’s disease, incomplete clinical records (e.g., missing height or weight data), signs suggestive of infection (fever, cough, expectoration), or concurrent hematological disorders.
3.2. General Information
A total of 315 individuals undergoing routine physical examinations were enrolled as healthy controls, comprising 209 males and 106 females, with a mean age of 63.8 years (Table 1). The study included 281 patients diagnosed with CRC, consisting of 184 males and 97 females. The mean age of this group was 57.0 years (Table 2).
Table 1.
Baseline Data of the Health Check-up Population a
| Clinic Pathological Features | Cases |
|---|---|
| Gender | |
| Male | 209 (66.35) |
| Female | 106 (33.65) |
| Age | |
| < 65 | 235 (74.60) |
| ≥ 65 | 80 (25.40) |
| BMI classification | |
| 18.5 ≤ BMI < 24 | 131 (41.59) |
| ≥ 24 | 184 (58.41) |
a Values are expressed as No. (%).
Table 2.
Baseline Data of Patients with Colorectal Cancer a
| Clinic Pathological Features | Cases |
|---|---|
| Gender | |
| Male | 184 (65.48) |
| Female | 97 (34.52) |
| Age | |
| < 65 | 143 (50.88) |
| ≥ 65 | 138 (49.12) |
| Hypertension | |
| No | 172 (61.21) |
| Yes | 109 (38.79) |
| Diabetes | |
| No | 253 (90.04) |
| Yes | 28 (9.96) |
| Diameter of tumor | |
| < 3 | 59 (21.00) |
| ≥ 3 | 222 (79.00) |
| Ki-67 (%) | |
| < 70 | 35 (12.46) |
| ≥ 70 | 246 (87.54) |
| Lymph metastasis | |
| No | 171 (60.85) |
| Yes | 110 (39.15) |
| Pathological staging | |
| Phase I + II | 167 (59.43) |
| Phase III | 114 (40.57) |
| Depth infiltration | |
| T1 + T2 | 22 (7.83) |
| T3 + T4 | 259 (92.17) |
| Tumor location | |
| Colon | 135 (48.04) |
| Rectum | 146 (51.96) |
| BMI classification | |
| 18.5 ≤ BMI < 24 | 176 (62.63) |
| ≥ 24 | 105 (37.37) |
a Values are expressed as No. (%).
3.3. Peripheral Inflammatory Indicator Assessment
Preoperative peripheral blood samples were collected from CRC patients and healthy controls to evaluate systemic inflammatory markers. For CRC patients, blood was drawn 24 - 48 hours prior to surgery, while samples from healthy individuals were obtained during routine physical examinations. All participants underwent venous blood collection in the early morning after an overnight fast. A total of 8 mL of peripheral blood was drawn into sterile ethylenediaminetetraacetic acid (EDTA) anticoagulant tubes. Laboratory analyses were performed by following standard operating procedures. Peripheral blood cell counts, including WBC, NE, LY, and PLT, were determined within 30 minutes of collection using an automated hematology analyzer (SYSMEX XE-5000, Japan). Serum hs-CRP levels were measured using an immunonephelometric assay on a biochemistry analyzer (MINDRAY BS-2000M, China).
The following inflammatory indicators were calculated based on complete blood count parameters: NLR = NE/LY; PLR = PLT/LY; and SII = (PLT × NE)/LY. Given the absence of universally established cutoff values for NLR, PLR, and SII in the literature, we adopted the median - based method to determine the threshold values for these indicators. Patients were then stratified into high - and low - level groups according to the calculated medians. The reference ranges for the evaluated parameters are as follows: WBC: 3.50 - 9.50 ×10⁹/L; NE: 1.80 - 6.30 ×10⁹/L; LY: 1.10 - 3.20 ×10⁹/L; PLT: 125 - 350 ×109/L; and hs - CRP: 0 - 3 mg/L
The differences in inflammatory indicators between the healthy control group and CRC patients were statistically analyzed. Additionally, the association between these inflammatory indicators and the clinicopathological characteristics of CRC patients was examined.
3.4. Pathological Evaluation
Histopathological assessments were independently reviewed by at least two senior pathologists to ensure diagnostic accuracy. The specific parameters evaluated are as follows:
(1) Pathological staging: Tumor staging was performed according to the 8th edition of the American Joint Committee on Cancer (AJCC) TNM classification system for CRC.
(2) Ki-67 Proliferation Index: Ki-67 expression was assessed by evaluating the nuclear staining intensity and calculating the percentage of positively stained tumor cells. For statistical analysis, Ki-67 expression was categorized into two groups: Low Ki-67 expression (< 70% positive cells) and high Ki-67 expression (≥ 70% positive cells).
3.5. Statistical Analysis
Statistical analyses were performed using SPSS software (version 27.0, USA). The normality of continuous variables was assessed using the Shapiro-Wilk test. Normally distributed variables are presented as mean ± standard deviation (SD) and were compared between groups using independent-sample t-tests. Non-normally distributed variables are expressed as median [interquartile range (IQR)] and were analyzed using the Mann-Whitney U test. Categorical variables were summarized as frequencies and percentages and compared using appropriate statistical tests.
Receiver operating characteristic (ROC) curve analysis was conducted to assess the diagnostic performance of peripheral blood inflammatory indicators in CRC screening. Binary logistic regression analysis was performed to identify independent predictors of tumor size in CRC patients. The following clinicopathological variables were included in the binary logistic regression analysis: Primary tumor size (< 3 cm vs. ≥ 3 cm), TNM stage (I/II vs. III), depth of tumor invasion (T1 + T2 vs. T3 + T4), presence of regional lymph node metastasis (yes vs. no), age at diagnosis (< 65 years vs. ≥ 65 years), Ki-67 Proliferation Index (< 70% vs. ≥ 70%), and tumor location (colon vs. rectum).
4. Results
A total of 281 CRC patients meeting the inclusion criteria were enrolled, along with 315 healthy individuals serving as the control group. A normality test (Kolmogorov-Smirnov test) was conducted on peripheral blood inflammatory parameters (including WBC, NE, PLT, LY, Hs-CRP, NLR, PLR, and SII) in all 596 participants. The results showed P < 0.05 for all variables, indicating a non-normal distribution; therefore, the data are presented as medians (interquartile range), and group comparisons were performed using the Mann-Whitney U test.
4.1. Diagnostic Value of Preoperative Peripheral Inflammatory Indicators in Colorectal Cancer
4.1.1. Comparison of Inflammatory Indicators Between Healthy Controls and Colorectal Cancer Patients
Compared with the healthy control group, patients with CRC showed significantly elevated levels of WBC, NE, PLT, Hs-CRP, NLR, PLR, and SII (all P < 0.001), while LY levels were significantly decreased (P < 0.001). These results suggest that systemic inflammatory changes are closely associated with the presence of CRC (Table 3).
Table 3.
Comparison of Peripheral Blood Inflammatory Markers Between the Healthy Physical Examination Population and the Colorectal Cancer Group
| Variables | Healthy Physical Examination Group; Median (25 - 75%) | CRC Group; Median (25 - 75%) | Z | P-Value a |
|---|---|---|---|---|
| WBC (109/L) | 5.41 (4.45 - 6.38) | 6.08 (4.84 - 7.43) | 2.306 | < 0.001 |
| NE (109/L) | 3.22 (2.67 - 4.07) | 3.65 (2.78 - 4.98) | 2.447 | < 0.001 |
| PLT (109/L) | 201 (175 - 235) | 218 (173.00 - 268.50) | 2.324 | < 0.001 |
| LY (109/L) | 1.73 (1.37 - 2.15) | 1.50 (1.11 - 1.88) | 2.433 | < 0.001 |
| Hs-CRP (mg/L) | 0.79 (0.42 - 2.10) | 2.87 (0.92 - 11.93) | 4.353 | < 0.001 |
| NLR | 1.82 (1.41 - 2.50) | 2.38 (1.71 - 3.64) | 3.210 | < 0.001 |
| PLR | 114.74 (92.43 - 151.40) | 152.78 (110.27 - 199.93) | 3.403 | < 0.001 |
| SII | 371.86 (275.01 - 518.18) | 528.35 (348.69 - 897.95) | 3.462 | < 0.001 |
Abbreviations: WBC, white blood cell; NLR, neutrophil-to-lymphocyte ratio; PLR, platelet-to-lymphocyte ratio; SII, Systemic Immune-Inflammation Index; CRC, colorectal cancer; NE, neutrophil; PLT, platelet; LY, lymphocyte; Hs-CRP, high-sensitivity C-reactive protein.
a P < 0.001 was considered statistically significant.
4.1.2. Diagnostic Performance of Peripheral Inflammatory Indicators in Colorectal Cancer
Receiver operating characteristic curve analysis demonstrated that among the tested markers, Hs-CRP had the highest area under the curve (AUC = 0.756). Based on a comprehensive evaluation of sensitivity and specificity, Hs-CRP, WBC, NLR, PLR, and SII were more effective than NE and PLT as potential adjunctive indicators for CRC detection (Table 4 and Figure 2).
Table 4.
Comparison of the Diagnostic Efficacy of Preoperative Inflammatory Markers in Peripheral Blood for Colorectal Cancer Screening
| Variables | Cut-off Values | AUC (95%CI) | Sensitivity (%) | Specificity (%) | P-Value |
|---|---|---|---|---|---|
| WBC (109/L) | 6.275 | 0.619 (0.547 - 0.664) | 45.9 | 73.0 | < 0.001 a |
| NE (109/L) | 4.53 | 0.597 (0.551 - 0.643) | 33.1 | 87.0 | < 0.001 a |
| PLT (109/L) | 242.5 | 0.574 (0.527 - 0.621) | 38.4 | 80.6 | 0.002 b |
| Hs-CRP (mg/L) | 2.86 | 0.756 (0.718 - 0.794) | 50.4 | 85.4 | < 0.001 a |
| NLR | 2.18 | 0.665 (0.621 - 0.708) | 58.7 | 67.6 | < 0.001 a |
| PLR | 119.78 | 0.667 (0.623 - 0.711) | 70.5 | 57.5 | < 0.001 a |
| SII | 574.85 | 0.673 (0.629 - 0.717) | 45.6 | 82.9 | < 0.001 a |
Abbreviations: AUC, area under the curve; WBC, white blood cell; NLR, neutrophil-to-lymphocyte ratio; PLR, platelet-to-lymphocyte ratio; SII, Systemic Immune-Inflammation Index; NE, neutrophil; PLT, platelet; Hs-CRP, high-sensitivity C-reactive protein.
a P < 0.001.
b P < 0.01.
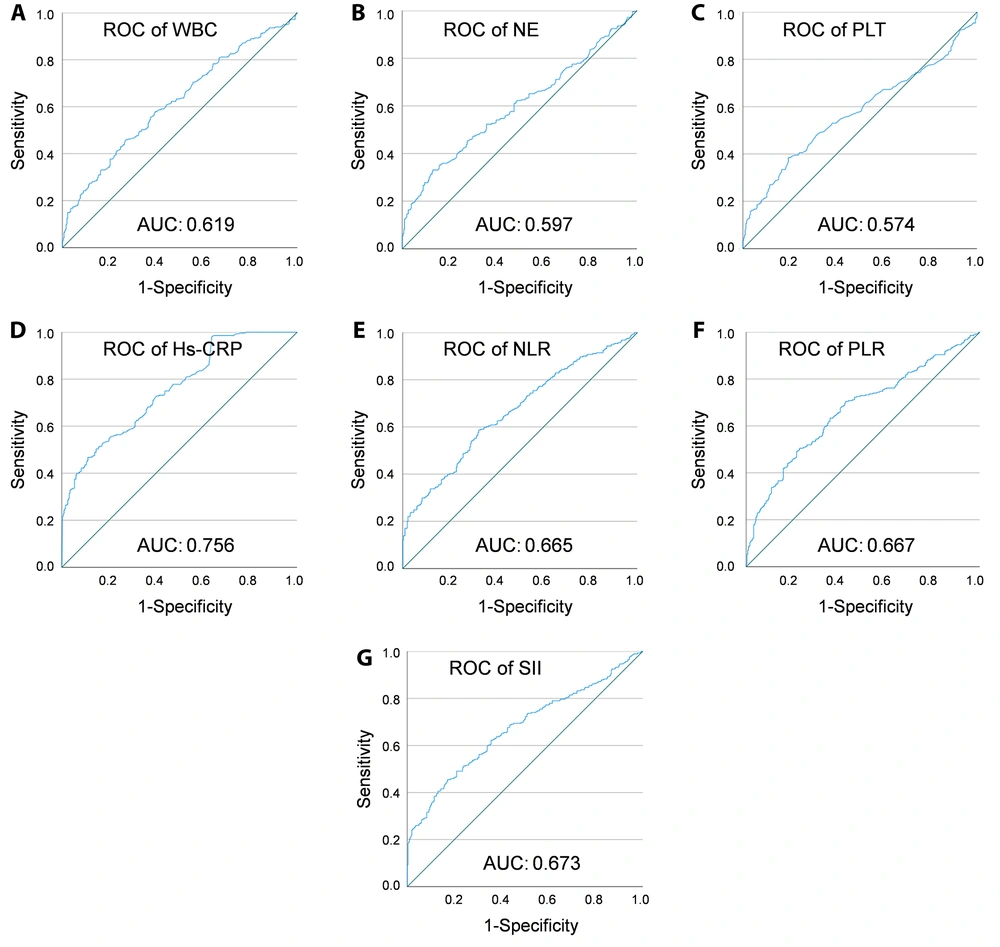
Figure 2.
The receiver operating characteristic (ROC) curves of peripheral blood inflammatory indicators. ROC curve analysis was conducted to evaluate the diagnostic performance of various peripheral inflammatory markers in identifying colorectal cancer (CRC). The ROC curves are shown for WBC (A), neutrophil (NE) (B), platelet (PLT) (C), Hs-CRP (D), NLR (E), PLR (F), and Abbreviations: WBC, White Blood Cell; NLR, neutrophil-to-lymphocyte ratio; PLR, platelet-to-lymphocyte ratio; SII, Systemic Immune-Inflammation Index (G). The x-axis represents specificity, and the y-axis represents sensitivity. The area under the curve (AUC), specificity, and sensitivity for each marker are detailed in Table 4.
4.2. Correlation Between High-sensitivity C-reactive Protein and Clinic Pathological Features of Colorectal Cancer
Given that Hs-CRP showed the highest AUC, we further analyzed its clinical relevance. Based on ROC analysis, an optimal cutoff value of 2.86 mg/mL was used to classify patients into low (< 2.86 mg/mL) and high (≥ 2.86 mg/mL) Hs-CRP groups.
Subgroup analysis revealed statistically significant associations between Hs-CRP levels and age (< 65 vs. ≥ 65 years), tumor diameter (< 3 cm vs. ≥ 3 cm), and tumor location (colon vs. rectum) (Table 5). Correlation analysis revealed a weak positive correlation between age and Hs-CRP levels (r = 0.196, P = 0.001; Appendix 1 in Supplementary File), as well as a weak positive correlation between tumor size and Hs-CRP levels (r = 0.133, P < 0.05; Appendix 2 in Supplementary File). In contrast, a weak negative correlation was observed between tumor location and Hs-CRP levels (r = -0.132, P < 0.05; Appendix 3 in Supplementary File).
Table 5.
High-sensitivity C-reactive Protein Expression and Clinic Pathological Features of Colorectal Cancer
| Clinical Features | Low Hs-CRP Group (n = 140) | High Hs-CRP Group (n = 141) | Total | χ2 | P-Value |
|---|---|---|---|---|---|
| Gender | 281 | 0.028 | 0.856 | ||
| Male | 91 | 93 | 184 | ||
| Female | 49 | 48 | 97 | ||
| Age (y) | 281 | 10.776 | 0.001 a | ||
| < 65 | 85 | 58 | 143 | ||
| ≥ 65 | 55 | 83 | 138 | ||
| Hypertension | 281 | 2.384 | 0.123 | ||
| No | 92 | 80 | 172 | ||
| Yes | 48 | 61 | 109 | ||
| Diabetes | 281 | 0.667 | 0.414 | ||
| No | 124 | 129 | 253 | ||
| Yes | 16 | 12 | 28 | ||
| Tumor diameter (cm) | 281 | 4.963 | 0.026 b | ||
| < 3 | 37 | 22 | 59 | ||
| ≥ 3 cm | 103 | 119 | 222 | ||
| Ki-67 (%) | 281 | 0.270 | 0.603 | ||
| < 70 | 16 | 19 | 35 | ||
| 70 ≥ | 124 | 122 | 246 | ||
| Depth of infiltration | 281 | 0.213 | 0.644 | ||
| T1 + T2 | 12 | 10 | 22 | ||
| T3 + T4 | 128 | 131 | 259 | ||
| Lymph node metastasis | 281 | 0.865 | 0.352 | ||
| No | 89 | 82 | 171 | ||
| Yes | 51 | 59 | 110 | ||
| TNM staging | 281 | 0.851 | 0.356 | ||
| Period I + II | 87 | 80 | 167 | ||
| Phase III | 53 | 61 | 114 | ||
| Tumor location | 281 | 4.890 | 0.027 b | ||
| Colon | 58 | 77 | 135 | ||
| Rectum | 82 | 64 | 146 |
Abbreviations: Hs-CRP, high-sensitivity C-reactive protein.
a P < 0.001.
b P < 0.05.
4.3. Univariate Analysis of Preoperative Inflammatory Indicators and Clinic Pathological Parameters
4.3.1. Correlation with Ki-67 Proliferation Index
Among 281 CRC patients, 35 (12.46%) had Ki-67 < 70%, and 246 (87.54%) had Ki-67 ≥ 70%. No significant differences were observed in WBC, Hs-CRP, NLR, PLR, or SII between the two groups (P > 0.05; Appendix 4 in Supplementary File).
4.3.2. Correlation with Lymph Node Metastasis
Of the CRC patients, 171 (60.85%) had no lymph node metastasis, and 110 (39.15%) had lymph node involvement. There were no significant differences in WBC, Hs-CRP, NLR, PLR, or SII levels between the metastasis and non-metastasis groups (P > 0.05, Appendix 5 in Supplementary File).
4.3.3. Correlation with Tumor Size
Among the 281 CRC patients, 59 (21.00%) had tumors < 3 cm, and 222 (79.00%) had tumors ≥ 3 cm. Levels of WBC, NLR, and SII were significantly higher in patients with larger tumors (P < 0.05), while PLR showed no significant association. Hs-CRP levels tended to be higher in patients with tumors ≥ 3 cm, but the difference did not reach statistical significance (P = 0.063, Table 6).
Table 6.
Univariate Analysis of Preoperative Inflammatory Markers and Colorectal Cancer Diameter
| Variables | Diameter < 3 cm (n = 59) | Diameter ≥ 3 cm (n = 222) | P-Value |
|---|---|---|---|
| WBC (109/L) | 5.61 (4.53 - 6.65) | 6.21 (5.04 - 7.58) | 0.017 a |
| Hs-CRP (mg/L) | 1.68 (0.77 - 7.94) | 3.17 (1.03 - 13.05) | 0.063 |
| NLR | 2.21 (1.52 - 2.88) | 2.41 (1.76 - 3.98) | 0.047 a |
| PLR | 146.43 (97.21 - 205.13) | 154.09 (113.15 - 199.67) | 0.371 |
| SII | 469.86 (263.41 - 794.63) | 544.26 (369.26 - 961.53) | 0.024 a |
Abbreviations: WBC, white blood cell; Hs-CRP, high-sensitivity C-reactive protein; NLR, neutrophil-to-lymphocyte ratio; PLR, platelet-to-lymphocyte ratio; SII, Systemic Immune-Inflammation Index; Hs-CRP, high-sensitivity C-reactive protein..
a P < 0.05.
4.3.4. Correlation with TNM Stage
Of the enrolled patients, 167 (59.43%) were classified as stage I–II and 114 (40.57%) as stage III. No significant differences in WBC, Hs-CRP, NLR, PLR, or SII levels were found between these groups (P > 0.05; Appendix 6 in Supplementary File).
4.4. Multivariate Analysis of Factors Associated with Tumor Size
To identify independent inflammatory predictors of tumor size, a multivariate logistic regression analysis was performed. The results demonstrated that both the NLR (OR = 0.729; 95% CI: 0.572 - 0.928; P = 0.01) and the systemic SII (OR = 1.002; 95% CI: 1.000 - 1.003; P = 0.013) were independently associated with tumor diameter. In contrast, WBC was not identified as an independent predictor of tumor size (OR = 1.134; 95% CI: 0.948 - 1.356; P > 0.05; Appendix 7 in Supplementary File).
5. Discussion
Colorectal cancer has become one of the most prevalent malignancies worldwide. In China, both the incidence and mortality rates of CRC exceed global averages and have continued to rise in recent years. The disease typically develops insidiously, with nonspecific early symptoms that are often misattributed to benign gastrointestinal conditions, leading to frequent delays in diagnosis. When patients present with rectal bleeding, altered bowel habits, or symptoms of obstruction, they are often already in the advanced stages of disease (19). According to domestic epidemiological data, approximately 85% of CRC patients in China are diagnosed at an advanced stage, with overall survival rates remaining below 40% (20). Therefore, identifying simple, rapid, and cost-effective methods to screen high-risk populations is of great importance for improving early diagnosis and patient outcomes. This study aimed to explore peripheral blood inflammatory markers as potential adjunctive indicators to aid in identifying individuals at high risk for CRC.
Early-stage carcinoma in situ or Stage I CRC can often be treated by endoscopic resection without the need for adjuvant therapy. Stage II and III patients primarily undergo surgical resection, with postoperative adjuvant chemoradiotherapy determined based on individual risk profiles and treatment tolerance. In contrast, Stage IV patients, who commonly present with distant metastases or are unfit for surgery, generally receive palliative chemotherapy. Given that this study aimed to investigate diagnostic markers for identifying high-risk individuals rather than for prognostic evaluation, only patients with Stage I–III CRC were included, while those with Stage IV disease were excluded.
5.1. Inflammation and Tumorigenesis
Inflammation plays a dual role in tumor biology. While acute inflammation supports host defense and tissue repair, chronic inflammation has been implicated in carcinogenesis through mechanisms involving sustained cellular damage and genetic mutations (5). Persistent inflammatory responses can induce malignant transformation by promoting genomic instability and enhancing tumor cell proliferation. For example, Helicobacter pylori infection is a well-established risk factor for gastric cancer, hepatitis B and C viruses contribute to hepatocellular carcinoma, and chronic inflammatory bowel diseases such as Crohn’s disease and ulcerative colitis significantly increase CRC risk (21, 22). Epidemiological evidence suggests that approximately 15% of malignancies are associated with infectious or inflammatory processes (23).
Cancer-related inflammation is typically characterized by leukocytosis, neutrophilia, and lymphopenia, and has been correlated with poor prognosis in various cancers, including lung and gastric cancers (24). Commonly used peripheral inflammatory markers include WBC, NE, PLT, Hs-CRP, and LY. In addition, derived indices such as NLR, PLR, and SII have been proposed to better reflect the systemic inflammatory and immune status of cancer patients.
5.2. Peripheral Blood Inflammatory Indicators and Colorectal Cancer
The WBCs are key components of the immune system, involved in pathogen clearance and immune surveillance against tumor cells. Previous studies have linked elevated WBC counts with increased CRC incidence and cancer-related mortality (25). Neutrophils, comprising 50 - 70% of circulating WBCs, are derived from bone marrow progenitors and exhibit strong phagocytic activity (26). Their elevated levels in cancer patients suggest active involvement in tumor-related inflammation and immune modulation (27). The PLT can suppress immune function and have been associated with worse prognosis in multiple malignancies (28). Upon activation, PLTs release various growth factors such as TGF-β, VEGF, and PDGF, which can promote tumor growth, angiogenesis, and metastasis (29, 30). The LY, accounting for 20 - 40% of WBCs, are vital for cellular and humoral immunity (31). Increased lymphocyte levels have been linked to enhanced antitumor immunity and improved prognosis (32).
The Hs-CRP is a sensitive marker of systemic inflammation, with normally low levels in healthy individuals that rise sharply during infection or chronic inflammation. Elevated Hs-CRP levels have also been reported in cancer patients. A large prospective cohort study showed significantly higher serum Hs-CRP levels in patients with various cancers, including a 1.62-fold increase across all cancers and a 1.74-fold increase in breast cancer, compared to healthy controls (33).
In our study, WBC, NE, PLT, and Hs-CRP levels were significantly higher in CRC patients than in healthy controls, indicating that these markers may help distinguish between diseased and non-diseased individuals. Additionally, Hs-CRP levels were positively correlated with age and tumor size, but negatively correlated with tumor location (colon vs. rectum). The WBC count also showed a positive correlation with tumor diameter. However, multivariate regression analysis revealed that neither WBC nor Hs-CRP was an independent predictor of tumor size, which may be attributed to the limited sample size. Further research with larger cohorts is warranted to clarify these associations.
5.3. Neutrophil-to-lymphocyte Ratio, Platelet-to-lymphocyte Ratio, Systemic Immune Inflammation Index and Their Association with Colorectal Cancer
The NLR reflects the balance between NE-mediated inflammation and lymphocyte-mediated immune response, making it a sensitive indicator of the host immune status. The PLR, as a marker of PLT activation, reflects the prothrombotic and immunosuppressive state commonly observed in cancer, and may be associated with metastatic potential. Both NLR and PLR are widely recognized as markers of systemic inflammation. Studies such as those by Stojkovic Lalosevic et al. have reported significantly elevated NLR and PLR levels in CRC patients compared to healthy controls (34). Our findings corroborated these results, showing higher NLR and PLR levels in CRC patients than in the healthy population. Furthermore, our results demonstrated a significant positive correlation between NLR and tumor size, whereas PLR did not show such an association. Regarding SII, which incorporates NE, lymphocyte, and PLT counts, previous research has demonstrated its predictive value for poor differentiation, larger tumor size, and advanced TNM stage in CRC patients (35). Consistent with these findings, our study also observed a significant positive correlation between SII and tumor diameter.
Importantly, both NLR and SII were significantly associated with tumor size, and multivariate logistic regression analysis confirmed that they were independent predictive factors for larger tumor diameter in CRC patients. These findings suggest that NLR and SII may serve as valuable adjunctive biomarkers for tumor burden assessment and risk stratification in CRC.
5.4. Limitations and Prospects
Our study has several inherent limitations. As a cross-sectional analysis, it is subject to selection bias and recall bias, which may affect the generalizability of the findings. Additionally, this study was conducted at a single center, the First Affiliated Hospital of Soochow University, and only included CRC patients who sought medical care there, making it difficult to account for potential regional variations in inflammatory marker profiles.
Moreover, the sample size was relatively limited, which may impact the statistical power and generalizability of the results. Future studies should include a larger and more diverse cohort to enhance the robustness of the findings. In subsequent research, we aim to expand the sample size, collect longitudinal data on patient survival and prognosis, and conduct further analyses to elucidate the potential relationship between inflammatory indicators and CRC onset, progression, and clinical outcomes. These efforts will provide a more comprehensive understanding of the prognostic significance of inflammatory markers and their potential integration with established screening and prognostic models.
5.5. Conclusions
This cross-sectional study investigated the association between peripheral inflammatory markers and CRC in a Chinese patient population. The findings suggest that the NLR and SII are independently associated with CRC and exhibit a significant correlation with tumor size. Additionally, elevated levels of Hs-CRP and advanced age were also significantly associated with larger tumor size, although Hs-CRP did not emerge as an independent risk factor for CRC in multivariate analysis. These results provide preliminary clinical evidence supporting the utility of NLR and SII as adjunctive indicators in the assessment of tumor burden in CRC patients. While not suitable as standalone screening tools, these inflammatory indicators may offer supplementary value when integrated with conventional diagnostic approaches and tumor markers to enhance risk stratification and clinical decision-making.