1. Background
Cytomegalovirus (CMV) is a highly specific herpes virus spreading only from person to person. When the pregnant women are infected with CMV during pregnancy, the probability of vertical transmission to the fetus through placenta, cervical fluid, blood, and breast milk will reach 10 - 12% (1). Sensorineural hearing loss (SNHL) is a high-incidence sequelae after congenital CMV infection, having a serious impact on the development of cognitive and motor functions among children. CMV infection also shows clinical symptoms such as jaundice, hepatosplenomegaly, retinitis, and microcephaly. If the infected children do not receive antiviral treatment in time, their nervous systems are prone to irreversible damage, and even death in severe cases (2, 3). Ganciclovir (GCV) is a common broad-spectrum antiviral drug with high curative effects that can be administered intravenously to treat CMV infection (4). It can treat manifestation due to CMV infection but has certain limitations in clinical use. Valganciclovir (VGCV), as a prodrug of GCV, has a similar effect with GCV and a higher oral utilization rate (5).
2. Objectives
This study aimed to compare the curative effects of VGCV and GCV among neonates with CMV infection and evaluate their effects on hearing so as to obtain better results and provide reference values for the follow-up clinical treatment.
3. Methods
3.1. General Information
In this randomized controlled trial, a total of 48 neonates with congenital CMV infection admitted to Huaian Maternal and Child Health Care Hospital, China were selected from January 2016 to December 2019 and randomly divided into two equal groups of intervention and group (n = 24 each). All neonates entered the treatment course after obtaining an informed consent from their guardians.
The characteristics of neonates in the control group were as follows: nine males vs. 15 females; a gestational age of 34 to 42 weeks (mean: 38.35 ± 2.99); five premature delivery cases and 19 full-term birth cases; 3 - 15 days of age at admission (mean: 9.21 ± 3.26); and weight of 1.6 - 3.8 kg (mean: 2.73 ± 0.62). The characteristics of neonates in the intervention group were as follows: 13 males vs. 11 females; a gestational age of 29 to 46 weeks (mean: 37.55 ± 3.61); seven premature delivery cases and 17 full-term birth cases; 1 - 13 days of age at admission (mean: 8.97 ± 3.17); and weight of 1.6 - 3.5 kg (mean: 2.53 ± 0.74).
The inclusion criteria were as follows: meeting the diagnostic criteria proposed in the 5th International Congenital CMV Conference in 2015 and having over three moderate to severe symptoms (6); signing an informed consent form by the guardian; having no other virus infections, and receiving anti-CMV virus treatment for the first time. Exclusion criteria were having congenital development malformations, having hearing impairment caused by non-congenital CMV infection, having asphyxia during the perinatal period, having other major diseases such as immunodeficiency and coagulopathy; and allergic reactions to VGCV or GCV.
Both groups had no statistically significant difference in general information (P > 0.05). This research was approved by the Medical Ethics Committee of Huai'an Maternity and Child Health Care Hospital (Ethics Approval Number: 2016012).
3.2. Groups
Control group: The neonates were treated with GCV (Jiangsu Lianshui Pharmaceutical Co., Ltd.; lot H20041684; strength 10 mi: 0.25 g) intravenous infusion. Dose for the infusion was determined based on the body weight of 6 mg/kg and the infusion was 12 h/time, and each infusion went on for more than 1 hour. In case of renal insufficiency, the dosage was reduced as appropriate, and the treatment was ≤ 6 weeks.
Intervention group: The neonates were treated with VGCV (Shanghai Roche Pharmaceutical Co., Ltd.; lot 20100790; strength 450 mg) orally at a dose of 16 mg/kg for 12 h/time. During the treatment, both groups were weekly subjected to blood routine, liver B-ultrasound, eye examination, and brainstem auditory evoked potentials (BAEP) tests, as well as blood/urine CMV load and serum CMV-IgM expression level detection.
3.3. Observation Indicators
(1) Urine CMV-DNA load and blood CMV-DNA load for both groups before and after treatment by polymerase chain reaction (PCR)-fluorescence: 2 mL of fresh urine and 2 mL of centrifuged fasting venous blood were collected in a sterile tube. Human CMV nucleic acid detection kit (Shanghai Zhijiang Biotechnology Co., Ltd.; specification 24 T/box) was used for the test according to the instructions; the positive rate = number of positive neonates/total neonates *100%.
(2) Serum CMV-IgM expression level for both groups before and after treatment by ELISA method: 8 mL of fasting venous blood was collected with a sterile tube, and 2 mL of serum was collected from the upper layer after centrifugation. Human ELISA (anti-CMV IgM) serum detection kit (Shanghai Guangrui Biotechnology Co., Ltd., 48 T/box) was used for the test according to the instructions; the positive rate = number of positive neonates/total neonates *100%.
(3) Comparison of hearing loss between the two groups during treatment by transiently evoked otoacoustic emission (TEOAE) hearing screening and BAEP (6, 7). TEOAE hearing screening had the results of pass or fail. Meanwhile, BAEP followed the diagnostic criteria of Clinical Audiology (5th Edition): normal hearing 10 - 15 dB, mild hearing loss 16 - 40 dB, moderate to severe hearing loss 41 - 70 dB, severe hearing loss 71 - 90 dB, and extremely severe hearing loss > 90 dB.
(4) Comparison of blood routine, liver B-ultrasound, and eye examination results before and after treatment, and analysis of the improvement of the symptoms in the two groups.
3.4. Statistical Methods
SPSS software V. 22.0 was used for data analysis. Enumeration data were represented by (%), χ2 test was performed, and measurement data were represented by (
4. Results
4.1. Comparison of the Expression of Blood/Urine CMV and CMV-IgM Between the Two Groups Before and After Treatment
Before treatment, both groups had no significant difference in blood/urine CMV-DNA expression and positive expression rates of blood/urine CMV-DNA and CMV-IgM (P > 0.05). After treatment, both groups had significantly reduced blood/urine CMV-DNA expression and positive expression rates of blood/urine CMV-DNA and CMV-IgM compared with before treatment (P < 0.05), but there was no statistical significance between the two groups (P > 0.05) (Tables 1 and 2).
Table 1.
Comparison of Blood/Urine CMV and CMV-IgM Expression Between the Two Groups Before and After Treatment a
| Group | Indicator | |||
|---|---|---|---|---|
| Urine CMV-DNA Load (×106 Copies/L) | Blood CMV-DNA Load (×103 Copies/L) | |||
| Before | After | Before | After | |
| Control group (n = 24) | 1069.04 ± 395.96 | 2.16 ± 1.21 b | 1629.07 ± 645.46 | 41.24 ± 25.74 b |
| Intervention group (n = 24) | 1060.13 ± 379.96 | 2.09 ± 1.30 b | 1771.83 ± 649.73 | 41.25 ± 23.39 b |
| t c | 0.433 | 0.577 | 0.866 | 0.577 |
| P-value | 0.992 | 0.893 | 0.441 | 0.893 |
a Values are expressed as mean ± standard deviation.
b Compared with before treatment, P < 0.05
ct value means test statistic.
Table 2.
Comparison of the Expression of Blood/Urine CMV and CMV-IgM Between the Two Groups Before and After Treatment a
| Group | Indicator | |||||
|---|---|---|---|---|---|---|
| Urine CMV-DNA Positive Rate | Blood CMV-DNA Positive Rate | CMV-IgM Positive Rate | ||||
| Before | After | Before | After | Before | After | |
| Control group (n = 24) | 23 (95.83) | 6 (25.00) b | 13 (54.17) | 0 (0) b | 18 (75.00) | 0 (0) b |
| Intervention group (n = 24) | 24 (100.00) | 7 (29.17) b | 15 (62.50) | 1 (4.17) b | 19 (79.17) | 1 (4.17) b |
| χ2 | 1.021 | 0.105 | 0.343 | 1.021 | 0.118 | 1.021 |
| P-value | 0.312 | 0.745 | 0.558 | 0.312 | 0.731 | 0.312 |
a Values are expressed as No. (%).
b Compared with before treatment, P < 0.05
Before treatment, there was no significant difference in hearing abnormality rates between the control (50%) and intervention (62.5%) groups (P > 0.05). After treatment, both the control (20.83%) and intervention (29.17%) groups had significantly decreased hearing abnormality rates, and the difference was statistically significant compared with before treatment (P < 0.05), but the difference between the two groups was not statistically significant (P > 0.05).
4.2. BAEP Comparison Between the Two Groups After Treatment
After treatment, the BAEP comparison results showed that there was no statistically significant difference between the two groups in the number of neonates with normal hearing, mild hearing loss, moderate to severe hearing loss, severe hearing loss, and extreme hearing loss (P > 0.05) (Table 3).
Table 3.
Comparison of BAEP Between the 2 Groups Before and After Treatment a
| Group | Normal Hearing | Mild Hearing Loss | Moderate to Severe Hearing Loss | Severe Hearing Loss | Extremely Severe Hearing Loss | |||||
|---|---|---|---|---|---|---|---|---|---|---|
| Before | After | Before | After | Before | After | Before | After | Before | After | |
| Control group (n = 24) | 12 (50.00) | 19 (79.17) | 4 (16.67) | 2 (8.33) | 3 (12.50) | 1 (4.17) | 4 (16.67) | 2 (8.33) | 1 (4.17) | 0 (0) |
| Intervention group | 9 (37.50) | 17 (70.83) | 5 (20.83) | 3 (12.50) | 4 (16.67) | 3 (12.50) | 5 (20.83) | 1 (4.17) | 1 (4.17) | 0 (0) |
| χ2 | 1.871 | 0.783 | 0.364 | 0.223 | 0.383 | 1.091 | 0.364 | 0.223 | 0.109 | - |
| P-value | 0.112 | 0.376 | 0.572 | 0.637 | 0.613 | 0.296 | 0.572 | 0.637 | 0.817 | - |
a Values are expressed as No. (%).
4.3. The Improvement of the Symptoms of the Two Groups
Before treatment, both groups had no statistically significant differences in the number of neonates with hyperbilirubinemia, retinitis, hepatosplenomegaly, thrombocytopenia, and neutropenia (P > 0.05). After treatment, while the number of neonates with hyperbilirubinemia, retinitis, hepatosplenomegaly, and thrombocytopenia decreased, neutropenia cases increased, and the difference before and after treatment was statistically significant (P < 0.05); however, the difference between the two groups was not statistically significant (P > 0.05) (Tables 4 and 5).
Table 4.
Symptom Improvement in the Two Groups a
| Group | Indicator | |||||
|---|---|---|---|---|---|---|
| Hyperbilirubinemia | Retinitis | Hepatosplenomegaly | ||||
| Before | After | Before | After | Before | After | |
| Control group (n = 24) | 19 (79.17) | 2 (8.33) b | 5 (20.83) | 0 (0)b | 10 (41.67) | 3 (12.5) b |
| Intervention group (n = 24) | 14 (58.33) | 3 (12.5) b | 6 (25.00) | 1 (4.17) b | 11 (45.83) | 2 (8.33) b |
| χ2 | 2.424 | 0.223 | 0.118 | 1.021 | 0.085 | 0.223 |
| P-value | 0.119 | 0.637 | 0.731 | 0.312 | 0.771 | 0.637 |
a Values are expressed as No. (%).
b Compared with before treatment, P < 0.05
Table 5.
Changes in the Symptoms of the Two Groups a
| Group | Indicator | |||
|---|---|---|---|---|
| Thrombopenia | Neutropenia | |||
| Before | After | Before | After | |
| Control group (n = 24) | 5 (20.83) | 0 (0) b | 0 (0) | 7 (29.17) b |
| Intervention group (n = 24) | 6 (25.00) | 1 (4.17) b | 0 (0) | 8 (33.33) b |
| χ2 | 0.118 | 1.021 | - | 0.097 |
| P-value | 0.731 | 0.312 | - | 0.755 |
a Values are expressed as No. (%).
b Compared with before treatment, P < 0.05
4.4. Comparison of Hospitalization Duration, Costs, and Peripherally Inserted Central Catheter (PICC) Rate Between the Two Groups
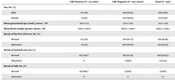
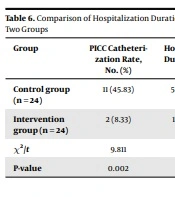
The hospitalization duration, costs, and PICC rate in VGCV group were lower than those in GCV group (P < 0. 05) (Table 6).
Table 6.
Comparison of Hospitalization Duration, Costs, and PICC Rate Between the Two Groups
| Group | PICC Catheterization Rate, No. (%) | Hospitalization Duration (Day) | Hospitalization Cost (Yuan) |
|---|---|---|---|
| Control group (n = 24) | 11 (45.83) | 50.08 ± 3.93 | 51991 ± 8247 |
| Intervention group (n = 24) | 2 (8.33) | 13.79 ± 4.73 | 11150 ± 2426 |
| χ2/t | 9.811 | 5.639 | 8.272 |
| P-value | 0.002 | 0.002 | 0.001 |
5. Discussion
Evidence suggests that congenital CMV infection is accompanied by various central and non-central nervous system symptoms, such as hyperbilirubinemia, retinitis, hepatosplenomegaly, SNHL, etc. (8, 9). When neonates having the symptoms above showed symptoms ≥ 3, they would be diagnosed with moderate to severe CMV infection, and antiviral treatment would be required. GCV has the chemical name of 9-(1, 3-dihydroxy-2-propoxymethyl) guanine, whose pharmacological effect is to phosphorylate GCV to trivalent phosphate in CMV-infected cells, thereby inhibiting viral DNA synthesis. However, GCV trivalent phosphate has a very slow metabolism in the body (10). Clinically, intravenous infusion with indwelling PICC tube is often used to improve drug utilization rate, while indwelling PICC tube is prone to infection, posing a threat to patients’ health. Also, the long treatment course and high price will also bring economic burdens to the patients’ families, affecting the final efficacy. As a prodrug of GCV, VGCV has a hydrophilic chemical structure (11) and can be rapidly hydrolyzed in the body, the oral utilization rate is greatly improved and is easy to be accepted without infection. In theory, it can be an alternative to GCV for CMV infection with more advantages. In our study, due to the need for long-term medication, about 45.83% of the children treated by GCV needed PICC insertion, and the rate of PICC insertion was significantly higher than that of the VGCV group (8.33%).
Studies have shown that after GCV and VGCV treatment, both groups had significantly improved hearing abnormalities, hyperbilirubinemia, retinitis, hepatosplenomegaly, and thrombocytopenia, and the efficacy of these two was similar with no significant difference, indicating that the two had the same main structure of antiviral pharmacological action, both of which were propoxyguanosine specifically bound to CMV (12). Hearing abnormalities caused by CMV infection were hearing loss induced by nervous system conduction disorders. Antiviral therapy could hinder the damage of CMV to the nervous system, thus improving hearing. Clinically jaundice appears when bilirubin surpasses 2.5 mg/dL, which includes hemolytic jaundice and hepatocellular jaundice. CMV infection mainly affects hepatocytes and vascular endothelial cells. Both infections are risk factors for inducing jaundice (13, 14), and interference with liver cells and vascular endothelial cells could easily lead to hepatosplenomegaly, thrombocytopenia, and blood coagulation disorders (15, 16). The results of this study showed that after GCV or VGCV treatment, the symptoms of hyperbilirubinemia, hepatosplenomegaly, and thrombocytopenia were significantly reduced in the two groups. This may be because GCV and VGCV block the binding of CMV with liver cells and vascular endothelial cells, thus inhibiting CMV expression.
GCV and VGCV therapy were found to cause adverse effects of granulocytopenia among neonates. Neutrophilic granulocytes are derived from bone marrow and have the effects of chemotaxis, phagocytosis, and sterilization. Studies on the toxicological side effects of GCV and VGCV have shown (17, 18) both had the most common damage to the blood system, with the myelosuppression being extremely typical, accompanied by a decrease in the activity of blood cell precursors in the bone marrow. However, the myelosuppression could be gradually improved once the medication was discontinued (19, 20), suggesting that the neutrophils should be repeatedly detected during the treatment process, and the dose should be immediately reduced, or the medication should be stopped once neutropenia occurred. In this study, no significant difference was observed between the two groups in the occurrence probability. GCV was administered intravenously, and the dosage adjustment was slightly more difficult than oral VGCV. In theory, VGCV can better reduce the occurrence of myelosuppression. Meanwhile, the oral VGCV was easy-to-use and could be done by the guardian under the doctor’s advice, which could shorten the treatment in hospital and reduce the additional hospitalization costs (21). In our study, the average length of hospitalization and hospitalization cost in VGCV group were significantly lower than those in GCV group (P < 0.05).
5.1. Limitations
This study had some limitations. First, the sample size of the study was limited, so the conclusions drawn may not be very convincing. Second, the follow-up duration for monitoring SNHL was not long enough. Also, hearing tests are best performed at 4, 6, 9, 12, 15, 18, 24, and 30 months of age, which should be further refined in the future.
5.2. Conclusions
In summary, VGCV is similar to GCV in the treatment of congenital CMV infection, but VGCV has advantages over GCV due to its low price, drug delivery, and short hospital stay. The related studies have documented that VGCV can reduce the toxic and side effects caused by GCV (22), but the appropriate dose of VGCV has not been referenced. Follow-up studies with larger sample sizes are recommended to determine the optimal dose of VGCV to achieve the best clinical effect.