
1. Background
Vitamin D, a lipid-soluble micronutrient, is an essential vitamin for calcium absorption, bone formation, and growth in children (1). It is synthesized in the skin via sun exposure or absorbed in the intestine through food, supplements, or vitamin D–fortified products (2). Vitamin D deficiency is associated with decreased bone mineral density, a higher prevalence of fractures, and failure to achieve peak bone mass in adulthood (3). Furthermore, it is associated with other disorders such as diabetes, hypertension, autoimmune, and cardiovascular diseases, as well as several types of cancer such as prostate, breast, and colon cancers (4).
As an essential trace element, zinc is required for numerous metabolic processes, including growth and immunity (5). Symptoms of severe zinc depletion are growth failure, primary hypogonadism, skin disease, impaired taste/smell, and impaired immunity (6, 7). Zinc is mainly absorbed in the small bowel, and the process of absorption is inhibited by the presence of phytates, fiber, iron, and calcium (6, 8). Primary dietary sources of zinc include animal products such as meat and milk. As a result, zinc deficiency may be a common health problem in children and adolescents in developing countries. Zinc deficiency was firstly reported as a consequence of poor intake in male adolescents in Iran and Egypt (6, 9).
Recently, studies have shown a possible link between serum zinc and vitamin D levels. Shams et al. showed a positive linear correlation between zinc and vitamin D levels in children aged 10 to 18 years (10). Vitamin D receptor (VDR) activity is influenced by zinc concentrations (11). On the other hand, vitamin D is also found to increase the expression of cellular zinc transporters (12). These findings are in line with the results found by Shams et al. (10).
Studies on whether vitamin D and zinc deficiencies can lead to wasting or short stature in children have proven to be inconsistent. Some studies have shown a positive correlation between vitamin D insufficiency and obesity (13-15), while others have shown no correlation (16-18). Some studies conducted on the administration of zinc supplements in children (5 years and older) with zinc deficiency have shown a modest increase in growth (19), while other studies have shown no effects or even negative effects on growth in infants and children aged less than 5 years (20, 21).
2. Objectives
As a result, we designed this study to investigate relationships between vitamin D and zinc levels in children of southern Iran, as well as to assess the contributing factors (such as wasting and short stature) to the possible link between serum zinc and vitamin D levels.
3. Methods
3.1. Study Design
This cross-sectional study was performed by extracting and analyzing data obtained from children aged between 2 and 18 years old referred to a growth assessment clinic for routine growth follow-ups in the city of Shiraz from April to August 2019. The clinic is also a tertiary referral center for other endocrine-related disorders. Geographic coordination for the city of Shiraz is 29°37′N 52°32′E. The Institutional Review Committee of the Islamic Azad University, Kazerun Branch, School of Medicine approved this study (code: IR.IAU.KAU.REC.1398.125). The study was performed in accordance with the Declaration of Helsinki. Signed informed consent was obtained from all participants’ parents or legal guardians.
3.2. Exclusion Criteria
Exclusion criteria were vegetarianism or diseases that may affect zinc or vitamin D levels, including diarrhea, diabetes, kidney or liver disease, as well as sickle cell anemia, malignancy, and autoimmune or other endocrine disorders.
3.3. Anthropometric Data
Based on the above-mentioned exclusion criteria, 454 subjects were simultaneously checked for serum 25-hydroxyvitamin D and zinc levels and thus included in this study. Each subject was checked for weight and height following a standardized procedure (lightly dressed with no shoes). Weight was measured using the Seca scale with 0.1-kg precision, while height was measured using a stadiometer with 0.1-cm precision. Body mass index (BMI), height z-scores, and percentiles were precisely measured using UpToDate calculators based on the LMS (lambda, mu, and sigma) method as established by the US Disease Control and Prevention (CDC) growth charts as follows:
BMI Z-score = ((BMI/M) L − 1)/LS.
3.4. Measurement of Vitamin D and Zinc
After obtaining signed informed consent from the participants and their parents, venous blood samples were taken from children in a non-fasting state between 8 AM and 6 PM, which were then sent to a single laboratory. The samples were stored at -20°C after centrifugation until the day of analysis. Serum 25-hydroxyvitamin D was measured using a Cobas e411 Analyzer (Mannheim, Germany) by the electrochemiluminescence immunoassay (ECLIA) method. Assay performance for 25-hydroxyvitamin D was controlled using Elecsys PreciControl Varia, and Auto Analyser was calibrated using Elecsys Vitamin D CalSet. Serum zinc was measured using a Dirui CS- T240 Auto Chemistry Analyzer (Changchun, China) using Greiner Diagnostic kits (Germany) by the Colorimetric Test (5-Brom-PAPS) method. Assay performance for zinc was controlled using TrueLab N and TruLab P, and Auto Analyser was calibrated using TruCal U. The inter- and intra-assay coefficients of variations were calculated as 1.32 ng/mL and 3.17% for 25-hydroxyvitamin D and 3.12 ng/mL and 2.03% for zinc, respectively.
3.5. Cutoff Levels
The subjects were divided into 2 age groups of 2 - 9 and 10 - 18 years old, representing before and after the start of puberty, respectively. Based on respective BMI percentiles, the subjects were categorized as underweight if they were under the fifth percentile (<−1.65 BMI z-score), as healthy weight if they were between the fifth and eighty-fifth percentile (−1.65 to +1.04 BMI z-score), as overweight if they were between the eighty-fifth and ninety-fifth percentile (+1.04 to +1.65 BMI z-score), and as obese if they were above the ninety-fifth percentile (> +1.65 BMI z-score). Likewise, based on height percentiles, the subjects were categorized as short stature if they were under the fifth percentile (<−1.65 height z-score) and as normal stature if they were equal to or above the fifth percentile.
Vitamin D status in healthy children and adolescents is in terms of the serum 25-hydroxyvitamin D concentrations recommended by UpToDate and the 2016 Global Consensus (22). Vitamin D sufficiency is defined as 20 to 100 ng/mL, while vitamin D insufficiency is defined as < 20 ng/mL. Zinc level reference intervals were not consistent in all studies. Also, to the best of our knowledge, there were no recent guidelines on how to determine serum zinc levels. For this study, we elected to use serum zinc normal level cutoffs based on the Tietz Textbook of Clinical Chemistry employed by the Mayo Clinic Laboratories during the writing of this manuscript (23, 24): The subjects aged between 2 and 10 years old with serum zinc levels lower than 60 ng/mL and the subjects aged 11 years old and above with serum zinc levels lower than 66 ng/mL were considered as zinc deficient.
3.6. Study Analysis
Continuous variables shown in Table 1 and mean 25-hydroxyvitamin D and zinc levels between height and gender status’ shown in Table 2 were compared using a Student t-test, while mean 25-hydroxyvitamin D and zinc levels between BMI status’ in Table 2 were compared using a 1-way analysis of variance (ANOVA). Categorical variables in Tables 1 and 3 were compared using a chi-square test. The relationships between variables were evaluated using the Spearman rank correlation adjusted for age and gender, while odds ratios (ORs) between variables indicated in Table 4 were calculated using logistic regression adjusted for age and gender. The association between 25-hydroxyvitamin D and zinc concentrations in the left graph in Figure 1 was evaluated using a logarithmic correlation, while zinc deficiency was predicted based on serum 25-hydroxyvitamin D levels using a receiver operating characteristics (ROC) plot in the right graph. The optimal cutoff was calculated based on the Youden index. P-values less than 0.05 were considered statistically significant in all the comparisons with 95% CI. All the statistical analyses were performed using SPSS version 25 (SPSS Inc, Chicago, Ill, USA). The ROC plot calculation was also performed using MedCalc version 19.6.1 (MedCalc Software Ltd, Ostend, Belgium).
Table 1.
Anthropometric Characteristics of the Participants
| Status | No. | Sex (% Male) | Age | Height | Height z-Score | Weight | BMI | BMI z-Score | Vitamin D | Zinc |
|---|---|---|---|---|---|---|---|---|---|---|
| Overall | 454 | 39% | 9.40 ± 3.27 | 131.55 ± 19.09 | -0.43 ± 1.21 | 34.38 ± 18.05 | 18.58 ± 5.38 | -0.07 ± 1.80 | 16.59 ± 10.36 | 74.38 ± 14.77 |
| Vitamin D status | ||||||||||
| Sufficient | 135 | 48.9% | 9.30 ± 3.74 | 130.19 ± 22.46 | -0.55 ± 1.25 | 32.93 ± 18.52 | 17.87 ± 5.09 | -0.38 ± 1.71 | 28.68 ± 10.56 | 75.49 ± 13.69 |
| Insufficient | 319 | 34.8% | 9.44 ± 3.06 | 132.12 ± 17.47 | -0.38 ± 1.19 | 34.99 ± 17.84 | 18.88 ± 5.48 | 0.06 ± 1.83 | 11.48 ± 4.18 | 73.91 ± 15.19 |
| P-value | 0.005* | 0.713 | 0.372 | 0.190 | 0.266 | 0.068 | 0.019* | < 0.001* | 0.298 | |
| Zinc status | ||||||||||
| Sufficient | 401 | 38.7% | 9.31 ± 3.19 | 131.20 ± 18.60 | -0.42 ± 1.22 | 33.78 ± 17.16 | 18.44 ± 5.22 | -0.09 ± 1.80 | 16.69 ± 10.20 | 77.22 ± 12.94 |
| Deficient | 53 | 41.5% | 10.06 ± 3.81 | 134.20 ± 22.42 | -0.53 ± 1.14 | 38.87 ± 23.42 | 19.64 ± 6.41 | 0.06 ± 1.84 | 15.85 ± 11.58 | 52.91 ± 8.96 |
| P-value | 0.689 | 0.117 | 0.282 | 0.536 | 0.131 | 0.125 | 0.562 | 0.579 | < 0.001* | |
| Vitamin D insufficient subjects | ||||||||||
| Zinc sufficient | 281 | 34.2% | 9.35 ± 2.93 | 131.82 ± 16.78 | -0.37 ± 1.20 | 34.31 ± 16.79 | 18.70 ± 5.29 | 0.03 ± 1.82 | 11.57 ± 4.07 | 76.88 ± 13.22 |
| Zinc deficient | 38 | 39.5% | 10.07 ± 3.84 | 134.38 ± 22.06 | -0.46 ± 1.13 | 40.01 ± 23.90 | 20.16 ± 6.65 | 0.22 ± 1.90 | 10.75 ± 4.92 | 51.92 ± 9.92 |
| P-value | 0.519 | 0.274 | 0.494 | 0.671 | 0.162 | 0.123 | 0.560 | 0.326 | < 0.001* |
Table 2.
Mean Vitamin D (ng/dL) and Zinc Levels (ng/dL) in Different Body Mass Indices and Height Categories in the Children
| All | BMI Category | Height Category | |||||||
|---|---|---|---|---|---|---|---|---|---|
| Underweight | Healthy Weight | Overweight | Obese | P-Value a | Short Stature | Normal Stature | P-Value b | ||
| All Participants | |||||||||
| All | |||||||||
| No. | 454 | 91 | 204 | 67 | 92 | 77 | 377 | ||
| Vitamin D | 16.59 ± 10.36 | 16.85 ± 10.12 | 17.65 ± 10.87 | 15.95 ± 11.62 | 14.46 ± 7.98 | 0.095 | 16.21 ± 8.91 | 16.67 ± 10.64 | 0.720 |
| Zinc | 74.38 ± 14.77 | 74.23 ± 15.31 | 74.18 ± 16.63 | 75.27 ± 11.98 | 74.33 ± 11.48 | 0.962 | 70.93 ± 11.65 | 75.08 ± 15.24 | 0.024 c |
| Boys | |||||||||
| No. | 177 | 48 | 72 | 16 | 41 | 37 | 140 | ||
| Vitamin D | 18.09 ± 10.31 | 19.57 ± 11.81 | 19.15 ± 10.28 | 14.45 ± 6.37 | 15.91 ± 9.28 | 0.133 | 18.55 ± 10.34 | 17.97 ± 10.33 | 0.762 |
| Zinc | 76.07 ± 14.91 | 77.63 ± 18.37 | 75.69 ± 15.56 | 73.31 ± 9.41 | 76.01 ± 10.58 | 0.776 | 72.37 ± 11.15 | 77.05 ± 15.64 | 0.089 |
| Girls | |||||||||
| No. | 277 | 43 | 132 | 51 | 51 | 40 | 237 | ||
| Vitamin D | 15.64 ± 10.29 | 13.82 ± 6.75 | 16.83 ± 11.13 | 16.42 ± 12.84 | 13.29 ± 6.64 | 0.108 | 14.04 ± 6.77 | 15.91 ± 10.76 | 0.290 |
| Zinc | 73.30 ± 14.60 | 70.43 ± 9.81 | 73.35 ± 17.19 | 75.88 ± 12.70 | 72.98 ± 12.10 | 0.351 | 69.61 ± 12.08 | 73.92 ± 14.91 | 0.084 |
| P-value b, d | |||||||||
| Vitamin D | 0.014 c | 0.005 c | 0.145 | 0.558 | 0.119 | 0.026 c | 0.069 | ||
| Zinc | 0.050 | 0.021 c | 0.338 | 0.458 | 0.210 | 0.302 | 0.054 | ||
| 2 - 9 Years Old | |||||||||
| All | |||||||||
| No. | 257 | 58 | 124 | 35 | 40 | 40 | 217 | ||
| Vitamin D | 16.36 ± 9.98 | 16.83 ± 9.32 | 17.46 ± 10.17 | 15.78 ± 12.26 | 12.78 ± 7.19 | 0.074 | 16.86 ± 10.07 | 16.27 ± 9.98 | 0.734 |
| Zinc | 74.26 ± 13.35 | 75.11 ± 16.00 | 73.55 ± 14.07 | 76.20 ± 7.77 | 73.53 ± 10.57 | 0.696 | 71.86 ± 10.32 | 74.70 ± 13.81 | 0.217 |
| Boys | |||||||||
| No. | 86 | 30 | 39 | 5 | 12 | 19 | 67 | ||
| Vitamin D | 16.60 ± 9.34 | 18.90 ± 10.98 | 16.68 ± 8.00 | 10.08 ± 4.95 | 13.33 ± 9.01 | 0.124 | 19.98 ± 11.99 | 15.65 ± 8.30 | 0.074 |
| Zinc | 76.70 ± 15.30 | 80.20 ± 18.51 | 74.53 ± 14.37 | 77.20 ± 10.76 | 74.78 ± 9.77 | 0.472 | 73.84 ± 11.37 | 77.50 ± 16.22 | 0.360 |
| Girls | |||||||||
| No. | 171 | 28 | 85 | 30 | 28 | 21 | 150 | ||
| Vitamin D | 16.24 ± 10.31 | 14.61 ± 6.63 | 17.82 ± 11.05 | 16.73 ± 12.89 | 12.54 ± 6.44 | 0.093 | 14.03 ± 7.12 | 16.55 ± 10.66 | 0.295 |
| Zinc | 73.03 ± 12.12 | 69.66 ± 10.63 | 73.10 ± 14.00 | 76.04 ± 7.39 | 73.00 ± 11.02 | 0.261 | 70.07 ± 9.18 | 73.45 ± 12.44 | 0.232 |
| P-value b, d | |||||||||
| Vitamin D | 0.784 | 0.076 | 0.563 | 0.267 | 0.755 | 0.061 | 0.539 | ||
| Zinc | 0.055 | 0.010 c | 0.601 | 0.762 | 0.633 | 0.253 | 0.071 | ||
| 10 - 18 Years Old | |||||||||
| All | |||||||||
| No. | 197 | 33 | 80 | 32 | 52 | 37 | 160 | ||
| Vitamin D | 16.89 ± 10.85 | 16.88 ± 11.55 | 17.94 ± 11.93 | 16.13 ± 11.06 | 15.75 ± 8.38 | 0.690 | 15.50 ± 7.52 | 17.21 ± 11.48 | 0.389 |
| Zinc | 74.54 ± 16.46 | 72.67 ± 14.10 | 75.16 ± 20.01 | 74.25 ± 15.40 | 74.94 ± 12.21 | 0.902 | 69.93 ± 13.00 | 75.60 ± 17.02 | 0.059 |
| Boys | |||||||||
| No. | 91 | 18 | 33 | 11 | 29 | 18 | 73 | ||
| Vitamin D | 19.49 ± 11.01 | 20.67 ± 13.34 | 22.08 ± 11.92 | 16.44 ± 6.10 | 16.97 ± 9.33 | 0.223 | 17.03 ± 8.34 | 20.10 ± 11.54 | 0.293 |
| Zinc | 75.49 ± 14.59 | 73.33 ± 17.82 | 77.07 ± 16.98 | 71.55 ± 8.70 | 76.52 ± 11.02 | 0.637 | 70.81 ± 11.01 | 76.64 ± 15.18 | 0.130 |
| Girls | |||||||||
| No. | 106 | 15 | 47 | 21 | 23 | 19 | 87 | ||
| Vitamin D | 14.66 ± 10.24 | 12.34 ± 6.94 | 15.04 ± 11.17 | 15.97 ± 13.08 | 14.21 ± 6.90 | 0.753 | 14.06 ± 6.55 | 14.79 ± 10.91 | 0.778 |
| Zinc | 73.72 ± 17.95 | 71.87 ± 8.23 | 73.82 ± 21.97 | 75.67 ± 17.99 | 72.95 ± 13.55 | 0.932 | 69.10 ± 14.90 | 74.73 ± 18.47 | 0.217 |
| P-value b, d | |||||||||
| Vitamin D | 0.002 c | 0.037 c | 0.008 c | 0.912 | 0.242 | 0.234 | 0.003 c | ||
| Zinc | 0.454 | 0.771 | 0.478 | 0.481 | 0.300 | 0.695 | 0.481 | ||
Abbreviation: BMI, body mass index.
a A P-value based on ANOVA.
b A P-value based on the Student t-test.
c P < 0.05
d A P-value for comparison between the 2 genders.
Table 3.
The Prevalence of Vitamin D Insufficiency and Zinc Deficiency in Different Body Mass Indices and Height Categories in the Children a
| All | BMI Category | Height Category | |||||||
|---|---|---|---|---|---|---|---|---|---|
| Underweight | Healthy Weight | Overweight | Obese | P-Value | Short Stature | Normal Stature | P-Value | ||
| All Participants | |||||||||
| All | |||||||||
| Vitamin D insufficiency | 70.3% | 65.9% | 65.2% | 77.6% | 80.4% | 0.022 b | 68.8% | 70.6% | 0.763 |
| Zinc deficiency | 11.7% | 9.9% | 12.7% | 9.0% | 13.0% | 0.764 | 15.6% | 10.9% | 0.241 |
| Boys | |||||||||
| Vitamin D insufficiency | 62.7% | 52.1% | 58.3% | 81.3% | 75.6% | 0.042 b | 62.2% | 62.9% | 0.938 |
| Zinc deficiency | 12.4% | 12.5% | 12.5% | 18.8% | 9.8% | 0.836 | 16.2% | 11.4% | 0.432 |
| Girls | |||||||||
| Vitamin D insufficiency | 75.1% | 81.4% | 68.9% | 76.5% | 84.3% | 0.114 | 75.0% | 75.1% | 0.989 |
| Zinc deficiency | 11.2% | 7.0% | 12.9% | 5.9% | 15.7% | 0.304 | 15.0% | 10.5% | 0.409 |
| P-value | |||||||||
| Vitamin D insufficiency | 0.005 b | 0.003 b | 0.129 | 0.689 | 0.296 | 0.224 | 0.012 b | ||
| Zinc deficiency | 0.689 | 0.378 | 0.938 | 0.116 | 0.401 | 0.883 | 0.791 | ||
| 2 - 9 Years Old | |||||||||
| All | |||||||||
| Vitamin D insufficiency | 71.6% | 67.2% | 66.1% | 82.9% | 85.0% | 0.044 b | 67.5% | 72.4% | 0.532 |
| Zinc deficiency | 8.2% | 8.6% | 9.7% | 0.0% | 10.0% | 0.298 | 10.0% | 7.8% | 0.646 |
| Boys | |||||||||
| Vitamin D insufficiency | 68.6% | 56.7% | 69.2% | 100.0% | 83.3% | 0.139 | 63.2% | 70.1% | 0.562 |
| Zinc deficiency | 9.3% | 10.0% | 10.3% | 0.0% | 8.3% | 0.900 | 10.5% | 9.0% | 0.835 |
| Girls | |||||||||
| Vitamin D insufficiency | 73.1% | 78.6% | 64.7% | 80.0% | 85.7% | 0.091 | 71.4% | 73.3% | 0.854 |
| Zinc deficiency | 7.6% | 7.1% | 9.4% | 0.0% | 10.7% | 0.353 | 9.5% | 7.3% | 0.723 |
| P-value c | |||||||||
| Vitamin D insufficiency | 0.451 | 0.076 | 0.621 | 0.272 | 0.847 | 0.577 | 0.628 | ||
| Zinc deficiency | 0.639 | 0.698 | 0.883 | - | 0.818 | 0.916 | 0.681 | ||
| 10 - 18 Years Old | |||||||||
| All | |||||||||
| Vitamin D insufficiency | 68.5% | 63.6% | 63.8% | 71.9% | 76.9% | 0.380 | 70.3% | 68.1% | 0.800 |
| Zinc deficiency | 16.2% | 12.1% | 17.5% | 18.8% | 15.4% | 0.878 | 21.6% | 15.0% | 0.325 |
| Boys | |||||||||
| Vitamin D insufficiency | 57.1% | 44.4% | 45.5% | 72.7% | 72.4% | 0.076 | 61.1% | 56.2% | 0.704 |
| Zinc deficiency | 15.4% | 16.7% | 15.2% | 27.3% | 10.3% | 0.618 | 22.2% | 13.7% | 0.369 |
| Girls | |||||||||
| Vitamin D insufficiency | 78.3% | 86.7% | 76.6% | 71.4% | 82.6% | 0.675 | 78.9% | 78.2% | 0.940 |
| Zinc deficiency | 17.0% | 6.7% | 19.1% | 14.3% | 21.7% | 0.622 | 21.1% | 16.1% | 0.602 |
| P-value c | |||||||||
| Vitamin D insufficiency | 0.001 b | 0.012 b | 0.004 b | 0.938 | 0.386 | 0.235 | 0.003 b | ||
| Zinc deficiency | 0.762 | 0.381 | 0.643 | 0.371 | 0.258 | 0.931 | 0.673 | ||
Abbreviations: BMI, body mass index; ANOVA, analysis of variance.
a All P-values are based on the X2 test.
b P < 0.05
c A P-value for comparison between the 2 genders.
Table 4.
Odds Ratio for the Study’s Variants Based on Body Mass Indices and Height Categories a
| Independent Variables | Dependent Variables | P-Value | Odds Ratio (95% CI) | |
|---|---|---|---|---|
| Overall | Overweight and obesity | Vitamin D insufficiency | 0.004 b | 2.004 (1.255 - 3.202) |
| Zinc deficiency | 0.599 | 0.846 (0.454 - 1.577) | ||
| Short stature | Vitamin D insufficiency | 0.961 | 0.987 (0.576 - 1.689) | |
| Zinc deficiency | 0.244 | 1.517 (0.752 - 3.061) | ||
| Boys | Overweight and obesity | Vitamin D insufficiency | 0.003 b | 3.158 (1.492 - 6.685) |
| Zinc deficiency | 0.869 | 0.920 (0.340 - 2.487) | ||
| Short stature | Vitamin D insufficiency | 0.922 | 0.963 (0.455 - 2.038) | |
| Zinc deficiency | 0.428 | 1.510 (0.545 - 4.182) | ||
| Girls | Overweight and obesity | Vitamin D insufficiency | 0.196 | 1.487 (0.815 - 2.714) |
| Zinc deficiency | 0.597 | 0.805 (0.360 - 1.801) | ||
| Short stature | Vitamin D insufficiency | 0.966 | 1.017 (0.467 - 2.217) | |
| Zinc deficiency | 0.400 | 1.516 (0.575 - 3.998) |
a All P-values were adjusted for age and gender
b P < 0.05

Figure 1.
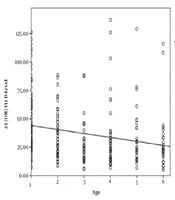
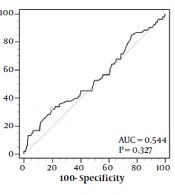
The scatter plot (left) and receiver operating characteristics (right) for the relationship between zinc and vitamin D levels. The curve line in the left graph represents an inverse correlation in the association of vitamin D with zinc levels. The circle in the right graph represents an optimal cutoff for predicting zinc deficiency using vitamin D levels.
4. Results
Table 1 demonstrates an overview of the characteristics of the participants. Significant differences in the number of male vs female participants and BMI z-scores between sufficient and insufficient vitamin D subjects are illustrated. Therefore, these parameters have to be adjusted when calculating the correlations between variants. It should also be noted that no significant difference was observed in mean zinc levels between the subjects with sufficient and insufficient vitamin D levels. There was also no significant difference in growth parameters between zinc-sufficient and zinc-deficient subjects with vitamin D insufficiency.
Mean 25-hydroxyvitamin D (ng/mL) and zinc (ng/mL) levels by height and BMI status are shown in Table 2. A decrease was seen in mean 25-hydroxyvitamin D levels in higher BMI groups in boys. However, this decrease did not reach statistical significance. Meanwhile, zinc levels were significantly lower in short-stature subjects compared to the normal height participants, though the statistical significance was less prominent after separating the 2 genders. Overall, both vitamin D and zinc levels were significantly lower in girls than in boys, especially in underweight participants.
Table 3 illustrates the prevalence rates of vitamin D insufficiency and zinc deficiency in the subjects based on BMI and height. Obese subjects, specifically obese children aged between 2 and 9 years, had significantly higher proportions of vitamin D insufficiency compared to their respective healthy weight and underweight counterparts. Incidentally, unlike the data shown in Table 2, no statistically significant difference was seen in zinc deficiency between short and normal-stature subjects. Meanwhile, girls have a significantly higher prevalence of vitamin D insufficiency than boys. However, the difference in the prevalence of zinc deficiency between the 2 genders was not statistically significant.
The partial Spearman correlation of height and BMI z-scores with 25-hydroxyvitamin D and zinc levels were calculated and adjusted for age and gender. A significant negative correlation was observed between BMI z-score and 25-hydroxyvitamin D levels (r = -0.098; P = 0.038), and a significant positive correlation was found between height z-score and serum zinc levels (r = 0.098; P = 0.037). Zinc and 25-hydroxyvitamin D concentrations were also positively correlated (r = 0.099; P = 0.036), meaning lower vitamin D levels are likely to be accompanied by lower serum zinc levels. The adjusted Spearman correlation was not significant between zinc and BMI z-scores (r = 0.084; P = 0.073), as well as between 25-hydroxyvitamin D and height z-scores (r = -0.059; P = 0.207). The adjusted linear Pearson correlation between the study’s variants was not statistically significant.
Based on Table 4, adjusted for age and gender, overweight and obese children were 2.004 times as likely to have vitamin D insufficiency than healthy weight and underweight subjects. In addition, overweight and obese boys were specifically 3.158 times as likely to have vitamin D insufficiency than their healthy and underweight counterparts. Despite short-stature children experiencing lower mean zinc levels based on Table 2, their ORs for zinc deficiency were not significantly higher than normal stature children.
The left graph shown in Figure 1 demonstrates a scatterplot of serum zinc levels correlated with serum 25-hydroxyvitamin D in 454 subjects. A significant inverse correlation is exhibited between the 2 factors (r2 = 0.016; P = 0.007; y = -31.31x-1 + 77.04) with a sudden drop in serum zinc levels at the lower end of serum vitamin D concentrations. The right graph demonstrates receiver operating characteristics to predict zinc deficiency using serum vitamin D levels. A 25-hydroxyvitamin D cutoff of ≤ 8.6 ng/mL with the highest Youden index of 0.1312 could predict zinc deficiency with a sensitivity of 32.0% and a specificity of 81.05%. Adjusted for age and gender, subjects with vitamin D levels equal to or lower than 8.6 ng/mL were 2.081 times (95% CI, 1.097 - 3.948) as likely to have zinc deficiency compared to the subjects with vitamin D levels higher than 8.6 ng/mL. Although mean zinc levels were significantly lower in subjects with 25-hydroxyvitamin D levels of ≤ 8.6 ng/mL than in other vitamin D insufficient subjects (70.67 ± 14.11 vs 75.24 ± 15.45 ng/mL; P = 0.014), mean age, height, and BMI z-score were not significantly different between the 2 groups. Participants with 25-hydroxyvitamin D levels of ≤ 8.6 ng/mL were also more likely to be female than other vitamin D insufficient subjects (74.2% vs 61.5%; P = 0.031).
5. Discussion
It is important to note that in various studies, definitions proposed for normal, inadequate, and deficient vitamin D and zinc concentrations vary, which should be considered in the interpretation of these studies.
In our study, we found a positive non-linear correlation between vitamin D and zinc levels, especially at the lower end of vitamin D concentrations. Similar results were also found in the study by Shams et al., performed on Iranian children aged between 10 and 18 years old (10). Zinc elements bind to VDRs. In addition, modulation of intracellular VDR activity by the formation of protein-DNA complexes also seems to be influenced by zinc concentrations (11). Vitamin D also increases the expression of SLC30A10, a gene mostly expressed in the small intestine. This, in turn, increases the production of the ZnT10 protein, a zinc transporter, in cells (12). We suspected malnutrition to be the main culprit in the association between low vitamin D and zinc levels, considering that the correlation was mainly seen at the lower end of vitamin D concentrations. However, the modulatory effect of serum vitamin D on zinc absorption cannot be ruled out.
According to our study, the prevalence rate of vitamin D insufficiency was 70.3% in the total population, 62.7% in boys, and 75.1% in girls. The prevalence rates of vitamin D deficiency in children worldwide were 67.1% in Spain (15), 85.6% in Iran (25), 65% in the United Arab Emirates (26), and 76.8% in New York (16). In our study, the prevalence of vitamin D insufficiency was significantly higher in girls than in boys. One of the hypothetical reasons for this may be the difference in the clothing of girls and boys, especially those aged 10 and older, of which girls, due to religious reasons, have to use a veil that exposes fewer parts of their bodies to sunlight. In addition, boys are more likely to spend time in open areas and outdoor environments. In the studies by Barja-Fernández et al. in Spain and Aypak et al. in Turkey, vitamin D levels were lower in girls than in boys (15, 27). In the studies by Mohammadian et al. in Iran and Moore and Liu in the USA, there was no significant difference in vitamin D levels between girls and boys (25, 28). Conversely, in the study by Lee et al., mean vitamin D was higher in girls than in boys (14).
According to our study, an increase in BMI in boys led to lower vitamin D concentrations and a higher prevalence of vitamin D insufficiency. Accordingly, these results were not observed in girls. The results of various studies are controversial in determining the relationship between BMI and vitamin D deficiency. There was no correlation between BMI and vitamin D levels in the studies by Aypak et al. in Turkey and Mohammadian et al. in Iran (25, 27). However, Moore and Liu found a strong link between vitamin D deficiency and obesity in American children (28). Furthermore, in the studies by Lee et al. in Korea, Smotkin-Tangorra et al. in New York, Gonzalez et al. in Puerto Rico, and Barja-Fernandez et al. in Spain, the prevalence of vitamin D deficiency increased by increasing BMI (14-16, 29).
Overall, in most studies, an increase in BMI in children resulted in decreasing mean vitamin D levels and increasing vitamin D insufficiency. The factors causing lower vitamin D levels in obese people are not well-known. What is the cause and causality in the relation between vitamin D and BMI? In this regard, what is known is that skin vitamin D production in obese patients is not as same as in normal-weight patients (30). In addition, vitamin D storage in adipose tissue can decrease its interaction with 25-hydroxylase (31). Subjects taking vitamin D supplements also had better control of body weight in some studies (32). Another aspect concerning higher BMI is that hyperparathyroidism secondary to obesity can decrease serum 25-hydroxyvitamin D levels, and higher parathyroid hormone concentrations can lead to calcium entry into adipocytes, which, in turn, can cause lipogenesis and decrease lipolysis (33). However, vitamin D insufficiency or deficiency after bariatric surgery remains high, which can lead to lower body weights (34).
Based on our findings, 11.7% of all studied subjects were zinc deficient. This ratio was almost the same for girls and boys. According to the estimations of the Food and Agriculture Organization (FAO), 17% of the world’s population are zinc deficient (35). Based on studies in Iran, zinc deficiencies in Iranian children have ranged from 17.5% of children in Bandar Abbas City (36) to 7.2% in Khomeini Shahr City (37). In contrast to the estimation of FAO and the results of studies in developing countries, zinc deficiency in Iran is not a common problem. Perhaps this is due to people’s dietary habits or the possibility of more zinc prescriptions by general practitioners and pediatricians. Based on our results, there is no significant difference in the prevalence rates of zinc deficiency in children with different BMIs. Correspondingly, these results are similar in girls and boys. Therefore, zinc deficiency cannot be considered one of the causes of low weight.
According to our findings, the average level of zinc in short children was lower than that of normal children, and this difference was statistically significant. It is important to note that when we separately looked at each gender in this study group, while the mean zinc level was lower in short girls and short boys than in their normal height counterparts, this difference was not statistically significant. This can be due to a limitation in the Student t-test analysis method. The Student t-test depends on the number of samples in a study. As a result, the lower the number of subjects in each gender group compared to the overall number, the more the P-value. Due to this limitation, adjusted Spearman rho is used to obtain a better understating of the correlation between serum zinc levels and height z-score. Based on our results, a positive correlation existed between zinc levels and height z-scores, only presented in male subjects. This means that severe stunting is accompanied by lower zinc levels.
Although most studies in this field reached the same conclusion, some studies did not, and the answer to this question is not always consistent. According to a meta-analysis, zinc supplementation has a significant positive effect on linear growth in developing countries. Accordingly, the study showed an overall increase of 0.37 ± 0.25 cm in zinc-supplemented groups compared to placebo groups (21). In the study by Wessells and Brown on the data obtained from FAO, the prevalence of zinc deficiency was found to be correlated with the prevalence of stunting in children under the age of 5 years old (35). In randomized clinical trials by Soofi et al. in Pakistan and Abdollahi et al. in Iran, children in the intervention group receiving zinc supplements gained an extra 0.5 cm compared to the control group (38, 39). On the other hand, in the clinical trial study by Barffour et al., supplemental micronutrients had no effect on growth in children, despite improving zinc status (40).
5.1. Conclusions
Very low vitamin D levels are more likely to be accompanied by zinc deficiency, possibly caused by malnutrition and the modulatory effect of serum vitamin D on zinc absorption. Unlike zinc deficiency, vitamin D insufficiency is much more prevalent in Iranian children than in the population of the rest of the world. Reduction in body weight is the first step in controlling vitamin D insufficiency in the Iranian population. No significant difference was seen in zinc deficiency between the short and normal-stature children. As a result, children referred to health clinics should be evaluated for zinc deficiency regardless of their height status.