
1. Background
While coronavirus disease-2019 (COVID-19), which has been causing acute respiratory syndrome since May 2020, has become the most prevalent health issue worldwide, reports of multisystem inflammatory syndrome in children (MIS-C) are on the rise (1, 2). This novel syndrome has been identified using various terms, including MIS-C in the UK and the US, and by the World Health Organization (WHO) as, temporarily, pediatric multisystem inflammatory syndrome related to SARS-CoV-2 infection (3-5).
Numerous studies from around the world have evaluated cardiac dysfunction in MIS-C (6-9). According to various publications, cardiovascular findings range from 34% to 82% (1, 5, 10). Previously, changes in the electrocardiogram (ECG) and abnormalities in the conduction system have been reported in 7 - 67% of MIS-C patients (11, 12). Moreover, many studies have reported arrhythmias, including cases of MIS-C with advanced atrioventricular (AV) block requiring temporary transvenous pacing (6, 13). Although most studies have reported ECG findings at admission in MIS-C patients, the changes in long-term ECG findings, their duration of persistence, and the relationship between long-term ECG abnormalities and laboratory findings have not been extensively documented (8, 9, 12, 14).
2. Objectives
Therefore, this study aims to evaluate and compare repeated ECGs and laboratory indicators in children diagnosed with MIS-C at their initial hospital admission.
3. Methods
This prospective study was conducted at Istanbul Başakşehir Çam and Sakura City Hospital between December 2020 and October 2022. Repeat electrocardiographic examinations and laboratory testing were performed on 72 individuals. The study was approved by the Marmara University Faculty of Medicine Ethics Committee. Before admission, written informed consent was obtained from the parents.
The study population consisted of patients diagnosed with MIS-C who underwent ECG examinations at initial admission, 2 weeks later, 1 month later, and 3 months later. Patients with underlying cardiac disease, a history of arrhythmias, metabolic illnesses, chronic hepatic, renal, or neuromotor diseases, or those who had previously received chemotherapy were excluded from the study.
All hospitalized patients under suspicion were tested for the SARS-CoV-2 virus using nasopharyngeal swabs, polymerase chain reaction (PCR), and immunoglobulin G antibodies. The clinical diagnosis of MIS-C was based on the criteria established by the WHO and the Centers for disease control and prevention (CDC) of the United States (1, 3, 5). Included were patients with clinical symptoms of MIS-C, multiorgan (two or more) dysfunction, positive SARS-CoV-2 PCR and/or positive serology test results, and known exposure to COVID-19 (3). The results of research conducted to rule out other infectious etiologies were negative for alternative viral and bacterial diagnoses.
Routine blood tests, including blood cell counts, biochemical profiles, and systemic inflammation indicators such as C-reactive protein (CRP), erythrocyte sedimentation rate (ESR), procalcitonin, ferritin, D-dimer, fibrinogen, lactate dehydrogenase (LDH), and interleukin 6, were conducted three times: At the initial examination, during the first week, and in the first month for all patients diagnosed with MIS-C. Levels of troponin T (ng/L) and brain natriuretic peptide (BNP, ng/L) were tested upon admission and throughout the hospital stay. Patients with high levels of both troponin and BNP underwent re-evaluation during follow-up.
Electrocardiographic and echocardiographic evaluations were performed for all hospitalized patients suspected of having MIS-C. Data were recorded, and electrocardiography was conducted after the initial admission, then 2 weeks later, 1 month later, and 3 months later. The initial ECGs were performed before the start of treatment.
All ECGs were recorded at a standard rate of 25 mm/sec and a gain setting of 10 mm/mV amplitude. The ECGs were then transferred to a personal computer and evaluated at 400% magnification using Adobe Photoshop software to minimize false measurements. In the standard 12-channel measurements, the presence of sinus rhythm, QT, JT, QTc, JTc (in lead II or V5), Tp-Te duration, Tp-Te/QT, Tp-Te/BazzetQTc, pathological Q wave presence, left anterior hemiblock (LAHB), left ventricular hypertrophy (LVH), and right ventricular hypertrophy (RVH) were recorded. Wide QRS duration appropriate for age, RSR' patterns in V1-3 as indications of right bundle branch block (RBBB), dominant S wave in V1, and broad monophasic R waves in lateral leads as left bundle branch block (LBBB) were noted. A wide bifid P wave and a P duration greater than 100 ms in lead II were used to define left atrial enlargement, and a P wave amplitude exceeding 2 mm in DII or V1 indicated right atrial enlargement.
Sinus tachycardia was evaluated based on age; first-degree AV block was assessed by age and heart rate; a wide QRS was measured by age and the 98th percentile; abnormal P wave, QRS, and T axis were evaluated by age and degree; and ST-T changes and QRS-T wave angle were assessed by T wave negativity, with long QTc results considered abnormal if > 440 ms in boys and > 450 ms in girls, respectively (15). According to the AHA guidelines for Kawasaki disease, coronary arteries were evaluated by measuring from the inner edge to inner edge, except at branch points, which may exhibit typical focal dilatation (16). Using the Boston z-score approach, coronary artery anomalies were categorized as follows: No involvement < 2, dilatation ≥ 2 to < 2.5, small aneurysm ≥ 2.5 to < 5, medium aneurysm ≥ 5 to < 10, and massive or giant aneurysm ≥ 10.
In this study, ECGs were taken at the time of admission, and again after 2 weeks, 1 month, and 3 months in patients with MIS-C. Patients with significant ECG abnormalities or a coronary artery aneurysm and other echocardiographic findings were closely monitored. Changes in clinical status were recorded, and 24-hour Holter rhythm monitoring was conducted in patients exhibiting arrhythmic symptoms such as dizziness, palpitations, and syncope. The primary endpoint for the study was the detection of arrhythmias or ischemia on ECG in patients with or without a coronary aneurysm. The secondary endpoint was defined as the occurrence of minor ECG changes. Follow-up for clinical endpoints involved reviewing outpatient and inpatient medical records.
3.1. Statistical Analysis
Analyses were conducted using the SPSS version 22 package (statistical package for social sciences; SPSS Inc., Chicago, IL). In the study, descriptive data are presented as counts (n) and percentages for categorical data, and as means with standard deviations (mean ± SD) and median values for continuous data. The conformity of continuous variables to normal distribution was assessed using the Kolmogorov-Smirnov test. For comparing multiple repeated measurements, a repeated measures analysis of variance (ANOVA) was used for normally distributed variables, and Friedman’s ANOVA test was used for non-normally distributed variables. For the repeated measures ANOVA, the P-value from the Greenhouse-Geisser test was used when the sphericity assumption was not met. Among the categorical variables, the Cochran test was used for repeated measurements, while the McNemar test was employed as the Cochran Post-Hoc Test to identify which measurements differed between repeated assessments.
The patients were divided into two groups based on the anomalies in their repetitive ECGs (Table 1). In the first analysis, two groups of patients were compared: Those with abnormal ECG findings over an extended period and those whose ECG findings were normal or had returned to normal. In the second analysis, four groups were compared: Patients with normal findings at the time of admission that persisted at long-term follow-up, patients with a normal ECG at admission that later developed abnormalities, patients with reversible abnormalities, and patients with abnormal findings at the time of admission that persisted at long-term follow-up.
For comparing the first set of ECG groups, the Student t-test was used for variables with a parametric distribution, while the Mann-Whitney U-test was used for variables without a parametric distribution. To compare the second set of ECG groups, a one-way ANOVA was conducted for laboratory findings with a normal distribution, accompanied by the Bonferroni test for post-hoc analysis. For laboratory findings with a non-normal distribution, the Kruskal-Wallis test was performed. Additionally, the test of homogeneity of variances was used to assess the normal distribution of the variables. The significance level for the analyses was set at P < 0.05.
4. Results
The study included 25 female patients among 72 MIS-C cases. Table 2 outlines the demographic, medical features, and complaints of the patients. The average duration of hospitalization was 12.1 ± 6.3 days (median: 10), and mitral regurgitation and left ventricular systolic dysfunction were observed in 25% of the patients. Coronary artery involvement was detected in two patients (3%). In one patient, the following were noted: Proximal dilatation of the left coronary artery (LCA) (z score: + 2.08), medium aneurysm in the distal LCA (z score: + 5.5), small aneurysm in the proximal right coronary artery (RCA) (z score: + 2.6), medium aneurysm in the distal RCA (z score: + 5.7), and a minor aneurysm in the left anterior descending artery (LAD) (z score: + 4.1).
Table 1.
Comparison of Laboratory Results of Patients at First Admission According to Long Term Electrocardiogram (ECG) Findings
| Variables | Total (N = 72) | A (N = 24) | B (N = 48) | P-Value | C (N = 6) | D (N = 4) | E (N = 42) | F (N = 20) | P0 | P1 | P2 | P3 | P4 | P5 | P6 |
|---|---|---|---|---|---|---|---|---|---|---|---|---|---|---|---|
| ALC | 1536 ± 820 | 1295 ± 451 | 1621 ± 913 | 0.025 | 785 ± 387 | 1582 ± 423 | 1807 ± 899 | 1208 ± 514 | 0.648 | 0.019 | 1.000 | 1.000 | 1.000 | 0.038 | 0.006 |
| Troponin (ng/L) | 3 (942 - 3) | 4.1 (219 - 3) | 3.8 (942 - 3) | 0.035 | 31 (99 - 3) | 3.3 (38 - 3) | 3.1 (942 - 3) | 4.2 (219 - 3) | 1.000 | 1.000 | 1.000 | 1.000 | 1.000 | 1.000 | 0.940 |
| Ferritin (ng/mL) | 269 (1465 - 38) | 321 (1465 - 56) | 211 (1055 - 38) | 0.026 | 685 (1055 - 146) | 205 (586 - 103) | 199 (571 - 38) | 361 (1465 - 56) | 1.000 | 0.041 | 1.000 | 1.000 | 1.000 | 0.077 | 0.011 |
| Fibrinogen (mg/dL) | 544 ± 162 | 553 ± 153 | 539 ± 169 | 0.744 | 705 ± 67 | 442 ± 115 | 515 ± 166 | 577 ± 162 | 0.084 | 0.078 | 0.630 | 1.000 | 0.710 | 1.000 | 0.035 |
Abbreviations: ALC, absolute lymphocyte count; A, patients with abnormal electrocardiogram (ECG) findings for a long time; B, patients whose ECG findings are normal/return to normal; C, patients with normal findings at time of admission that are still present at long term follow-up; D, patients with normal ECG at admission that develop some abnormality; E, patients with reversible abnormalities; F, patients with abnormal findings at time of admission that are still present at long term follow-up; P0, P-values between the values of patients at the C and values of patients at D; P1, P-values between the values of patients of C and values of patients at E; P2, P-values between the values of patients of C and values of patients at F; P3, P-values between the values of D and values of patients at E; P4, P-values between the the values of D and values of patients at the F; P5, P-values between the the values of E and values of patients at the F; P6, P-value for assessment of all values.
Table 2.
Demographic and Clinical Features of Patients
| Variables | Values a |
|---|---|
| Characteristics of patients | |
| Number of patients | 72 |
| Age (mon) | 90 (18 - 208) |
| Sex (female/male) | 25/47 |
| Weight (kg) | 25 (11.5 - 100) |
| Height (cm) | 126 (84 - 185) |
| BMI (kg/m2) | 16.8 (12.7 - 29.2) |
| Complaints | |
| Fever | 60 (83) |
| Duration of fever (day) | 3 (0 - 20) |
| Cough | 7 (10) |
| Duration of cough (day) | 0 (0 - 10) |
| Runny nose | 1 (1) |
| Throat ache | 5 (7) |
| Myalgia | 2 (3) |
| Abdominal pain | 38 (53) |
| Appendicitis | 1 (1) |
| Shortness of breath | 2 (3) |
| Radiology | |
| Bilateral infiltration on chest X-ray | 19 (26) |
| Duration of stay in hospital (day) | 12.1 ± 6.3 |
| Presence of need for ICU | 13 (18) |
| Anti COVID-19 Ag (+) | 38 (53) |
| Medical therapy | |
| Milrinone | 16 (22) |
| IVIG | 52 (71) |
| Corticosteroid | 55 (76) |
| Aspirin | 48 (67) |
| low-molecular-weight heparin | 10 (14) |
| IL1 receptor antagonist | 5 (7) |
| Antibiotics | 59 (%) |
| Ceftriaxone + teicoplanin | 36 |
| Ceftriaxone | 6 |
| Ceftriaxone + teicoplanin + clindamycin | 5 |
| Ceftriaxone + vancomycin | 2 |
| Others | 10 |
| Findings of echocardiography | |
| Mitral regurgitation/decreased left ventricular systolic function | 18 (25) |
| Coronary artery involvement | 2 (3) |
| LMCA proximal (mm) | 2.6 (1.3 - 4.3) |
| LMCA proximal z score | -0.63 (-2.77 - 2.08) |
| LMCA distal (mm) | 2 (1.2 - 4.2) |
| LMCA distal z score | -1.59 (-3.90 - 5.52) |
| RCA proximal (mm) | 2.2 (1.3 - 6) |
| RCA proximal z score | -0.41 (-2.29 - 9.9) |
| RCA distal (mm) | 1.8 (1 - 4.9) |
| RCA distal z score | -0.38 (-2.26 - 5.72) |
| LAD (mm) | 1.6 (0.8 - 4.1) |
| LAD z score | -1.21 (-3.60 - 4.12) |
Abbreviations: CT, computerized tomography; LAD, left anterior descending artery; LMCA, left main coronary artery; RCA, right coronary artery; ICU, intensive care unit; IVIG, intravenous immunoglobulin; SD, standard deviation.
a Values are expressed as median (max - min), mean ± SD or No. (%) unless otherwise indicated.
In the other patient, a medium aneurysm was detected in the proximal RCA (z score: +9.9).
Table 3 compares the laboratory results of the patients at admission, one week later, and one month later. There were statistically significant differences in the serial measurements of WBC, hemoglobin, platelet count, absolute lymphocyte count, absolute neutrophil count, CRP, procalcitonin, ESR, ALT, D-dimer, total protein, albumin, troponin T, pro-B-type natriuretic peptide, blood urea nitrogen(BUN), ferritin, and interleukin-6 (P < 0.05). Significant differences were observed in parameters such as hemoglobin, absolute lymphocyte count, total protein, albumin, and BUN, which were low at initial admission, while others were high. Over time, laboratory values generally improved. Procalcitonin and CRP levels were normal in two patients at initial admission, whereas pro-BNP levels (> 100 pg/mL) and Troponin T levels (> 14 ng/L) were elevated in 59 and 25 patients, respectively.
Table 3.
Comparison of Laboratory Results
| Variabilities | On Admision | One Week Later | P1 a | After One Month | P2 b | P3 c | P |
|---|---|---|---|---|---|---|---|
| White blood cell count (/mm3) | 8.7 (43.8 - 0.98) | 8.7 (26.1 - 15.6) | 0.935 | 7.2 (18.9 - 6.0) | 0.003 | 0.010 | 0.017 |
| Hemoglobin (g/dL) | 11.3 ± 1.3 | 12.3 ± 1.2 | < 0.01 | 12.4 ± 1.1 | 0.599 | < 0.01 | < 0.01 |
| Platelet count (/mm3) | 184 (814 - 82) | 347 (719 - 3.4) | < 0.01 | 130 (606 - 3.3) | 0.163 | 0.01 | < 0.01 |
| Absolute lymphocyte count | 1.28 (3.6 - 0.26) | 2.9 (11.0 - 1.0) | < 0.01 | 3 (5.7 - 0.9) | 0.082 | < 0.01 | < 0.01 |
| Absolute neutrophil count | 6.7 (39.8 - 2.4) | 5.7 (14.3 - 1.1) | 0.008 | 3.5 (10.8 - 1.18) | 0.006 | < 0.01 | < 0.04 |
| CRP (mg/L) | 148 (412 - 5.3) | 0.7 (199.8 - 0.1) | < 0.01 | 0.7 (100.2 - 0.1) | 0.820 | < 0.01 | < 0.01 |
| Procalcitonin (ng/mL) | 1.5 (66.9 - 0.04) | 0.05 (0.81 - 0.02) | < 0.01 | 0.03 (0.11 - 0.02) | 0.129 | < 0.01 | < 0.01 |
| ESR (mm/h) | 43.5 (77 - 7) | 6 (43 - 2) | < 0.01 | 5.5 (29 - 2) | 0.043 | < 0.01 | < 0.01 |
| ALT (IU/L) | 18 (37 - 6) | 22.5 (53 - 6) | 0.002 | 13.5 (78 - 5) | 0.028 | 0.025 | 0.080 |
| AST (IU/L) | 26 (43 - 12) | 24 (43 - 7) | 0.431 | 22 (45 - 9) | 0.127 | 0.033 | 0.835 |
| Lactate dehydrogenase (IU/L) | 249.5 ± 66.4 | 260.0 ± 73.3 | NS | 229.7 ± 44.3 | NS | NS | NS |
| INR | 1.15 ± 0.19 | 0.97 ± 0.09 | 0.851 | 2.34 ± 3.5 | 0.707 | 0.083 | 0.255 |
| D-Dimer (μgFEU/mL) | 1.7 (11.3 - 0.2) | 0.3 (3.5 - 0.1) | < 0.01 | 0.2 (1.6 - 0.1) | 0.006 | < 0.01 | < 0.01 |
| Total bilirubin (mg/dL) | 0.2 ± 0.06 | 0.51 ± 0.25 | 0.796 | 0.30 ± 0.14 | 1.000 | 1.000 | 0.472 |
| Direct blirubin (mg/dL) | 0.3 (0.6 - 0.08) | 0.15 (0.17 - 0.08) | 0.593 | 0.12 (0.17 - 0.08) | 0.327 | 0.893 | 0.867 |
| Total protein (g/L) | 68.0 ± 9.47 | 74.0 ± 5.9 | 0.196 | 72.8 ± 4.20 | 1.000 | 0.204 | 0.049 |
| Albumin (g/L) | 38.1 ± 6.3 | 46.1 ± 2.7 | < 0.01 | 46.9 ± 5.4 | 1.000 | 0.001 | < 0.01 |
| Creatine kinase (U/L) | 62 (293 - 17) | 32 (118 - 3) | 0.055 | 39 (115 - 19) | 0.893 | 0.650 | 1.000 |
| Troponin T (ng/L) | 6.6 (942 - 3) | 3 (26.5 - 3) | < 0.01 | 3 (5.2 - 3) | 0.100 | < 0.01 | 0.004 |
| Pro b - type natriuretic peptide (pg/mL) | 398 (14850 - 56.6) | 70.8 (177 - 20.6) | < 0.01 | 42.8 (121 - 3.2) | 0.015 | 0.004 | < 0.01 |
| Blood urea nitrogen (mg/dL) | 19.0 ± 4.9 | 26.0 ± 10.2 | 0.007 | 21.2 ± 6.4 | 0.201 | 0.443 | 0.009 |
| Creatinine (mg/dL) | 0.48 ± 0.13 | 0.46 ± 0.12 | 0.775 | 0.46 ± 0.12 | 1.000 | 1.000 | 0.469 |
| Ferritin (ng/mL) | 229 (1055 - 38) | 46 (342 - 11) | < 0.01 | 27 (331 - 6) | < 0.01 | < 0.01 | < 0.01 |
| Fibrinogen (mg/dL) | 544.7 ± 162.2 | 353.8 ± 147.9 | NS | 226.5 ± 16.2 | NS | NS | NS |
| Interleukin 6 (pg/mL) | 52.4 (1371 - 1.5) | 1.54 (90.8 - 1.5) | < 0.01 | 1.54 (17.6 - 1.5) | 0.841 | < 0.01 | < 0.01 |
Abbreviations: ALT, alanine aminotransferase; AST, aspartate aminotransferase; BMI, Body Mass Index; ESR: erythrocyte sedimentation rate; CRP, C- reactive protein; CK, creatine kinase; INR, international normalized ratio.
a P-values between the values of patients at the initial and values of patients one week later.
b P-values between the values of patients of 1 week later and values of patients at the first month.
c P-values between the values of patients of initial and values of patients at the first month.
The comparison of the ECG results of the patients at admission, two weeks later, one month later, and three months later is shown in Table 4. The "on admission" section of Table 4 presents ECG changes observed at the first admission of patients with MIS-C myocarditis. Statistically significant differences were noted among the heart rate, PR interval, QRS duration, QT duration, Fredericia QTc, JT interval, ST-T changes, presence of sinus tachycardia, first-degree AV block, presence of wide QRS, abnormal QRS axis, abnormal T axis, and the serial measurements of long QTc values (P < 0.05, Figures 1, 2 and 3). Over time, there were decreases in heart rate, prolongation of the PR interval, increases in QRS and QT durations, Fredericia QTc duration, and JT interval, and decreases in sinus tachycardia, first-degree AV block, wide QRS, abnormal QRS axis, abnormal T axis, long QTc, and ST-T changes.
Table 4.
Findings in Electrocardiogram of Multisystem Inflammatory Syndrome in Children Patients
| ECG Variabilites | On Admision | 2 Weeks Later | P0 | After One Month | After Three Month | P1 | P2 | P3 | P4 | P5 | P6 | ||||
|---|---|---|---|---|---|---|---|---|---|---|---|---|---|---|---|
| + | - | + | - | + | - | + | - | ||||||||
| Sinus rythym | 61 | 0 | 67 | 0 | NS | 70 | 0 | 72 | 0 | NS | NS | NS | NS | NS | 1.000 |
| Heart rate | 114.2 ± 29.5 | 105.9 ± 20.1 | 1.000 | 104.3 ± 18.8 | 94.1 ± 17.1 | 0.112 | 1.000 | 0.096 | 0.579 | 0.004 | 0.002 | ||||
| PR duration (msn) | 125.9 ± 13.8 | 127.2 ± 15.6 | 1.000 | 122.3 ± 11.9 | 129.8 ± 14.5 | 0.027 | 0.208 | 1.000 | 1.000 | 1.000 | 0.046 | ||||
| QRS duration (msn) | 77.5 ± 7.5 | 76.8 ± 8.1 | 1.000 | 78.4 ± 7.1 | 79.9 ± 6.7 | 1.000 | 1.000 | 0.038 | 1.000 | 0.186 | 0.045 | ||||
| P wave axis | 51.8 ± 19.2 | 50.5 ± 16.3 | 1.000 | 49.1 ± 20.3 | 50.1 ± 14.6 | 1.000 | 1.000 | 1.000 | 1.000 | 1.000 | 0.883 | ||||
| Q wave axis | 57.2 ± 34.7 | 60.7 ± 22.2 | 1.000 | 60.1 ± 16.1 | 62.3 ± 22.9 | 1.000 | 1.000 | 1.000 | 1.000 | 1.000 | 0.614 | ||||
| T wave axis | 28.6 ± 28.7 | 32.0 ± 27.1 | 1.000 | 35.2 ± 21.6 | 37.2 ± 22.9 | 1.000 | 1.000 | 0.994 | 1.000 | 0.639 | 0.309 | ||||
| QT duration (msn) | 313.4 ± 43.4 | 320.5 ± 29.0 | 1.000 | 318.2 ± 29.9 | 343.2 ± 29.3 | 0.001 | 1.000 | 0.032 | 1.000 | 0.012 | 0.003 | ||||
| Bazzet QTc (msn) | 422.4 ± 24.5 | 420.6 ± 15.9 | 1.000 | 415.0 ± 13.1 | 425.2 ± 13.4 | 0.017 | 0.342 | 0.942 | 0.848 | 1.000 | 0.169 | ||||
| Fredericia QTc (msn) | 381.6 ± 25.7 | 384.5 ± 16.1 | 1.000 | 379.5 ± 15.8 | 395.5 ± 13.1 | < 0.01 | 0.738 | 0.059 | 1.000 | 0.137 | 0.021 | ||||
| JT interval (msn) | 240 (320 - 160) | 240 (290 - 200) | 0.410 | 240 (280 - 200) | 260 (320 - 220) | 0.001 | 0.447 | 0.008 | 0.231 | 0.007 | 0.002 | ||||
| JTc interval (msn) | 316.2 ± 29.2 | 324.9 ± 25.0 | 1.000 | 314.4 ± 15.5 | 329.5 ± 24.0 | 0.078 | 0.515 | 1.000 | 1.000 | 1.000 | 0.115 | ||||
| Tp-Te duration (msn) | 7 (10 - 5) | 7 (10 - 4) | 0.131 | 6 (8 - 6) | 7 (10 - 5) | 0.069 | 0.835 | 0.387 | 0.079 | 0.946 | 0.305 | ||||
| Tp-Te/QT | 0.022 ± 0.003 | 0.020 ± 0.004 | 0.412 | 0.020 ± 0.003 | 0.020 ± 0.003 | 1.000 | 1.000 | 1.000 | 0.162 | 0.162 | 0.115 | ||||
| Tp-Te/Bazzet QTc | 0.016 ± 0.002 | 0.015 ± 0.003 | 1.000 | 0.015 ± 0.001 | 0.016 ± 0.002 | 1.000 | 1.000 | 1.000 | 1.000 | 1.000 | 0.413 | ||||
| Sinus tachycardia | 11 (15) | 61 | 5 (7) | 67 | 0.210 | 2 (3) | 70 | 0 | 72 | 0.500 | 0.453 | 0.063 | 0.012 | 0.001 | 0.010 |
| Sinus bradicardia | 1 (1.4) | 71 | 0 | 72 | NS | 0 | 72 | 0 | 72 | NS | NS | NS | NS | NS | 1.000 |
| First degree AV block | 5 (7) | 67 | 1 (1.4) | 71 | 0.219 | 0 | 72 | 0 | 72 | NS | 1.000 | 1.000 | 0.063 | 0.063 | 0.010 |
| Wide QRS | 37 (51) | 35 | 12 (16.6) | 60 | < 0.001 | 8 (11) | 64 | 6 (8) | 66 | 0.687 | 0.219 | 0.070 | < 0.001 | < 0.001 | < 0.001 |
| Abnormal P axis | 4 (5) | 68 | 1 (1.4) | 71 | 0.375 | 2 (3) | 70 | 0 | 72 | 0.500 | 1.000 | 1.000 | 0.687 | 0.125 | 0.172 |
| Abnormal QRS axis | 5 (7) | 67 | 0 | 72 | 0.063 | 0 | 72 | 0 | 72 | NS | NS | NS | 0.063 | 0.063 | 0.002 |
| Abnormal T axis | 6 (8) | 76 | 3 (4) | 69 | 0.219 | 0 | 72 | 2 (3) | 70 | 0.500 | 0.250 | 1.000 | 0.016 | 0.125 | 0.011 |
| Long QTc | 13 (18) | 59 | 2 (3) | 70 | 0.007 | 0 | 72 | 3 (4) | 69 | 0.250 | 0.500 | 1.000 | < 0.001 | 0.021 | < 0.001 |
| ST-T changes | 13 (18) | 59 | 9 (12.5) | 63 | 0.267 | 6 (8) | 66 | 5 (7) | 77 | 1.000 | 0.754 | 0.289 | 0.118 | 0.039 | 0.037 |
| Patological Q wave | 0 | 72 | 0 | 72 | NS | 1 (1.4) | 71 | 0 | 72 | NS | NS | NS | NS | NS | 1.000 |
| LAD | 0 | 72 | 0 | 72 | NS | 1 (1.4) | 71 | 0 | 72 | NS | NS | NS | NS | NS | 1.000 |
| RAD | 2 (3) | 70 | 1 (1.4) | 71 | NS | 0 | 72 | 0 | 72 | NS | NS | NS | NS | NS | 0.194 |
| RBBB | 4 (5.5) | 68 | 0 | 72 | NS | 1 (1.4) | 71 | 0 | 72 | NS | NS | NS | NS | NS | 1.000 |
| LAHB | 1 (1.4) | 72 | 0 | 72 | NS | 0 | 72 | 0 | 72 | NS | NS | NS | NS | NS | 1.000 |
| LBBB | 0 | 72 | 0 | 72 | NS | 1 (1.4) | 71 | 0 | 72 | NS | NS | NS | NS | NS | 1.000 |
| LVH | 1 (1.4) | 71 | 1 (1.4) | 71 | NS | 2 (3) | 70 | 2 (3) | 70 | NS | NS | NS | NS | NS | 1.000 |
| RVH | 0 | 72 | 0 | 72 | NS | 1 (1.4) | 0 | 72 | NS | NS | NS | NS | NS | 1.000 | |
Abbreviations: LAD, left atrial dilatation; LBBB, left bundle brunch block; LAHB, left anterior hemiblock; LVH, left ventricular hypertrophy; RAD, right atrial dilatation; RBBB, right bundle brunch block; NS, no significance; P0, P-value between the values initial and 2 weeks later; P1, P-values between the values of patients at the first month and values of patients at the third month; P2, P-values between the values of patients of 2 weeks later and values of patients at the first month; P3, P-values between the values of patients of 2 weeks later and values of patients at the third month; P4, P-values between the values of initial and values of patients at the first month; P5, P-values between the the values of initial and values of patients at the third month; P6, P-value for assessment of all values.
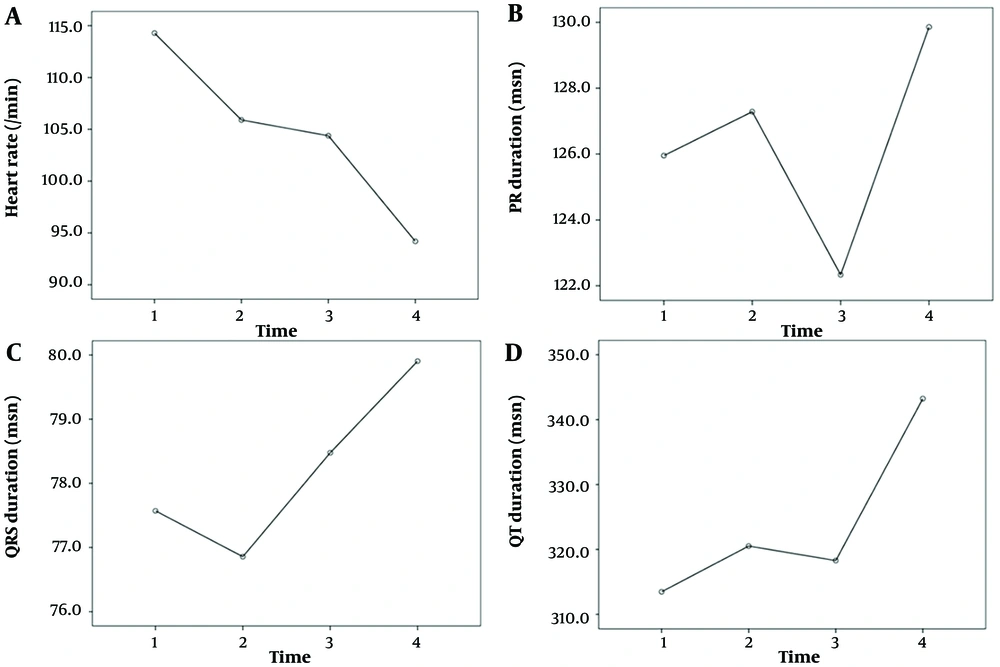
Figure 1.
Time-Varying graph of heart rate, PR, QRS and QT duration values (time 1, on admission; 2, two weeks later; 3, one month later; 4, three month later)
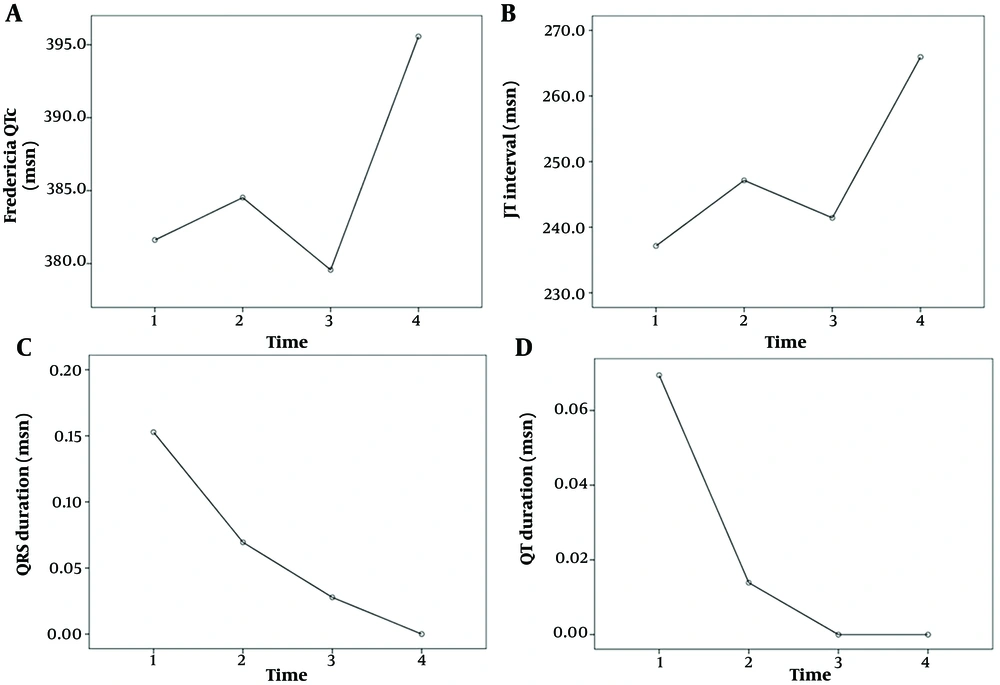
Figure 2.
Time-varying graph of Fredericia QTc, JT interval, sinus tachycardia and first degree AV block (time 1, on admission; 2, two weeks later; 3, one month later; 4, three month later)
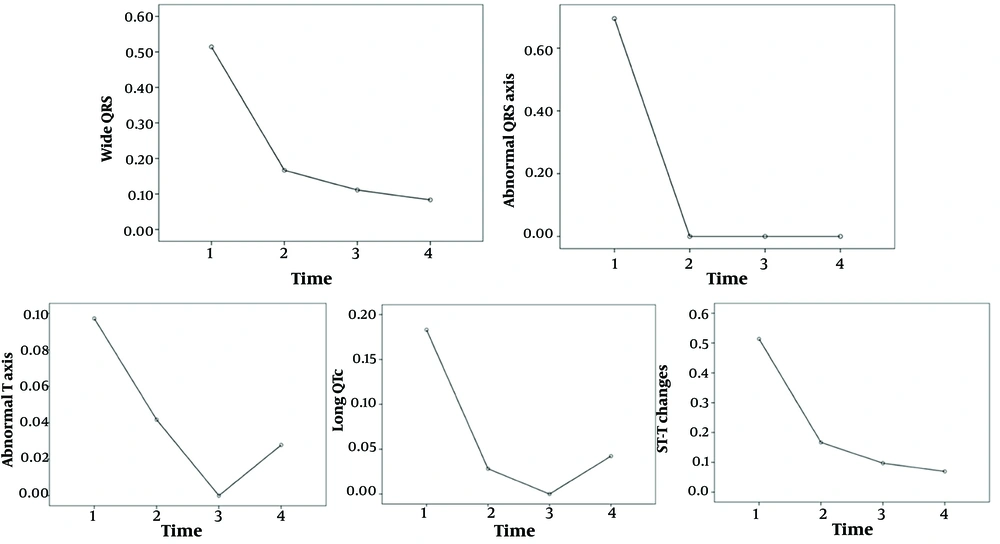
Figure 3.
Time-varying graph of wide QRS, abnormal QRS axis, abnormal T axis, long QTc and ST-T changes (time 1: On admission, 2: Two weeks later, 3: One month later, 4: Three month later)
The comparison of laboratory results of patients at the time of admission, based on long-term ECG findings, is shown in Table 1. Statistically significant differences were observed in the absolute lymphocyte count, troponin, and ferritin between patients with persistently abnormal ECG findings and those whose ECG findings were normal or had returned to normal. Additionally, significant differences in the absolute lymphocyte count, ferritin, and fibrinogen were observed among the other four groups (P < 0.05).
5. Discussion
In this study, we investigated changes in electrocardiographic findings during the course of the disease and the recovery period in MIS-C patients. We also examined whether these changes were determinants of prognostic factors affecting the course of the disease. The most noteworthy results include significant differences observed in serial measurements of heart rate, PR interval, QRS duration, QT duration, Fredericia QTc, JT interval, ST-T changes, presence of sinus tachycardia, first-degree AV block, presence of wide QRS, abnormal QRS axis, abnormal T axis, and long QTc values in the standard ECGs of MIS-C patients, alongside improvements noted in the latest measurements. Another important finding is that QRS and QTc prolongation, abnormal T axis, ST-T changes, and presence of LVH persisted into the third month, albeit to a lesser degree. The final significant result is that long-term ECG abnormalities were associated with decreases in absolute lymphocyte count and increases in troponin, ferritin, and fibrinogen levels.
In MIS-C patients, typical complications include fever, hypotension, multiorgan involvement, and significantly elevated inflammatory findings (17-19). Many affected individuals experience cardiovascular complications such as shock, ventricular dysfunction, coronary artery ectasia, aneurysms, or arrhythmias (17-19). Coronavirus disease-2019 may cause cardiomyocyte damage due to an acute and dysregulated inflammatory response associated with cytokine storm, microvascular dysfunction, and viral invasion of cardiomyocytes, resulting in cellular damage and ischemic injury. In MIS-C patients, cardiac involvement leads to enlargement of the coronary arteries, early inflammation and edema in the myocardium and conduction system, and diffuse fibrosis and scarring in the late phase. Elevated inflammatory markers, troponin, and BNP levels can lead to various ECG changes such as ventricular dysfunction, QRS prolongation, ST changes, and prolongation of AV conduction time, manifesting as clinical symptoms (19-21). Bradyarrhythmias, tachyarrhythmias, and other ECG findings can occur in MIS-C patients due to ventricular dysfunction, myocardial edema, irregular inflammation, direct viral toxicity, microvascular dysfunction, and shock (11, 12, 17-21). Studies on MIS-C patients have reported arrhythmia and conduction system abnormalities in 7 - 60% of cases (14, 19, 20). The most frequently reported ECG abnormalities are low QRS width, ST-segment changes, QTc prolongation, and premature atrial or ventricular beats (14, 22, 23). First-degree heart block was observed in 6.3 - 25% of MIS-C patients (11, 12, 14, 24), but it was not associated with inflammation markers and elevated cardiac enzymes (11, 12). Similarly, no relationship was detected in this study either. Second- or third-degree heart block occurred in 7% of MIS-C patients (11), though no cases of second- or third-degree AV blocks were observed in this study. QT and QRS prolongations were reported with frequencies of 28% and 4%, respectively (21, 24); the prevalence in our study was 18% and 51%, respectively.
Regan et al. observed ECG abnormalities in 67% of patients during the disease course, including PR, QRS, and QTc interval prolongation, decreased amplitude, and T wave inversion observed during hospitalization; these abnormalities improved before discharge and returned to normal during outpatient follow-up (14). The frequencies of first-degree AV block, RBBB, LBBB, temporary QRS prolongation, temporary QTc prolongation, and T wave change were determined to be 8%, 4.8%, 1.6%, 6%, 11%, and 11%, respectively (14). Valverde et al. reported prolonged PR interval, bundle branch block, and ST-T changes at rates of 6.3%, 3.8%, and 22%, respectively; and Choi et al. reported a first-degree AV block frequency of 19% (12, 24).
In our study, the frequencies of first-degree AV block, RBBB, LBBB, temporary QRS prolongation, temporary QTc prolongation, and ST-T change were determined to be 7%, 5.5%, 1.4%, 51%, 18%, and 18%, respectively. In contrast, Regan et al. reported continued frequencies of prolonged PR, QRS, QTc, and T wave changes in 3%, 0%, 2%, and 2% of patients, respectively; in our study, these persisted in 1.4%, 16.6%, 3%, and 12.5% of patients, respectively (14). Furthermore, in our study, the frequency of wide QRS and ST-T changes continued to diminish, being 11% and 8% in the first month, and 8% and 7% in the third month, respectively. Regan et al. stated that QT and QRS prolongations resolved faster than PR prolongation (14). In our study, PR and QT prolongations returned to normal by the first month, but QRS enlargement continued into the third month in 8% of patients, unlike in Regan et al. (14) who reported that PR, QRS, and QTc prolongations were longest not upon first admission but at the midpoint (day 8). In our study, the PR interval peaked at a mean of 127 ms on the 15th day. Conversely, the longest durations for QRS and QTc prolongation were observed in the third month. The consistent use of PR distance upon first admission in both our study and in Choi et al. may explain the lack of significant differences related to this (12).
In our study, the frequencies of sinus tachycardia, abnormal P axis, abnormal QRS axis, abnormal T axis, RAD, and LVH upon first admission were 15%, 5%, 7%, 8%, 3%, and 1.4%, respectively. The results upon first admission in both our study and that of Regan et al. were similar, and both studies noted that most pathological values returned to normal after discharge and later (14). In the study by Valverde et al., the frequency of tachyarrhythmia was 1.7 - 3.2% (24). Interestingly, tachyarrhythmia was not observed in any patients included in our study. Previous reports have indicated the presence of sinus bradycardia in MIS-C patients, although its prevalence has not been widely reported (14, 23, 25). In this study, age-related sinus bradycardia was observed in only one case, which improved later. Additionally, another distinction between this study and others is that QRS and QTc prolongation, abnormal T axis, ST-T changes, and LVH presence continued into the third month, albeit at a decreasing rate. Therefore, patients with ECG findings that could potentially cause arrhythmias should be monitored until the findings improve.
Both ferritin and fibrinogen are considered elevated markers in chronic inflammation, as well as acute phase reactants. Aydın et al. reported that patients with MIS-C had lower absolute lymphocyte counts at the time of diagnosis, and Fernandes et al. reported that a lower absolute lymphocyte count predicted severe MIS-C (26, 27). Roberts et al. found lymphopenia and higher ferritin and troponin levels in MIS-C+ patients compared to MIS-C- patients, while Atasayan et al. found significantly higher ferritin and troponin levels in MIS-C patients with ventricular dysfunction (28, 29). Cantarutti et al. reported ECG abnormalities in the group with elevated cardiac biomarkers in MIS-C patients (30). In the meta-analysis by Haghighi Aski et al., many studies reported a relationship among LV dysfunction, abnormal ECG findings, and high troponin levels (31), while Regan et al. identified T wave inversion as the most common ECG finding in MIS-C patients, followed up to a maximum of 67 days (14). T wave inversion was most frequently observed on the sixth day from the onset of symptoms and continued until the eleventh day. In the same study, peak ferritin and troponin levels were reported at 5 and 6 days from the onset of the symptoms, respectively. To our knowledge, no study in the literature has evaluated the relationship between long-term ECG abnormalities and laboratory findings. In our study, a significant relationship was found between chronic inflammation markers, such as ferritin and fibrinogen, and absolute lymphocyte count, troponin levels, and long-term ECG abnormalities in MIS-C patients.
Chakraborty and Anagnostopoulou et al. investigated the long-term cardiovascular manifestations of MIS-C and reported that subclinical myocardial injury, diastolic dysfunction, coronary artery aneurysm, and myocardial scarring may persist in a small group of patients, necessitating a long-term follow-up strategy (32, 33). These pathologies, due to cardiac involvement, may present as persistent ECG abnormalities. In the study by Roge et al., only 1 patient (8.3% ) had a persistent long QTc interval (34). In the study by Kaltman et al., abnormal electrocardiograms were found in 57.2% of hospital admissions, which decreased to 19.6% in hospital follow-up, and stabilized at 6.4% in the second week (35). In our study, the rate of ECG abnormalities was very high at the first hospitalization but decreased to 25% after 3 months.
5.1. Study Limitations
The study's single-center design may limit the generalizability of the findings, and the relatively modest sample size necessitates cautious interpretation of the results. Additionally, the absence of a control group limits the ability to establish causal relationships between the observed abnormalities and MIS-C. The small sample size in some subgroup analyses is a limitation that warrants more explicit discussion, as it significantly restricts the conclusions that can be drawn. Another limitation is the small sample size for some subgroup analyses, particularly when patients are divided into the four ECG evolution groups shown in Table 1. Furthermore, the inclusion of children who could not fully comply during the ECG or who were crying, thus unable to produce a 12-channel ECG, presents another limitation.
5.2. Conclusions
Multisystem inflammatory syndrome in children patients require ongoing monitoring and comprehensive assessment. Serially measured ECG findings in these patients seem to improve over time. Since MIS-C patients may have ECG abnormalities that can lead to arrhythmias, close monitoring and the establishment of standardized approaches are essential. Long-term ECG abnormalities are associated with a decrease in absolute lymphocyte count and elevated levels of troponin, ferritin, and fibrinogen. Further research incorporating larger, multi-center cohorts and longitudinal follow-up may enhance our understanding of MIS-C and inform more effective therapeutic strategies.