1. Background
Vitamin D deficiency or insufficiency is a global public health concern affecting approximately one billion people, with pregnant women and children being high-risk groups (1-3). Pregnant women and children are recognized as high-risk groups for low 25-hydroxyvitamin D [25(OH)D] levels, and this issue is prevalent in China. In Guizhou, previous studies involving 220 perinatal women showed that ~90% had insufficient 25(OH)D levels, indicating severe local deficiency (4, 5). Vitamin D affects not only maternal health and pregnancy outcomes but also fetal and neonatal health (6-8).
Beyond bone metabolism, vitamin D is involved in insulin secretion, immune regulation, lung maturation, and central nervous system (CNS) protection (9-11). Mounting evidence links vitamin D to neuronal function and cognitive development; however, findings remain inconsistent: some studies support a positive association between prenatal vitamin D status and infant neurodevelopment, whereas others do not (12-14). Key gaps include a lack of long-term observational data from low-sunlight regions such as Guizhou, a limited number of studies simultaneously evaluating maternal-neonatal vitamin D correlations and their impact on early neurobehavior within the same cohort, and unclear direct relationships between neonatal 25(OH)D levels and early neurodevelopment in high-deficiency areas.
2. Objectives
Maternal late-pregnancy 25(OH)D levels are strongly correlated with neonatal cord blood 25(OH)D levels, and sufficient maternal and neonatal 25(OH)D levels are associated with higher NBNA scores at 1 month and higher DQ at 6 months. The primary aim of this study was to investigate the independent association between neonatal cord blood 25(OH)D (primary exposure) and early infant neurobehavioral development in Guiyang, Guizhou, and to explore the association between maternal late-pregnancy 25(OH)D (secondary exposure) and early infant neurobehavioral development.
Primary outcome: Early infant neurobehavioral development (NBNA at 1 month, DQ at 6 months). Secondary outcomes: Correlation between maternal and neonatal 25(OH)D levels; the predictive performance of maternal 25(OH)D for neonatal vitamin D deficiency. This was a hypothesis-driven study with a prespecified hierarchical analytic plan. Therefore, we hypothesized that sufficient maternal late-pregnancy and neonatal vitamin D levels would be positively associated with better early neurobehavioral development scores. This study aimed to test this hypothesis in a high-risk population in a low-sunlight region.
3. Methods
3.1. Study Objectives
Primary objective: To examine the independent association between neonatal cord blood 25(OH)D levels (primary exposure) and early neurobehavioral development (NBNA at 1 month, DQ at 6 months).
Secondary objectives: 1) To evaluate the correlation between maternal late-pregnancy and neonatal 25(OH)D levels. 2) To explore the association between maternal late-pregnancy 25(OH)D levels (secondary exposure) and infant neurodevelopment. 3) To describe changes in vitamin D status from birth to 6 months under routine supplementation (infant 25(OH)D at 6 months was used only for descriptive analysis, not as an exposure factor for neurodevelopmental outcomes).
This was an observational study. Vitamin D supplementation was not a controlled intervention, and no causal inference regarding supplementation effects was made.
3.2. Study Design and Participants
This single-center, prospective observational cohort study enrolled pregnant women who received prenatal care at the Obstetrics Clinic of the First Affiliated Hospital of Guizhou University of Traditional Chinese Medicine and their neonates born in the hospital between July 2024 and January 2025. The study was approved by the Ethics Committee of the First Affiliated Hospital of Guizhou University of Traditional Chinese Medicine (Approval No.: 2024001), and written informed consent was obtained from all participants.
Inclusion criteria: Maternal age ≥ 20 years; gestational age 28 - < 42 weeks; maternal long-term residency in Guiyang (≥ 1 year); no pre-pregnancy cardiovascular, endocrine, urinary, or metabolic diseases, autoimmune diseases, or neuromuscular disorders; complete clinical data; voluntary participation with signed informed consent.
Exclusion criteria: Neonates with congenital malformations, chromosomal abnormalities, genetic metabolic diseases, adrenal diseases, or conditions affecting liver/kidney function; neonates who died within 6 months; parents refusing participation.
A total of 320 mother-infant pairs were initially enrolled. The study flow is shown in Figure 1. During follow-up, 15 pairs were excluded for the following reasons: loss to follow-up before the 1-month assessment (n = 1), infant illness (n = 5), guardian refusal (n = 5), and loss to follow-up between 1 and 6 months (n = 4). Thus, 305 pairs completed all assessments and constituted the final analysis cohort.
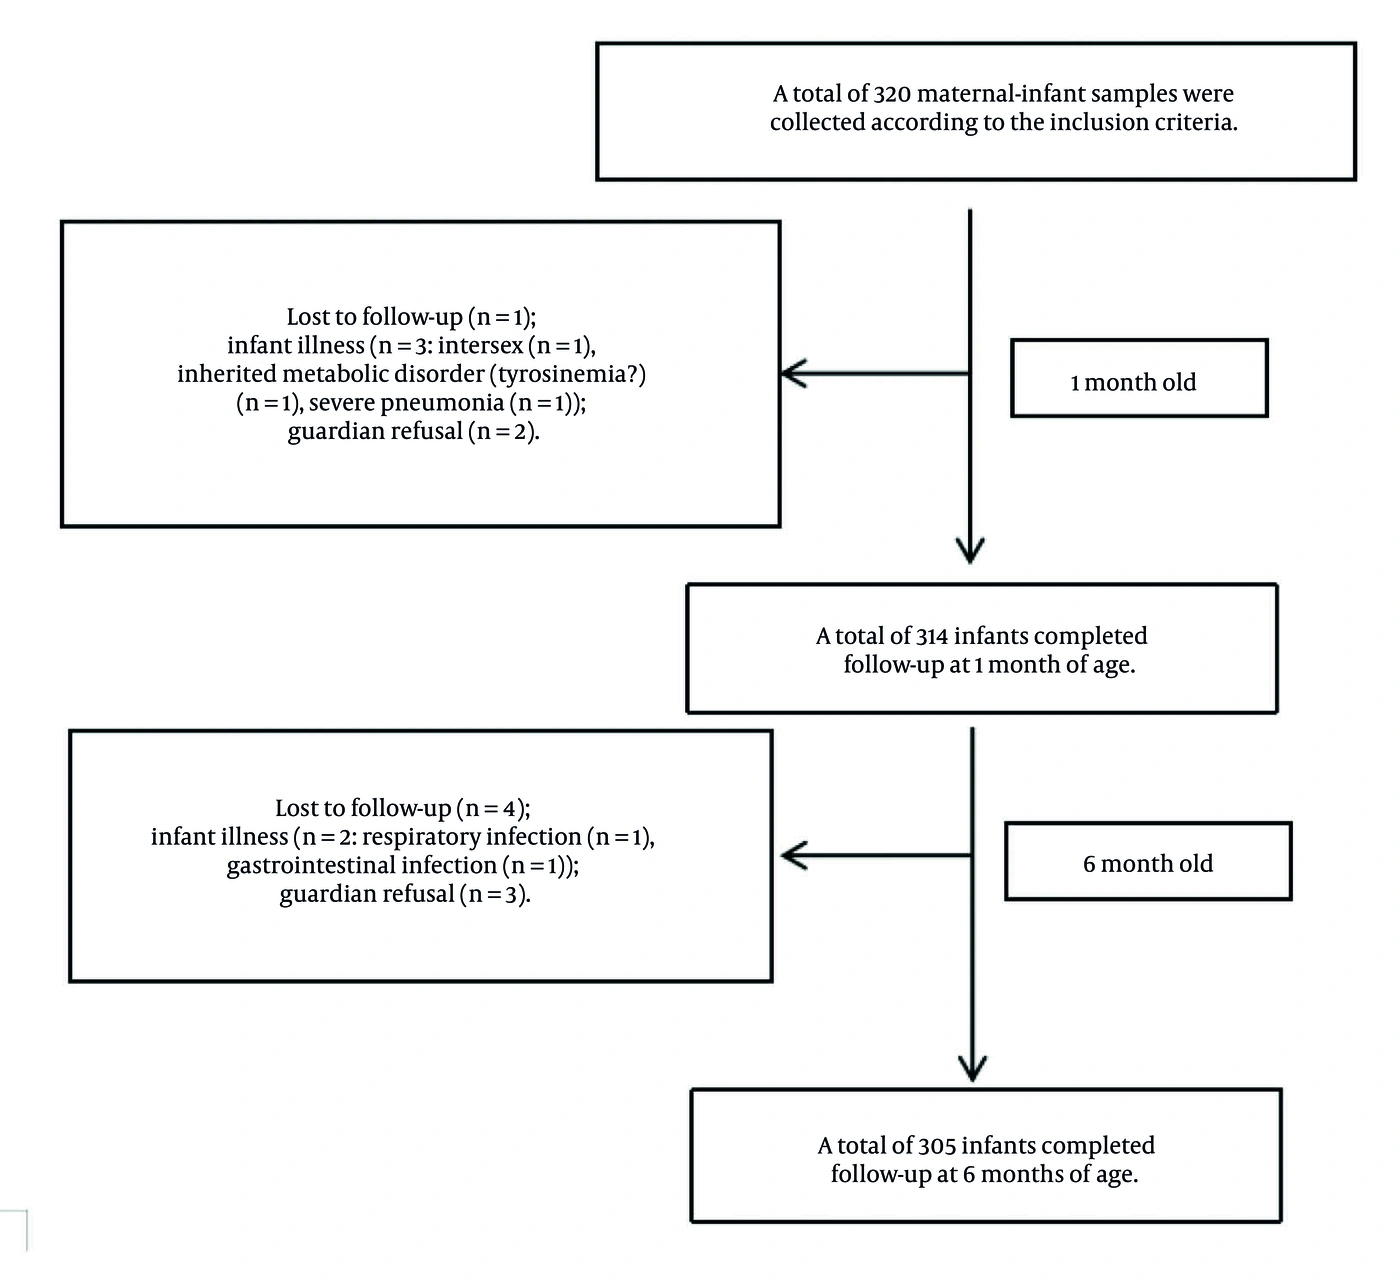
Figure 1.
Participant flow and follow-up completeness.
A formal a priori sample size calculation was not performed during study design. Post hoc power analysis confirmed that 305 mother-infant pairs provided more than 99% statistical power (α = 0.05, two-tailed; Cohen’s f2 = 0.10) to detect a moderate association in the primary multivariable regression model (neonatal cord blood 25(OH)D with 6-month DQ score). This sample size was therefore sufficient to address the study’s primary objective.
3.3. Diagnostic Criteria
Vitamin D status was defined based on serum 25-hydroxyvitamin D [25(OH)D] levels according to the 2016 Global Consensus Recommendations on Prevention and Management of Nutritional Rickets (18): Deficiency: < 12 ng/mL; Insufficiency: 12 - 20 ng/mL; Sufficiency: ≥ 20 ng/mL.
3.4. Data Collection
Maternal information was collected from obstetric medical records and questionnaires, including demographic characteristics (age, education level, parity), prenatal lifestyle factors (outdoor activity, sun protection use, smoking status), and vitamin D supplementation. Prenatal vitamin D supplementation was defined as daily oral vitamin D intake for ≥ 1 consecutive month during pregnancy. Supplementation was administered in accordance with the routine clinical protocol for pregnant women at our institution; initiation occurred mainly during the second trimester (14 - 27 weeks) and continued until delivery. Preparations included vitamin D3 drops or vitamin D-containing multivitamins, administered orally. The cumulative dose was calculated based on the daily dosage and duration of supplementation, and adherence was confirmed by maternal self-report at the late-pregnancy visit. The daily dosage was categorized as ≤ 300 IU, ≥ 400 IU, or no supplementation. These data were treated as an observational exposure rather than as part of a controlled intervention.
Neonatal information, including sex, gestational age, birth weight, head circumference, and birth length, was recorded within 1 hour of delivery using calibrated instruments (precision: 5 g for weight, 0.1 cm for length and head circumference).
3.5. Neurobehavioral Development Assessment
Neonatal Behavioral Neurological Assessment (NBNA): The assessment was conducted by a trained neonatal nurse at 1 month (corrected gestational age for preterm infants). The NBNA used in this study is a scale developed by Dr. Bao Xiulan and is a modified version of the American Brazelton Neonatal Behavioral Assessment Scale and the French Amiel-Tison Neurological Assessment, designed for early assessment and screening of neurological impairments (19-21). It comprehensively reflects the functional state of the brain, particularly the extent of cerebral cortex impairment, and demonstrates good validity and reliability (22). The NBNA consists of 20 items across 5 domains: Behavior (6 items), Passive Muscle Tone (4 items), Active Muscle Tone (4 items), Primary Reflexes (3 items), and General Condition (3 items). Each item is scored from 0 to 2 points, where 2 points indicate normal behavior and 0 points indicate significant deviation from the norm. The total score is the sum of all items, with a score below 35 indicating abnormal neurobehavior (21).
Infant Development Assessment at 6 Months: The assessment at 6 months (corrected gestational age for preterm infants) was conducted using the China Developmental Scale for Infants and Toddlers (CNBS-R 2016, also known as the Erxin Scale-II/2016 Edition). This is a nationally certified, locally validated diagnostic assessment tool in China, and its scoring system and clinical cutoffs are recognized internationally (23). It evaluates five domains: Gross Motor, Fine Motor, Adaptive Ability, Language, and Social Behavior. The Developmental Quotient (DQ) is the core output, calculated as [(measured developmental age / actual age) × 100]. The grading standard is: DQ ≥ 130 (Excellent), 115 - 129 (Good), 85 - 114 (Average), 70 - 84 (Borderline), and < 70 (Developmental Delay).
Blinding: All assessments for both scales were performed by the same assessor, who had professional certification and extensive experience in child healthcare. The assessor was blinded to the infants' medical histories, maternal 25(OH)D levels, infant 25(OH)D levels, and vitamin D supplementation status during the evaluation period to minimize bias.
3.6. Sample Collection and Laboratory Detection
Blood sampling: Maternal peripheral venous blood (3 mL, late pregnancy: 29 - 34 weeks), neonatal umbilical venous blood (3 mL, post-clamping), and infant peripheral venous blood (3 mL, 6 months) were collected in anticoagulant-free tubes.
25(OH)D detection: Samples were analyzed within 24 hours using a fully automated chemiluminescent immunoassay analyzer (MAGLUMIX8) with a 25(OH)D detection kit (Shenzhen New Industries Biomedical Engineering Co., Ltd.).
3.7. Postnatal Vitamin D Supplementation
All infants received individualized vitamin D supplementation (prescribed by neonatologists based on birth 25(OH)D levels). Adherence was monitored via parent self-report, telephone reminders, and verification at 6-month blood sampling. Caregivers received standardized education on administration and dosage. Supplementation was part of the clinical background and was not an intervention evaluated for efficacy.
3.8. Statistical Analysis
Data were entered into Excel and analyzed using SPSS 27.0. Normally distributed quantitative data are presented as mean ± SD. Qualitative data are presented as counts and percentages (n, %). Normality of quantitative data was assessed using the Kolmogorov-Smirnov test, and homogeneity of variances was assessed using Levene's test. For comparisons among multiple groups, one-way ANOVA was applied to data meeting the assumptions of normality and homogeneity of variance, followed by Tukey's post hoc test for pairwise comparisons. Comparisons of categorical data between groups were performed using the chi-square test. A two-tailed P value < 0.05 was considered statistically significant. Given the observational nature of this study, the identified associations do not imply causation, and residual confounding cannot be excluded.
Correlation between maternal and neonatal 25(OH)D: Pearson correlation (both variables normally distributed). Predictive value of maternal 25(OH)D for neonatal deficiency: receiver operating characteristic (ROC) curve.
To examine the independent association between vitamin D status and neurodevelopmental outcomes, we constructed two sets of multivariable linear regression models following the prespecified hierarchical analytic plan. The Primary Model used neonatal cord blood 25(OH)D level as the primary exposure and aimed to assess the independent association between neonatal vitamin D status at birth and early neurodevelopment, with outcomes including the Neonatal Behavioral Neurological Assessment total score at 1 month corrected age and the Developmental Quotient total score at 6 months corrected age, while adjusting for covariates including the season of blood sampling, maternal age, maternal education, prenatal vitamin D supplementation dose, gestational age, infant sex, birth weight, and delivery mode. The exposure was analyzed as both a continuous variable (per 1 ng/mL increase) and a categorical variable (sufficient vs. insufficient vs. deficient, with deficient as the reference category). The Secondary Model used maternal late-pregnancy 25(OH)D level as the secondary exposure and sought to explore the association between maternal vitamin D status during late pregnancy and infant neurodevelopment, with outcomes identical to those of the Primary Model and the same set of covariates as the Primary Model; the exposure was also analyzed as both a continuous variable (per 1 ng/mL increase) and a categorical variable (sufficient vs. insufficient vs. deficient, with deficient as the reference).
Rationale for each covariate: Season influences sunlight exposure and 25(OH)D levels; maternal age is associated with both pregnancy nutrition and infant neurodevelopment; maternal education reflects socioeconomic status, which affects both vitamin D intake and the caregiving environment; prenatal vitamin D dose is a direct determinant of maternal 25(OH)D level; gestational age, infant sex, birth weight, and delivery mode are well-established confounders for neonatal neurodevelopment.
Rationale for covariate selection: The covariates included in the regression models (season, maternal age, education, prenatal vitamin D supplementation dose, gestational age, infant sex, birth weight, delivery mode) were selected a priori based on known or potential associations with both vitamin D status and neurodevelopmental outcomes, with the aim of reducing confounding while avoiding overadjustment.
Despite adjustment for the aforementioned covariates, several potential residual confounders were not quantitatively measured or included in the models due to data unavailability. These include quantitative sunlight exposure, detailed outdoor activity time, dietary vitamin D intake beyond supplementation, broader maternal nutritional status, maternal psychological status (e.g., depression/anxiety), infant feeding patterns (e.g., exclusive breastfeeding duration), and infant illness history. The absence of these adjustments is a limitation of the study, as these factors may influence both vitamin D status and neurodevelopmental outcomes.
Analyses were performed in accordance with a prespecified hierarchical framework designed to mitigate the risk of false-positive results arising from multiple statistical tests, with the level of evidence for each analysis defined in advance. No formal multiplicity adjustment was applied to primary and secondary confirmatory analyses to preserve statistical power for the a priori hypotheses. All domain-specific and subgroup analyses were exploratory, with unadjusted P values and a high risk of Type I error. The primary confirmatory objective was prespecified as examining the independent relationship between neonatal cord blood 25-hydroxyvitamin D, the primary exposure variable, and the primary neurodevelopmental outcomes, namely the total NBNA score at 1 month and the total DQ score at 6 months. A two-tailed P value of less than 0.05 was regarded as statistically significant for these associations, and no adjustment for multiple testing was performed for these primary analyses to maintain adequate statistical power for addressing the core research questions.
Investigation of the association between maternal 25-hydroxyvitamin D levels in late pregnancy, the secondary exposure, and the same primary neurodevelopmental outcomes, including the 1-month NBNA total score and 6-month DQ total score, was defined as a secondary confirmatory analysis. As this represented a prespecified secondary objective, a two-tailed P value of less than 0.05 was also adopted as the significance threshold without additional adjustment.
All other analyses beyond those described above were classified as exploratory and hypothesis-generating. These included comparisons of scores across individual developmental domains at 6 months, including gross motor, fine motor, adaptive, language, and social functioning; subgroup analyses stratified by gestational age; and all pairwise post hoc comparisons between different vitamin D status groups, such as sufficient, insufficient, and deficient categories. No formal statistical adjustment for multiple comparisons, such as Bonferroni correction, was implemented in these exploratory assessments. Consequently, the P values reported for these analyses are unadjusted and are treated as descriptive statistics, and their interpretation requires caution given the elevated likelihood of Type I error. Any conclusions derived from these exploratory analyses are clearly identified accordingly and should be viewed as preliminary findings requiring independent validation through further replication studies.
4. Results
4.1. Participant Flow and Follow-Up Completeness
Participant flow is summarized in Figure 1. Of the 320 enrolled mother-infant pairs, 305 (95.3%) completed the study and were included in the final analysis. All subsequent analyses, including baseline characteristics, correlation analyses, and multivariable regression models, were based on these 305 pairs with complete data at all time points (late pregnancy, birth/1 month, and 6 months).
Analyses followed a prespecified hierarchy, first presenting results addressing the secondary objectives, then focusing on the primary objective (association between the primary exposure [neonatal cord blood 25(OH)D] and neurodevelopmental outcomes), and finally presenting supplementary analyses.
4.2. Maternal-Neonatal 25(OH)D Status and Associated Factors
Mother-infant pairs were categorized into three groups based on neonatal cord blood 25(OH)D levels at birth, according to the diagnostic criteria.
4.2.1. Baseline Characteristics
The mean maternal late-pregnancy 25(OH)D level was 15.07 ± 6.71 ng/mL (18.4% sufficient). The mean neonatal cord blood 25(OH)D level was 17.52 ± 8.41 ng/mL (36.7% sufficient). Detailed baseline characteristics are presented in Table 1.
Table 1.
Distribution and Correlation of Maternal and Neonatal 25(OH)D Levels a
| Variables | Sufficient Cases (%) | Insufficient Cases (%) | Deficient Cases (%) | r | P Value |
|---|---|---|---|---|---|
| Maternal third-trimester 25(OH)D level | 56 (18.4) | 154 (50.5) | 95 (31.1) | 0.83 | < 0.001 |
| Neonatal umbilical cord blood 25(OH)D level | 112 (36.7) | 109 (35.7) | 84 (27.5) | 0.83 | < 0.001 |
a Classification based on the 2016 Global Consensus: Deficiency < 12 ng/mL, Insufficiency 12 - 20 ng/mL, Sufficiency ≥ 20 ng/mL. Correlation between maternal late-pregnancy and neonatal cord blood 25(OH)D was analyzed by Pearson correlation. Neonatal cord blood 25(OH)D is the primary exposure, and maternal late-pregnancy 25(OH)D is the secondary exposure in this study.
4.2.2. Maternal-Neonatal 25(OH)D Correlation
Pearson correlation analysis revealed a strong positive correlation between maternal late-pregnancy 25(OH)D and neonatal cord blood 25(OH)D levels (r = 0.83, P < 0.001; Table 1). Linear curve fitting confirmed a robust linear association (R2 = 0.693, P < 0.001; Figure 2).
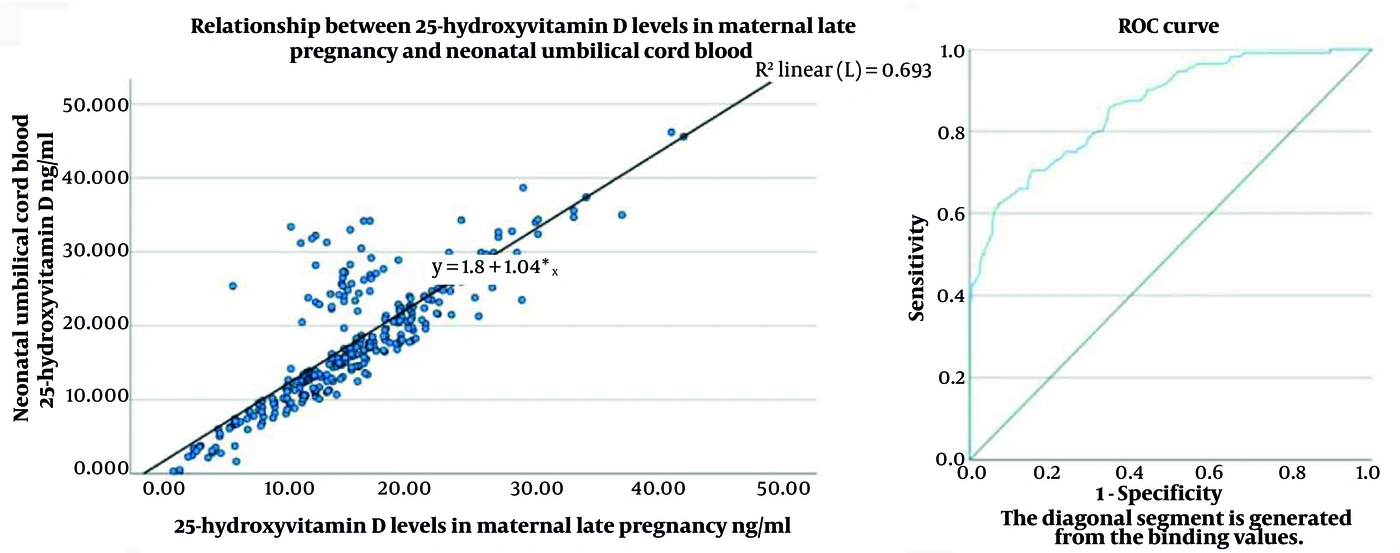
Figure 2.
Linear correlation and fitting between maternal late-pregnancy and neonatal cord blood 25(OH)D levels.
4.2.3. Predictive Value of Maternal 25(OH)D
ROC curve analysis was performed to evaluate the predictive performance of maternal 25(OH)D for neonatal vitamin D deficiency. The area under the curve (AUC) was 0.862 (95% CI: 0.820 - 0.904, P < 0.001). Using a cutoff value of 18.35 ng/mL for maternal 25(OH)D, sensitivity was 62.5% and specificity was 92.7%.
4.2.4. Factors Associated with Neonatal 25(OH)D Levels
Based on serum 25(OH)D levels defined by the 2016 Global Consensus (Deficiency: < 12 ng/mL; Insufficiency: 12 - 20 ng/mL; Sufficiency: ≥ 20 ng/mL), infants were divided into sufficient, insufficient, and deficient groups according to neonatal cord blood 25(OH)D levels at birth. Univariable analyses showed that maternal age, educational level (high school or below vs. college or above), and daily prenatal vitamin D supplementation dose were significantly associated with neonatal cord blood 25(OH)D levels (all P < 0.05). Pairwise comparisons showed that neonatal 25(OH)D levels were significantly higher in the ≥ 400 IU/day group than in the ≤ 300 IU/day group and the no-supplementation group, and were higher in the ≤ 300 IU/day group than in the no-supplementation group (all P < 0.001), as shown in Table 2. Gestational age, delivery mode, parity, birth weight, sex, and birth season had no significant effects (all P > 0.05). Therefore, season was included as a covariate in the adjusted analyses.
Table 2.
Univariable Analysis of Factors Associated with Neonatal Cord Blood 25(OH)D Levels a
| Influencing Factor | Cases | Neonatal Umbilical Cord Blood 25(OH)D Level (ng/mL) | t/F Value | P Value |
|---|---|---|---|---|
| Gestational age (wk) | 1.516 | 0.493 | ||
| ≥ 37 | 269 (88.20) | 17.62 ± 8.54 | ||
| < 37 | 36 (11.80) | 18.68 ± 10.03 | ||
| Delivery method | 0.735 | 0.638 | ||
| Cesarean section | 193 (63.30) | 17.69 ± 8.87 | ||
| Vaginal delivery | 112 (36.70) | 17.84 ± 8.50 | ||
| Parity | 2.385 | 0.124 | ||
| 1st parity | 195 (63.90) | 17.70 ± 9.25 | ||
| ≥ 2nd parity | 110 (36.10) | 17.84 ± 7.74 | ||
| Weight (g) | 1.690 | 0.195 | ||
| ≥ 2500 | 273 (89.50) | 17.53 ± 8.27 | ||
| < 2500 | 32 (10.50) | 17.50 ± 9.67 | ||
| Sex | 0.150 | 0.698 | ||
| Male | 168 (55.10) | 17.64 ± 8.59 | ||
| Female | 137 (44.90) | 17.38 ± 8.21 | ||
| Age (y) | 2.084 | 0.038 | ||
| ≥ 35 | 36 (11.80) | 20.58 ± 10.20 | ||
| < 35 | 269 (88.30) | 17.37 ± 8.46 | ||
| Educational level | -3.062 | 0.002 | ||
| High school or below | 50 (16.40) | 14.34 ± 9.17 | ||
| College or above | 255 (83.6) | 18.41 ± 8.49 | ||
| Season | 1.54 | 0.216 | ||
| Autumn | 145 (47.54) | 17.12 ± 7.81 | ||
| Winter | 156 (51.15) | 18.30 ± 8.66 | ||
| Daily vitamin D supplementation dose during pregnancy b | 271.56 | < 0.001 | ||
| ≤ 300 IU (A) | 46 (15.10) | 22.08 ± 3.49 | ||
| ≥ 400 IU (B) | 67 (22.00) | 28.64 ± 5.27 | ||
| No supplementation (C) | 192 (63.00) | 12.55 ± 5.19 |
a Values are expressed as No. (%) or mean ± SD.
b Pairwise comparisons: (A) vs. (C), P < 0.001; (A) vs. (B), P < 0.001; (B) vs. (C), P < 0.001. For categorical factors, group means were compared using t test/ANOVA for descriptive purposes.
4.2.5. Vitamin D Status at 6 Months
This section presents a descriptive analysis of infant 25(OH)D levels at 6 months (not used as an exposure factor for neurodevelopmental outcomes). Despite individualized postnatal vitamin D supplementation, the hierarchy of vitamin D status observed at birth persisted at 6 months, suggesting a sustained influence of prenatal vitamin D stores. Groups were defined by neonatal cord blood 25(OH)D levels at birth. Infant 25(OH)D levels increased significantly from birth to 6 months in all groups (all P < 0.001). Despite these postnatal increases, intergroup differences persisted: sufficient group > insufficient group > deficient group (all P < 0.05) (Table 3).
Table 3.
Changes in Infant Serum 25(OH)D Levels from Birth to 6 Months, Stratified by Neonatal Vitamin D Status at Birth a
| Group | Cases | Umbilical Cord Blood (ng/mL) | 6 Months of Age (ng/mL) | P Value |
|---|---|---|---|---|
| Sufficient group | 112 (36.7) | 26.50 ± 5.15 | 37.22 ± 5.70 | < 0.001 |
| Insufficient group | 109 (35.7) | 15.74 ± 2.16 | 32.01 ± 3.83 | < 0.001 |
| Deficient group | 84 (27.5) | 7.86 ± 3.23 | 27.16 ± 4.29 | < 0.001 |
a Values are expressed as No. (%) or mean ± SD. P values indicate the comparison between umbilical cord blood 25(OH)D (primary exposure) and 6-month levels (descriptive outcome) within the same group, using a paired-sample t test.
4.2.6. Subgroup Analysis by Gestational Age
To examine the influence of gestational age, we performed subgroup analyses comparing preterm (< 37 weeks) and term (≥ 37 weeks) infants within each vitamin D status group at birth and at 6 months after birth. No statistically significant differences in 25(OH)D levels were observed between preterm and term infants at birth within the sufficient, insufficient, or deficient vitamin D groups (all P > 0.05). At 6 months after birth, preterm infants exhibited significantly higher 25(OH)D levels than term infants within each vitamin D status group: the sufficient group (P < 0.001), the insufficient group (P < 0.001), and the deficient group (P = 0.024). Comparisons among the three vitamin D status groups (sufficient vs. insufficient vs. deficient) at 6 months showed that the hierarchical differences observed at birth persisted, with the sufficient group maintaining the highest levels, followed by the insufficient and then the deficient groups (all between-group P < 0.05) (Table 4).
Table 4.
Exploratory Subgroup Analysis of 25(OH)D Levels by Gestational Age a
| Groups | No. (%) | Cord Blood b | 6-Month c | ||||||
|---|---|---|---|---|---|---|---|---|---|
| Mean (ng/mL) | t/F Value | P Value | 95% CI | Mean (ng/mL) | t/F Value | P Value | 95% CI | ||
| Sufficient group (A) | 6.286 | 0.124 | -1.10, 8.18 | 4.932 | < 0.001 | 4.51 - 10.56 | |||
| Preterm infants | 13 (4.3) | 29.62 ± 7.57 | 43.88 ± 6.60 | ||||||
| Term infants | 99 (36.8) | 26.08 ± 4.65 | 36.34 ± 4.98 | ||||||
| Insufficient group (B) | -0.729 | 0.467 | -1.73, 0.80 | 6.489 | < 0.001 | 4.35 - 8.17 | |||
| Preterm infants | 13 (4.3) | 15.34 ± 2.32 | 37.52 ± 4.29 | ||||||
| Term infants | 96 (35.7) | 15.80 ± 2.14 | 31.27 ± 3.11 | ||||||
| Deficient group (C) | 0.944 | 0.334 | -1.09, 3.24 | 3.968 | 0.024 | 2.63 - 7.94 | |||
| Preterm infants | 10 (3.3) | 8.81 ± 3.29 | 31.81 ± 6.10 | ||||||
| Term infants | 74 (27.5) | 7.74 ± 3.22 | 26.53 ± 3.61 | ||||||
a This is an exploratory subgroup analysis. Comparisons between preterm and term infants within each neonatal vitamin D status group were not part of the primary or secondary confirmatory analysis plan. The P values reported are unadjusted for multiple comparisons and should be interpreted with caution because they carry an increased risk of Type I error. These findings are hypothesis-generating.
b Between Group (A): P = 0.124; between Group (B): P = 0.467; between Group (C): P = 0.334.
c Between Group (A), Group (B), and Group (C): all P values < 0.05.
4.3. Neurodevelopmental Outcomes
The primary objective focused on the association between neonatal cord blood 25(OH)D (primary exposure) and infant early neurobehavioral development; the association between maternal late-pregnancy 25(OH)D (secondary exposure) and neurodevelopment is presented as a supplementary analysis.
4.3.1. Neurodevelopmental Outcomes by Maternal 25(OH)D
Mother-infant pairs were grouped by maternal late-pregnancy 25(OH)D status. Infants in the sufficient group had significantly higher cord blood 25(OH)D, 6-month 25(OH)D, and 6-month corrected-age DQ scores than those in the insufficient and deficient groups (all P < 0.001) (Table 5).
Table 5.
Maternal and Infant 25(OH)D Levels and Infant DQ by Maternal Vitamin D Status a
| Groups | Values | Maternal Late-Pregnancy 25(OH)D (ng/mL) b | Cord Blood (ng/mL) c | 6 Months After Birth (ng/mL) d | Developmental Quotient (DQ) e |
|---|---|---|---|---|---|
| Sufficient group (A) | 56 (18.36) | 25.25 ± 5.13 | 27.24 ± 6.34 | 37.11 ± 6.20 | 95.18 ± 6.06 |
| Insufficient group (B) | 154 (50.49) | 15.70 ± 2.24 | 18.74 ± 5.37 | 33.38 ± 5.06 | 91.72 ± 4.81 |
| Deficient group (C) | 95 (31.15) | 8.05 ± 3.16 | 9.82 ± 6.31 | 28.63 ± 5.52 | 87.68 ± 3.80 |
| F value | 503.88 | 162.45 | 46.24 | 45.71 | |
| P value | < 0.001 | < 0.001 | < 0.001 | < 0.001 |
a Values are expressed as No. (%) or mean ± SD. This table is grouped by maternal late-pregnancy 25(OH)D, which is the secondary exposure in this study. Post hoc pairwise comparisons: all P < 0.001 between any two groups.
b (A) vs. (C), P < 0.001; (A) vs. (B), P < 0.001; (B) vs. (C), P < 0.001.
c (A) vs. (C), P < 0.001; (A) vs. (B), P < 0.001; (B) vs. (C), P < 0.001.
d (A) vs. (C), P < 0.001; (A) vs. (B), P < 0.001; (B) vs. (C), P < 0.001.
e (A) vs. (C), P < 0.001; (A) vs. (B), P < 0.001; (B) vs. (C), P < 0.001.
4.3.2. Neurodevelopmental Outcomes by Neonatal 25(OH)D
Groups were defined based on neonatal cord blood 25(OH)D levels at birth. At 1 month corrected age, NBNA scores were significantly higher in the sufficient group than in both the insufficient and deficient groups and were also significantly higher in the insufficient group than in the deficient group (all P < 0.001; Table 6).
Table 6.
NBNA and DQ Scores by Neonatal Vitamin D Status a
| Groups | Values | NBNA b | Developmental Quotient (DQ) c |
|---|---|---|---|
| Sufficient group (A) | 112 (36.7) | 38.06 ± 0.43 | 96.12 ± 5.51 |
| Insufficient group (B) | 109 (35.7) | 37.30 ± 0.55 | 89.22 ± 4.40 |
| Deficient group (C) | 84 (27.5) | 36.33 ± 0.47 | 86.26 ± 2.51 |
| F value | 354.737 | 234.923 | |
| P value | < 0.001 | < 0.001 |
a Values are expressed as No. (%) or mean ± SD. This table is grouped by neonatal cord blood 25(OH)D, which is the primary exposure in this study. All 305 infants participated in the NBNA analysis at 1 month, and the same cohort of 305 infants was included in the DQ analysis at 6 months.
b (A) vs. (C), P < 0.001; (A) vs. (B), P < 0.001; (B) vs. (C), P < 0.001.
c (A) vs. (C), P < 0.001; (A) vs. (B), P < 0.001; (B) vs. (C), P < 0.001.
At 6 months corrected age, developmental quotient (DQ) and scores in all five domains differed significantly across the three vitamin D status groups (all P < 0.001; Table 7). Post hoc pairwise comparisons showed that scores in the sufficient group were consistently the highest, followed by the insufficient group and then the deficient group. This pattern was observed in the gross motor, fine motor, adaptive ability, and social behavior domains (all P < 0.001 for sufficient vs. insufficient and sufficient vs. deficient; P > 0.05 for insufficient vs. deficient). Notably, in the language domain, a clear gradient was observed: the sufficient group scored highest, followed by the insufficient group, and the deficient group scored lowest (all P < 0.05).
Table 7.
Exploratory Analysis of 6-Month Developmental Domain Scores a
| Group | Gross Motor b | Fine Motor c | Adaptive Ability d | Social Behavior e | Language f | Developmental Quotient (DQ) |
|---|---|---|---|---|---|---|
| Sufficient group (A) | 5.78 ± 0.42 | 5.74 ± 0.40 | 5.91 ± 0.37 | 5.68 ± 0.30 | 5.71 ± 0.44 | 96.12 ± 5.51 |
| Insufficient group (B) | 5.26 ± 0.32 | 5.34 ± 0.35 | 5.46 ± 0.35 | 5.18 ± 0.29 | 5.56 ± 0.42 | 89.22 ± 4.40 |
| Deficient group (C) | 5.21 ± 0.25 | 5.33 ± 0.25 | 5.46 ± 0.24 | 5.19 ± 0.28 | 4.72 ± 0.26 | 86.26 ± 2.51 |
| F value | 88.495 | 47.100 | 64.156 | 103.717 | 170.237 | 130.168 |
| P value | < 0.001 | < 0.001 | < 0.001 | < 0.001 | < 0.001 | < 0.001 |
a Analysis of the individual developmental domains (gross motor, fine motor, adaptive, language, social) is exploratory. These domain scores were not prespecified as primary or secondary outcomes. The pairwise P values are unadjusted for the multiple comparisons performed across the five domains and three vitamin D groups. Therefore, they are presented for descriptive purposes and should be interpreted with extreme caution because of the high risk of Type I error. The primary confirmatory inference for neurodevelopment at 6 months is the total Developmental Quotient (DQ) score.
b (A) vs. (B), P < 0.001; (A) vs. (C), P < 0.001; (B) vs. (C), P = 0.227
c (A) vs. (B), P < 0.001; (A) vs. (C), P < 0.001; (B) vs. (C), P = 0.866
d (A) vs. (B), P < 0.001; (A) vs. (C), P < 0.001; (B) vs. (C), P = 0.993
e (A) vs. (B), P < 0.001; (A) vs. (C), P < 0.001; (B) vs. (C), P = 0.780
f (A) vs. (B), P = 0.013; (A) vs. (C), P < 0.001; (B) vs. (C), P < 0.001
Exploratory analyses of the five individual developmental domains at 6 months revealed significant differences across the vitamin D status groups (Table 7). However, these domain-specific results should be interpreted with caution because they involve multiple comparisons and were not the primary focus of this study.
4.3.3. Multivariable Analysis of Neurodevelopment
We first present the Primary Model (primary exposure: neonatal cord blood 25(OH)D). We then report the Secondary Model (secondary exposure: maternal late-pregnancy 25(OH)D).
Multivariable linear regression analyses were performed to assess independent associations, following the two-model structure prespecified in the analytic plan. The Primary Model used neonatal cord blood 25(OH)D level as the primary exposure and aimed to assess the independent association between neonatal vitamin D status at birth and early neurodevelopment, with outcomes including the Neonatal Behavioral Neurological Assessment total score at 1 month corrected age and the Developmental Quotient total score at 6 months corrected age, while adjusting for covariates including the season of blood sampling, maternal age, maternal education, prenatal vitamin D supplementation dose, gestational age, infant sex, birth weight, and delivery mode. The exposure was analyzed as both a continuous variable (per 1 ng/mL increase) and a categorical variable (sufficient vs. insufficient vs. deficient, with deficient as the reference category). The Secondary Model used maternal late-pregnancy 25(OH)D level as the secondary exposure and sought to explore the association between maternal vitamin D status during late pregnancy and infant neurodevelopment, with outcomes identical to those of the Primary Model and the same set of covariates as in the Primary Model; the exposure was also analyzed as both a continuous variable (per 1 ng/mL increase) and a categorical variable (sufficient vs. insufficient vs. deficient, with deficient as the reference).
After full adjustment, the Primary Model showed that neonatal vitamin D sufficiency (vs. deficiency) was independently associated with higher NBNA scores (B = 1.75, P < 0.001) and higher DQ scores (B = 1.82, P < 0.001). In the Secondary Model, each 1 ng/mL increase in maternal late-pregnancy 25(OH)D was associated with a 0.03-point increase in NBNA score (B = 0.03, P < 0.001) and a 0.04-point increase in DQ score (B = 0.04, P < 0.001). Detailed results are shown in Table 8.
Table 8.
Multivariable Linear Regression Analysis of 25(OH)D Status and Neurodevelopmental Outcomes a
| Models and Outcomes | Variables | Unstandardized B (95% CI) | Standardized β (95% CI for β) | P Value |
|---|---|---|---|---|
| Primary model-neonatal cord blood 25(OH)D as exposure | ||||
| 1-month NBNA | Sufficient (Ref: Deficient) | 1.75 (1.38, 2.12) | 0.412 (0.324, 0.500) | < 0.001 |
| 1-month NBNA | Per 1 ng/mL increase | 0.03 (0.02, 0.04) | 0.150 (0.100, 0.201) | < 0.001 |
| 6-month DQ | Sufficient (Ref: Deficient) | 1.82 (1.45, 2.19) | 0.435 (0.341, 0.529) | < 0.001 |
| 6-month DQ | Per 1 ng/mL increase | 0.04 (0.03, 0.05) | 0.180 (0.135, 0.225) | < 0.001 |
| Secondary model-maternal late-pregnancy 25(OH)D as exposure | ||||
| 1-month NBNA | Sufficient (Ref: Deficient) | 1.60 (1.20, 2.00) | 0.340 (0.250, 0.430) | < 0.001 |
| 1-month NBNA | Per 1 ng/mL increase | 0.03 (0.02, 0.04) | 0.150 (0.100, 0.201) | < 0.001 |
| 6-month DQ | Sufficient (Ref: Deficient) | 1.65 (1.25, 2.05) | 0.360 (0.270, 0.450) | < 0.001 |
| 6-month DQ | Per 1 ng/mL increase | 0.04 (0.03, 0.05) | 0.180 (0.135, 0.225) | < 0.001 |
a Separate models were fitted for categorical and continuous exposure to avoid collinearity. All models were adjusted for season, maternal age, education, prenatal vitamin D dose, gestational age, infant sex, birth weight, and delivery mode. B represents the actual score change; β represents effect size. The 0.03 - 0.04-point increase per 1 ng/mL refers only to unstandardized B.
In addition, higher maternal educational level and adequate prenatal vitamin D supplementation were independently associated with better infant neurodevelopmental outcomes, whereas gestational age, birth weight, sex, and delivery mode showed no significant independent effects after full adjustment (all P > 0.05).
5. Discussion
In this single-center prospective observational cohort study of 305 mother–infant pairs in Guiyang, a low-sunlight region, we identified several key findings following our prespecified hierarchical analytic plan (focusing on the primary exposure first). First, maternal late-pregnancy 25-hydroxyvitamin D [25(OH)D] levels were strongly and positively correlated with neonatal cord blood 25(OH)D levels, underscoring the strong dependence of fetal vitamin D status on maternal reserves. Second, despite a high prevalence of maternal insufficiency (81.6%), sufficient neonatal cord blood 25(OH)D (primary exposure) and maternal late-pregnancy 25(OH)D (secondary exposure) levels were independently associated with more favorable early neurobehavioral development, as indicated by higher Neonatal Behavioral Neurological Assessment (NBNA) scores at 1 month corrected age and higher developmental quotient (DQ) at 6 months corrected age. Third, these associations persisted despite postnatal increases in 25(OH)D levels across all groups (infant 25(OH)D at 6 months was used only for descriptive analysis, not as an exposure factor), suggesting that prenatal vitamin D status may be linked to early developmental trajectories. Importantly, our multivariable linear regression models confirmed that sufficient neonatal cord blood 25(OH)D (primary exposure) and maternal late-pregnancy 25(OH)D (secondary exposure) levels were independently associated with better NBNA and DQ scores after adjustment for key confounders, including maternal age, education, prenatal vitamin D supplementation dose, gestational age, infant sex, birth weight, delivery mode, and season.
Our results are consistent with a growing body of literature linking prenatal vitamin D status to infant neurodevelopment. A meta-analysis by Garcia-Serna and Morales concluded that sufficient maternal vitamin D predicts better cognitive and language scores in early infancy, aligning with our observations of higher scores across all developmental domains, particularly language, among infants with sufficient status (22). The strong mother–neonate vitamin D correlation observed in our study (r = 0.83) is also consistent with reports from other regions, reinforcing the concept of maternal transfer as a primary determinant of fetal vitamin D stores (24, 25). However, we acknowledge that not all studies have reported significant associations, which may be attributable to differences in baseline vitamin D status, latitude, sunlight exposure, and the timing of developmental assessments. Our study, conducted in a region with a notably high prevalence of deficiency, provides robust associative data from a high-risk setting and further supports the association between maternal–neonatal vitamin D status and infant neurodevelopment.
The biological plausibility of our findings is supported by several mechanisms described in prior research. First, vitamin D receptors are widely expressed in key brain regions involved in cognition and behavior, such as the hippocampus, prefrontal cortex, and cerebellum (26, 27). Activation of these receptors is implicated in regulating processes critical for brain development, including neuronal proliferation, differentiation, and apoptosis (28-30). This regulatory role provides biological plausibility for the broad neurodevelopmental associations we observed. Second, vitamin D is implicated in the synthesis and release of neurotrophic factors, such as nerve growth factor (NGF) and brain-derived neurotrophic factor (BDNF), which are essential for neuronal survival, synaptic plasticity, and the formation of functional neural circuits (31, 32). Insufficient vitamin D has been hypothesized to limit this trophic support, potentially hindering the maturation of neural networks underlying motor, adaptive, and social behaviors, consistent with the lower domain scores observed in our insufficient and deficient groups. Third, vitamin D modulates key neurotransmitter systems, including glutamate and gamma-aminobutyric acid (GABA) (33). Deficiency-associated disruptions in these systems, as shown in experimental studies, could contribute to an altered excitatory–inhibitory balance, potentially affecting information processing and representing a pathway relevant to the observed neurobehavioral differences (26, 34-36). The particularly pronounced deficit in language scores among the deficient group in our study is consistent with the hypothesis that temporally sensitive language circuits are vulnerable to early nutritional insufficiencies (37).
A critical insight from our study, raised by reviewer comments, is the distinction between association and causation. We revised the language throughout to clarify that prenatal vitamin D supplementation was an observational exposure in this study, not a controlled intervention. Therefore, although maternal supplementation with ≥ 400 IU/day was associated with higher neonatal 25(OH)D levels and better neurobehavioral scores, we do not claim a causal effect of supplementation. This is a key limitation of the observational design. Furthermore, in response to reviewer concerns, we strengthened our analytical approach. We performed multivariable linear regression to examine independent associations, adjusting for a comprehensive set of confounders, including season, a known determinant of vitamin D status. After adjustment, the independent association between vitamin D status and neurodevelopmental outcomes remained significant. We also addressed concerns regarding analysis of 25(OH)D solely as a categorical variable by incorporating it as a continuous variable in regression models, confirming a positive dose–response relationship with neurodevelopmental scores.
Our observation that postnatal 25(OH)D levels (measured at 6 months and used only for descriptive analysis) increased significantly in all groups by 6 months, while early neurobehavioral differences persisted, is noteworthy. This pattern is consistent with the concept that prenatal vitamin D status (reflected by neonatal cord blood 25(OH)D, the primary exposure) and immediate postnatal vitamin D status could be linked to developmental programming during critical or sensitive windows of early brain development, a period of rapid synaptogenesis and circuit refinement (16, 38, 39). Later supplementation, while improving biochemical status, may not fully reverse subtle alterations in neural circuitry established earlier, highlighting the potential importance of ensuring sufficiency from conception through early infancy. This finding aligns with the developmental origins of health and disease hypothesis.
5.1. Study Limitations
Our study has several limitations. First, this was a single-center observational study conducted in a specific low-sunlight region, which may limit the generalizability of our findings to other populations with different geographic and lifestyle characteristics. Second, although we adjusted for a range of covariates, residual confounding cannot be ruled out. Important unmeasured factors include quantitative sunlight exposure, outdoor activity, dietary vitamin D intake, maternal psychological status (depression/anxiety), breastfeeding duration, and infant illness. These factors are likely to cause positive confounding (higher SES and healthier lifestyle improve both vitamin D status and neurodevelopment), which may overestimate the observed association. Our results remain associative and do not represent a pure biological effect of vitamin D. Third, neurodevelopmental follow-up was limited to 6 months of age; longer-term assessment is needed to determine whether the observed associations persist into childhood and affect higher cognitive functions. Fourth, this study involved multiple statistical tests. In line with our prespecified analysis hierarchy, the primary and secondary confirmatory analyses of the total neurodevelopmental scores were not adjusted for multiplicity to minimize Type II error for our main hypotheses. However, the numerous exploratory analyses conducted—including comparisons across the five individual developmental domains, subgroup analyses by gestational age, and all post hoc pairwise comparisons—substantially increase the risk of Type I (false-positive) error. Therefore, the domain-specific (e.g., language) and subgroup findings should be considered strictly exploratory, hypothesis-generating, and require validation in future research. Fifth, as an observational study, the possibility of unmeasured or residual confounding cannot be entirely ruled out; thus, our findings demonstrate association, not causation. Finally, although we adjusted for many variables, we did not perform an a priori sample size calculation, which may affect the precision of our estimates.
5.2. Future Research
Future research should address these gaps. Priority should be given to large-scale, multicenter randomized controlled trials (RCTs) designed to establish the causal efficacy and optimal dosage of prenatal vitamin D supplementation on child neurodevelopment. Such studies should incorporate long-term follow-up into childhood. Mechanistic studies measuring biomarkers (e.g., neurotrophic factors) or employing neuroimaging in conjunction with vitamin D status are needed to clarify the underlying biological pathways. Furthermore, research in high-risk populations (e.g., preterm infants and those in low-sunlight regions) should aim to develop and validate personalized screening and supplementation strategies.
5.3. Conclusions
In this prospective cohort from a low-sunlight region, sufficient neonatal cord blood 25(OH)D (primary exposure) and maternal late-pregnancy 25(OH)D (secondary exposure) levels were associated with better early neurobehavioral scores. These observational findings highlight vitamin D status as a potential marker of interest but do not establish causality. Future RCTs are needed to determine whether prenatal supplementation improves neurodevelopmental outcomes.