
1. Background
Vitamin D is a fat-soluble steroid hormone. Around 90% of vitamin D is produced due to a series of reactions in the skin, liver, and kidney (in the presence of exposure to sunlight), while 10% is obtained via diet. It is primarily involved in maintaining calcium and phosphate metabolism in the body (1). In the fetus, vitamin D is responsible for important functions. Its deficiency leads to outcomes affecting many different systems, including rickets, impaired cellular proliferation, and immune system deficiency (2, 3). Vitamin D deficiency during pregnancy has been associated with maternal problems such as preeclampsia and diabetes, and neonatal problems such as delivery of a small for gestational age (SGA) infant (4-13).
The maternal and fetal calcium balance is closely associated with maternal vitamin D levels. Many studies have documented that newborns’ cord blood 25(OH)D levels correlated with maternal vitamin D levels (14). Today, there are no clear recommendations regarding the ideal vitamin D intake throughout pregnancy, and also, the optimal vitamin D concentration in the body is unknown. Some authors have suggested that 25(OH)D levels exceeding 20 ng/mL in mothers are enough to provide sufficient vitamin D concentration in neonates; however, some recent publications have emphasized that 25(OH)D concentration should not be less than 40 ng/mL. When various data are considered, it can be said that 25(OH)D levels should be more than 30 ng/mL (15, 16).
In a study focusing on this topic from Turkey, it was found that vitamin D levels were insufficient when the threshold value was accepted as 30 ng/mL for pregnant women (16). There are studies in the literature, indicating that maternal vitamin D insufficiency may negatively affect the anthropometric measurements of neonates. However, there are also studies reporting the exact opposite (17-20). Therefore, currently, no strong recommendations can be made in terms of suggesting vitamin D supplementation for improved neonatal outcomes in expectant mothers.
2. Objectives
In light of these controversies, we designed this study to determine whether vitamin D administration throughout pregnancy could affect cord blood 25(OH)D levels, neonatal anthropometric measurements (height, head circumference, weight), and Apgar score.
3. Methods
Our study was carried out at Karabuk University Faculty of Medicine Training and Research Hospital, a center that provides tertiary-level Neonatal Intensive Care from August 1, 2020 to January 15, 2021. This study was planned as a continuation of an MD thesis; therefore, ethical approval for this research was received during the course of said study. Approval was obtained from the Ethics Committee of Karabuk University Faculty of Medicine (decision number: 2021/558, date: May 31, 2021). The study conformed to the Helsinki Declaration and good clinical practice guidelines. Data were statistically reanalyzed after excluding conditions affecting neonatal anthropometric outcomes.
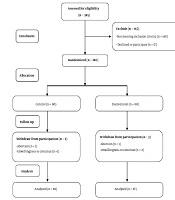
The medical information of participating pregnant females with or without vitamin D supplementation during pregnancy who gave birth at Karabuk University, Training and Research Hospital, from August 1, 2020, to January 15, 2021, were retrospectively reviewed, and anthropometric measurements and Apgar scores were recorded. At baseline, the intervention group consisted of 40 mothers (and their infants) who regularly received daily 1200 IU vitamin D, beginning from the 12th week of gestation, according to the recommendations of the Turkish Ministry of Health, while the control group comprised 40 mothers (and their infants) who did not use vitamin D supplementation regularly. Exclusion criteria were as follows: Chromosomal abnormality in the infant, maternal tobacco use or substance addiction during pregnancy, and the presence of factors affecting intrauterine development (diabetes or preeclampsia) during pregnancy follow-up.
A total of 20 pregnant women (13 with tobacco use, 5 with gestational diabetes, and 2 with preeclampsia) met the exclusion criteria; thus, these mothers and their infants were excluded from the study. Final analyses were conducted on 28 pregnant women and their infants as the intervention group and 32 pregnant women and their infants as the control group. The medical files of these pregnant women were accessed through the digital hospital information system. When deemed necessary, families were called by phone, and the information in their files was confirmed. Socio-demographic characteristics, obstetric characteristics, neonatal data, educational status, occupation, spouse's occupation, place of residence, sunlight exposure at the home, and religious headscarf wearing were recorded and compared between the groups.
3.1. Sample Size
In the calculation made using the G* Power analysis program with data from the work of Wierzejska et al. (21), it was determined that at least 60 cases (30 in each group) should be included in the study for 95% confidence interval (1-α), 95% test power (1-β), and an odds ratio of 0.05.
3.2. Statistical Analysis
The SPSS software version 25.0 was used for data analyses (IBM, Armonk, NY, USA). Obtained data were assessed with respect to 95% confidence intervals and a significance level of P < 0.05. As the parameters were normally distributed according to histograms and the Shapiro-Wilk test, we used mean and standard deviation to describe quantitative data and the independent samples t-test for comparisons of these data. Chi-square (χ2) tests (Pearson and Fisher’s Exact test, as appropriate) were used to compare categorical data between groups.
4. Results
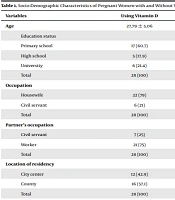
After applying the aforementioned exclusion criteria, analyses were performed on 28 pregnant women and their babies as the intervention group, and 32 pregnant women and their babies as the control group. All files meeting the inclusion criteria were fully accessed. The mean age of the intervention group (receiving vitamin D) was 27.79 ± 5.06 years and the mean age of the control group (not receiving vitamin D) was 28.09 ± 5.92 years, with no difference being detected in terms of age. Also, no differences were detected between the intervention and control groups in terms of education status (χ2 = 1.84, P = 0.399), occupation (χ2 = 0.00, P = 0.967), partner’s occupation (χ 2 = 0.08, P = 0.775), location of residency (χ 2 = 0.31, P = 0.58), sunlight exposure of the home (χ 2 = 1.23, P = 0.267) and wearing a headscarf (χ 2 = 0.82, P = 0.366) (Table 1). The present study found a significant difference between pregnant women with and without vitamin D supplementation in terms of vitamin D deficiency (χ 2 = 4.02, P = 0.045). It was observed that some women were not using vitamin D during pregnancy despite suffering from vitamin D deficiency before the pregnancy. Table 1 shows the socio-demographic characteristics of the mothers included in the study.
Table 1.
Socio-Demographic Characteristics of Pregnant Women with and Without Vitamin D Use Supplementation a
| Variables | Using Vitamin D | Not Using Vitamin D | Total | Test Statistics | P |
|---|---|---|---|---|---|
| Age | 27.79 ± 5.06 | 28.09 ± 5.92 | 27.95 ± 5.49 | t = 0.563 b | 0.456 |
| Education status | χ 2= 1.84 c | 0.399 | |||
| Primary school | 17 (60.7) | 14 (43.8) | 31 (51.7) | ||
| High school | 5 (17.9) | 7 (21.9) | 12 (20) | ||
| University | 6 (21.4) | 11 (34.4) | 7 (11.7) | ||
| Total | 28 (100) | 32 (100) | 60 (100) | ||
| Occupation | χ 2 = 0.00 c | 0.967 | |||
| Housewife | 22 (79) | 25 (78) | 47 (78.3) | ||
| Civil servant | 6 (21) | 7 (22) | 13 (21.7) | ||
| Total | 28 (100) | 32 (100) | 60 (100) | ||
| Partner’s occupation | χ 2 = 0.08 c | 0.775 | |||
| Civil servant | 7 (25) | 7 (21.9) | 14 (23.3) | ||
| Worker | 21 (75) | 25 (76.7) | 46 (76.7) | ||
| Total | 28 (100) | 32 (100) | 60 (100) | ||
| Location of residency | χ 2 = 0.31 c | 0.580 | |||
| City center | 12 (42.9) | 16 (50) | 28 (46.7) | ||
| County | 16 (57.1) | 16 (50) | 32 (53.3) | ||
| Total | 28 (100) | 32 (100) | 60 (100) | ||
| House receiving sunlight | χ 2 = 1.23 c | 0.267 | |||
| Yes | 22 (78.6) | 21 (65.6) | 43 (71.7) | ||
| No | 6 (21.4) | 11 (34.4) | 17 (28.3) | ||
| Total | 28 (100) | 32 (100) | 60 (100) | ||
| Presence of vitamin D deficiency | χ 2 = 4.02 c | 0.045 | |||
| Yes | 14 (50) | 8 (25) | 22 (36.7) | ||
| No | 14 (50) | 24 (75) | 38 (63.3) | ||
| Total | 28 (100) | 32 (100) | 60 (100) | ||
| Wearing headscarf | χ 2 = 0.82 c | 0.366 | |||
| Yes | 18 (64.3) | 24 (75) | 42 (70) | ||
| No | 10 (35.7) | 8 (25) | 18 (30) | ||
| Total | 28 (100) | 32 (100) | 60 (100) |
a Values are expressed as mean ± SD or No. (%).
b Independent samples t-test was used.
c χ 2 test was used.
The obstetric characteristics of the mothers examined are shown in Table 2. The number of pregnancies in the intervention and control groups were found to be 2.39 ± 1.03 and 2.38 ± 0.94, respectively. No significant difference was detected between the two groups for age and the number of pregnancies (t = 0.563, P = 0.456). Similarly, no significant difference was found between the case and the control groups in terms of the number of deliveries (t = 0.564, P = 0.456), the number of living children (t = 0.564, P = 0.456), and gestation week (t = 0.453, P = 0.504) (Table 1). No significant difference was detected between the intervention and control groups in terms of 1st- or 5th-minute Apgar scores of the infants (Table 2).
Table 2.
Obstetric Characteristics of Mothers with and Without Vitamin D Use a
| Variables | Using Vitamin D Supplementation | Not Using Vitamin D Supplementation | Total | P |
|---|---|---|---|---|
| Number of pregnancies | 2.39 ± 1.03 | 2.38 ± 0.94 | 2.38 ± 0.98 | 0.532 |
| Number of deliveries | 1.93 ± 0.77 | 2.19 ± 0.82 | 2.07 ± 0.8 | 0.456 |
| Number of living children | 1.93 ± 0.77 | 2.19 ± 0.82 | 2.07 ± 0.8 | 0.456 |
| Gestation week | 38.86 ± 1.04 | 38.69 ± 1.23 | 38.77 ± 1.14 | 0.504 |
| 1st min Apgar Score | 8.89 ± 0.57 | 8.81 ± 0.59 | 8.85 ± 0.58 | 0.358 |
| 5th min Apgar Score | 10.25 ± 1.76 | 9.91 ± 0.39 | 10.07 ± 1.23 | 0.135 |
a Values are expressed as mean ± SD.
Table 3 shows the characteristics of the infants after delivery in the intervention and control groups. No significant difference was detected between the groups in terms of infants’ weight (χ2 = 1.357, P = 0.595), birth height (χ 2 = 0.06, P = 0.806), birth head circumference (χ 2 = 0.04, P = 0.838), sex (χ 2 = 0.55, P = 0.457), and frequency of admission to the intensive care unit after delivery (χ 2 = 1, P = 0.551) (Table 3).
Table 3.
Infant Characteristics of the Pregnant Women Using and Not Using Vitamin D Upon Delivery a
| Variables | Using Vitamin D Supplementation | Not Using Vitamin D Supplementation | Total | χ 2b | P |
|---|---|---|---|---|---|
| Infant’s birth weight (g) | 1.357 c | 0.595 | |||
| 2501 - 3000 | 5 (17.9) | 6 (18.8) | 11 (18.3) | ||
| 3001 - 4000 | 20 (71.4) | 25 (78.1) | 45 (75) | ||
| 4001 and above | 3 (10.7) | 1 (3.1) | 4 (6.7) | ||
| Total | 28 (100) | 32 (100) | 60 (100) | ||
| Infant’s birth height (cm) | 0.06 | 0.806 | |||
| 45 - 49 | 6 (21.4) | 5 (15.6) | 11 (18.3) | ||
| 50 - 54 | 22 (78.6) | 27 (84.4) | 49 (81.7) | ||
| Total | 28 (100) | 32 (100) | 60 (100) | ||
| Infant’s birth head circumference (cm) | 0.04 | 0.838 | |||
| 32 - 34 | 8 (28.6) | 11 (34.4) | 19 (31.7) | ||
| 35 - 37 | 20 (71.4) | 21 (35.6) | 41 (68.3) | ||
| Total | 28 (100) | 32 (100) | 60 (100) | ||
| Infant’s sex | 0.55 | 0.457 | |||
| Female | 13 (46.4) | 19 (59.4) | 32 (53.3) | ||
| Male | 15 (53.6) | 13 (40.6) | 29 (46.7) | ||
| Total | 28 (100) | 32 (100) | 60 (100) | ||
| Admission to intensive care unit after delivery | 1 c | 0.551 | |||
| Yes | 1 (3.6) | 2 (6.3) | 3 (5) | ||
| No | 27 (96.4) | 30 (93.8) | 57 (95) | ||
| Total | 28 (100) | 32 (100) | 60 (100) |
a Values are expressed as No. (%).
b Chi-square test was used.
c As χ 2 test had values below 5, Fisher-Freeman-Halton Exact value was given.
When cord blood levels were categorized, a significant difference was detected in cord blood vitamin D values with the use of vitamin D by pregnant women (χ 2 = 25.71, P = 0.000). Vitamin D use throughout the pregnancy was observed to significantly increase vitamin D levels in the cord blood compared to those without supplementation. Vitamin D levels were categorized as normal in the cord blood of 53.6% of the pregnant women in the intervention group and only 3.1% of the pregnant women in the control group. Similarly, 78.1% of the pregnant women not using vitamin D and 17.9% of the women using vitamin D were detected to have vitamin D levels below 12 ng/mL (deficiency) in cord blood (Table 4).
| Variable | Using Vitamin D Supplementation | Not Using Vitamin D Supplementation | Total | χ 2c | P |
|---|---|---|---|---|---|
| Vitamin D level in the cord blood | 25.71 c | < 0.000 | |||
| Below 12 (Deficiency) | 5A (17.9) | 25B (78.1) | 30 (50) | ||
| Between 12 - 20 (Insufficiency) | 8A (28.6) | 6A (18.8) | 14 (23.3) | ||
| Above 20 (Normal) | 15A (53.6) | 1B (3.1) | 16 (26.7) | ||
| Total | 28 (100) | 32 (100) | 60 (100) |
a Values are expressed as No. (%).
b There is no difference between the variables indicated by the same capital letters (A-B).
c Chi-square tests were used.
Cord blood vitamin D levels of the mothers using vitamin D were detected to be 8.21 ng/mL at the lowest, and 38.31 ng/mL at the highest, and cord blood vitamin D values of mothers not using vitamin D were detected to be 4.20 ng/mL at the lowest and 27.09 ng/mL at the highest.
5. Discussion
The present study detected that administration of vitamin D preparation throughout the pregnancy significantly raised cord blood 25(OH)D value, but it did not affect birth head circumference, birth height, birth weight, and Apgar scores (1st and 5th minute). To eliminate the effects of maternal factors, mothers who had maternal diseases that could influence fetal development and those with tobacco use were excluded from the study.
Vitamin D deficiency is a common health issue in our country and in the world (7.17 - 18). Vitamin D insufficiency during the pregnancy period is one of the indicators of this community health issue. In a Turkish study, vitamin D insufficiency was detected to be present in 66 – 100% of the population studied (22). Similarly, vitamin D insufficiency was shown in both mothers and the cord blood in Indian, British and Australian populations (23-25). According to a circular issued by Turkish Ministry of Health in 2011, daily vitamin D supplementation at 1200 IU dose starting from the 12th week of gestation until six months after delivery is recommended to all pregnant women. However, compliance with this recommendation is low. In a study performed after this circular, it was detected that only 58% of pregnant women used vitamin D supplementation and that 86.2% of these pregnant women used a lower dose than recommended (26). The fact that the 25(OH)D value is below 40 ng/mL in all cord blood samples and above 30 ng/mL in only three samples suggests that vitamin D supplementation given during pregnancy in Turkey is not sufficient.
According to the recommendations of the U.S. Endocrine Society, it has been reported that a daily dose of 1500 - 2000 IU of vitamin D should be administered to reach the recommended > 30 ng/mL vitamin D levels during pregnancy. Therefore, according to this recommendation, it may be beneficial to increase the recommendation of 1200 IU vitamin D supplementation during pregnancy in our country (27).
In their study covering a decade in the United Kingdom, Gale et al. reported that there were no correlations between maternal vitamin D value and neonatal anthropometric measurements (24). In an Australian study in 2017, it was shown that cord blood 25(OH)D levels did not affect somatic growth and neurological development (28). In their cross-sectional study in Poland, Wierzejska et al. studied 94 pregnant females and their term infants and concluded no correlation between cord blood and maternal vitamin D levels, and neonatal height, head circumference, chest circumference and birth weight (21). In their study in Denmark, Moller et al. also concluded no correlation between cord blood vitamin D level, and neonatal measurements and Apgar score (29). The results of our study are in parallel with the results of prior studies.
In their study in 2016, Dalgard et al. demonstrated that third trimester maternal 25(OH) vitamin D level correlated with the infant’s height but did not correlate with the infant’s weight (17). The data of our study did not show any relationships between vitamin D levels and infant height. In Iran, Sabour et al. stated that there was a positive correlation between maternal vitamin D value and birth height; however, they did not find a significant correlation between birth weight and head circumference (18). No data supporting these findings were found in our study. In a prospective cohort study published in 2017, maternal 25(OH)D level was found to be strongly correlated with abdominal circumference, head circumference and birth weight (when analyzed without adjustment for ethnicity) (20). Our findings were not compatible with the results of this study.
In a Turkish cross-sectional analytic study in 100 pregnant females giving birth at term and their infants, vitamin D levels were detected to be significantly higher in the mothers who used regular vitamin D supplementation during pregnancy compared to the ones who did not, and the birth height, head circumference and chest circumference of the infants of the mother who used vitamin D supplementation were found to be significantly higher than the infants of the mothers who did not use vitamin D supplementation. Birth weights were found to be similar, and 5th minute Apgar Score was found to be significantly higher in infants who received vitamin D supplementation (16). In another Turkish study, the rate of delivery of SGA infants was found to be significantly higher in pregnant women who had vitamin D levels of < 20 ng/mL during the third trimester (30).
In the present study, we found no correlation between cord blood vitamin D levels and neonatal development parameters, and no difference between the two groups in terms of the rate of SGA infant delivery–assessed by Fenton percentile curves. Apgar scores were also found to be similar in the two groups.
5.1. Limitations of Our Study
The small number of cases was due to the fact that the data were obtained from a single center. In addition, this was a retrospective cross-sectional study and carried all limitations associated with this design.
5.2. Conclusions
While the present study showed significant elevation in cord blood 25(OH)D level in infants who received vitamin D throughout their intrauterine lives, no effect was detected when outcomes such as birth head circumference, birth height, birth weight, and Apgar scores (1st and 5th minute) were assessed. The fact that cord blood vitamin D values were below 40 ng/mL in all mothers included in this study indicates insufficient vitamin D supplementation administered throughout pregnancy. We believe that supplementation during pregnancy should be initiated earlier and at higher doses.