1. Background
Thrombocytopenia is frequently encountered in patients admitted to intensive care units (ICUs), and has been shown to be predictive of mortality in adult patients (1-4), as well as in pediatric patients admitted to pediatric ICUs (PICUs) (5). Thrombocytopenia in sepsis patients is caused by combinations of several mechanisms, including decreased platelet synthesis, increased platelet destruction, and thrombus formation (6), with approximately 40% of patients with severe sepsis having platelet counts below 80,000/mm3 (7). During episodes of septic shock, platelets aggregate around the site of inflammation, with subsequent multiorgan failure aggravating thrombocytopenia (8).
Several studies have shown that platelet counts and function are reduced in patients with severe sepsis and septic shock (9-11). Moreover, platelet indices, such as mean platelet volume (MPV) and platelet distribution width (PDW), have been associated with these conditions (12, 13). Increased MPV was observed in adults with septic shock (14) and in neonatal sepsis patients (15). Less is known, however, about platelet counts and platelet indices in pediatric sepsis patients.
This study was designed to evaluate the association of platelet counts and platelet indices with mortality in pediatric septic shock patients, as well as to assess whether platelet parameters are predictive markers of survival in these patients. Because the presence of underlying hemato-oncologic disease may greatly influence baseline platelet counts, the associations between platelet parameters and mortality were separately analyzed in groups of patients with and without underlying hemato-oncologic disease.
2. Methods
The medical records of pediatric patients admitted to the PICU of Asan medical center children’s hospital, Seoul, Korea, from February 2012 through May 2015, with a diagnosis of septic shock, were retrospectively reviewed. Septic shock was defined according to the 2005 international pediatric sepsis consensus conference (IPSCC) criteria (16).
The demographic characteristics, underlying diseases, sources of infection, and laboratory results of all included patients were obtained from their medical records. The severity of illness and organ dysfunction were assessed by measuring Pediatric Risk of Mortality III (PRISM III) scores, sequential organ failure assessment (SOFA) scores, and Vasoactive Inotropic Scores (VIS) within 24 hrs of PICU admission.
Complete blood cell (CBC) count and blood chemistry were measured within 1 hour of admission to the PICU. Platelet count, MPV, and PDW were obtained from routine CBC results. All statistical analyses were performed using Windows SPSS software, version 18. Continuous variables in survivors and non-survivors were compared using independent t-tests. Receiver operating characteristic (ROC) curve analyses were performed to evaluate the usefulness of platelet parameters as prognostic markers. For each variable, 95% confidential intervals (CIs) and optimal cutoff points were determined. A P value less than 0.05 was considered statistically significant.
The study protocol was approved by the institutional review board of the Asan Medical Center.
3. Results
A total of 90 pediatric patients were admitted to the PICU for septic shock from February 2012 to May 2015. Seven patients were excluded owing to a lack of relevant data at admission, including MPV and PDW; thus, 83 patients were enrolled. The 28 day in-hospital mortality rate was 25.3% (21/83). Of the 83 patients, 78 (94.0%) had underlying diseases, with 38 having hemato-oncologic diseases. Pathogenic microorganisms were documented in 47 patients. The most common Gram-positive and Gram-negative bacteria were Staphylococcus aureus and Klebsiella pneumoniae, respectively, and all cases of fungal sepsis were attributed to Candida albicans (Table 1).
Table 1.
Patient Characteristicsa
| Variables | No. of Patients |
|---|---|
| N | 83 |
| Age, months | 128.0 ± 159.6 |
| Gender, male/female | 52/31 |
| Mortality | 21 (25.3) |
| Underlying disease | 78 (94.0) |
| Hemato-oncologic disease | 38 (48.7) |
| Neurologic disease | 13 (16.7) |
| Cardiac disease | 8 (10.3) |
| Pulmonary disease | 6 (7.7) |
| Chronic renal disease | 5 (6.4) |
| Gastrointestinal disease | 3 (3.8) |
| Endocrinologic disease | 3 (3.8) |
| Other | 2 (2.6) |
| Proven microorganism | 47 (56.6) |
| Gram-positive bacteria | 19 (40.4) |
| Staphylococcus aureus | 5 |
| Streptococcus mitis | 3 |
| Streptococcus agalactiae | 2 |
| Staphylococcus hominis | 2 |
| Enterococcus faecalis | 2 |
| Other | 5 |
| Gram-negative bacteria | 22 (46.8) |
| Klebsiella pneumonia | 9 |
| Escherichia coli | 5 |
| Pseudomonas aeruginosa | 4 |
| Enterobacter cloacae | 2 |
| Other | 2 |
| Fungus | 6 (12.8) |
| Candida albicans | 6 |
aValues are expressed as mean ± SD or No. (%).
Age, sex, and length of PICU stay did not differ significantly in survivors and non-survivors. PRISM III, SOFA, and VIS scores, all of which reflect disease severity, were significantly greater in the non-survivors than in survivors. Documentation of pathogen was not associated with survival, but underlying disease was. Of the 21 non-survivors, 14 (66.7%) had underlying hemato-oncologic disease. C-reactive protein (CRP) and lactate concentrations were significantly higher in non-survivors than in survivors. Platelet count was 3-fold higher in survivors than in non-survivors (146.6 ± 133.7 × 10³/mm3 vs 46.1 ± 44.1 × 10³/mm3, P = 0.000). Mean MPV (P = 0.059) and PDW (P = 0.077) were higher in survivors, but the differences were not statistically significant (Table 2).
Table 2.
Clinical Characteristics of Survivors and Non-Survivorsa
| Variables | All Patients (n = 83) | Survivors (n = 62) | Non-Survivors (n = 21) | P Value |
|---|---|---|---|---|
| Age, mo | 128.0 ± 159.6 | 114.4 ± 85.0 | 168.3 ± 282.9 | 0.182 |
| Male | 52 (62.7) | 38 (61.3) | 14 (66.7) | 0.796 |
| Length of PICU stay | 14.84 ± 15.30 | 14.77 ± 15.82 | 15.05 ± 14.00 | 0.944 |
| PRISM III score | 15.67 ± 8.17 | 13.55 ± 5.67 | 21.95 ± 10.95 | 0.003 |
| SOFA score | 9.71 ± 3.17 | 8.87 ± 2.72 | 12.19 ± 3.16 | 0.000 |
| VIS | 35.00 ± 38.46 | 27.66 ± 25.19 | 56.68 ± 58.88 | 0.039 |
| Hemato-oncologic disease | 38 (45.8) | 24 (38.7) | 14 (66.7) | 0.042 |
| Proven microorganism | 47 (56.6) | 35 (56.5) | 12 (57.1) | 0.956 |
| Laboratory findings | ||||
| WBC, mm3 | 6,567 ± 7,468 | 7,223 ± 7,487 | 4,633 ± 7,243 | 0.171 |
| Platelet, × 103/mm3 | 121.1 ± 125.3 | 146.6 ± 133.7 | 46.1 ± 44.1 | 0.000 |
| Mean platelet volume, fl | 10.50 ± 1.12 | 10.63 ± 1.18 | 10.10 ± 0.80 | 0.059 |
| Platelet distribution width, fl | 12.17 ± 2.81 | 12.48 ± 2.98 | 11.23 ± 2.05 | 0.077 |
| CRP, mg/dL | 15.03 ± 9.41 | 13.85 ± 8.85 | 18.52 ± 10.33 | 0.049 |
| Lactate, mmol/L | 3.88 ± 4.06 | 2.45 ± 2.21 | 8.10 ± 5.25 | 0.000 |
Abbreviations: CRP, C-reactive protein; PICU, pediatric intensive care unit; PRISM III, pediatric risk of mortality III; SOFA, sequential organ failure assessment; VIS, vasoactive inotropic scores; WBC, white blood cell.
aValues are expressed as mean ± SD or No. (%).
The associations between platelet count and mortality according to underlying disease were analyzed separately in the 38 patients with and the 45 without hemato-oncologic disease. Mean platelet counts in both subgroups were significantly higher in survivors than in non-survivors (Table 3). ROC analysis showed that the areas under the curve (AUCs) were 0.796 for all patients, 0.722 for patients with hemato-oncologic diseases, and 0.857 for patients without hemato-oncologic diseases (Figure 1). Using Youden’s J-statistics, we calculated that the platelet count cutoffs for predicting mortality were 52.0 × 10³/mm3 for all patients, 30.5 × 10³/mm3 for patients with hemato-oncologic diseases, and 106.5 × 10³/mm3 for patients without hemato-oncologic diseases, with sensitivities of 71.4%, 78.6%, and 85.7%, respectively, and specificities of 71.0%, 66.7%, and 78.9%, respectively. The accuracies, positive predictive values, and negative predictive values for these cutoffs are shown in Table 4. The risk ratios for mortality in these three groups of patients with platelet counts under the cutoff values were 6.111, 7.333, and 22.5, respectively (Table 4). With the significant variable from the univariate analysis, a multivariate logistic regression analysis was executed, and the platelet count was statistically significant (OR = 0.988, P = 0.04, Table 5).
Table 3.
Mean Platelet Counts in Survivors and Non-Survivors
| Platelet, × 103/mm3 | Survivors (n = 62) | Non-Survivors (n = 21) | P Value |
|---|---|---|---|
| All patients | 146.6 ± 133.7 | 46.1 ± 44.1 | 0.000 |
| With hemato-oncologic diseases | 43.1 ± 22.4 | 28.6 ± 16.9 | 0.044 |
| Without hemato-oncologic diseases | 211.9 ± 133.6 | 81.0 ± 61.0 | 0.015 |
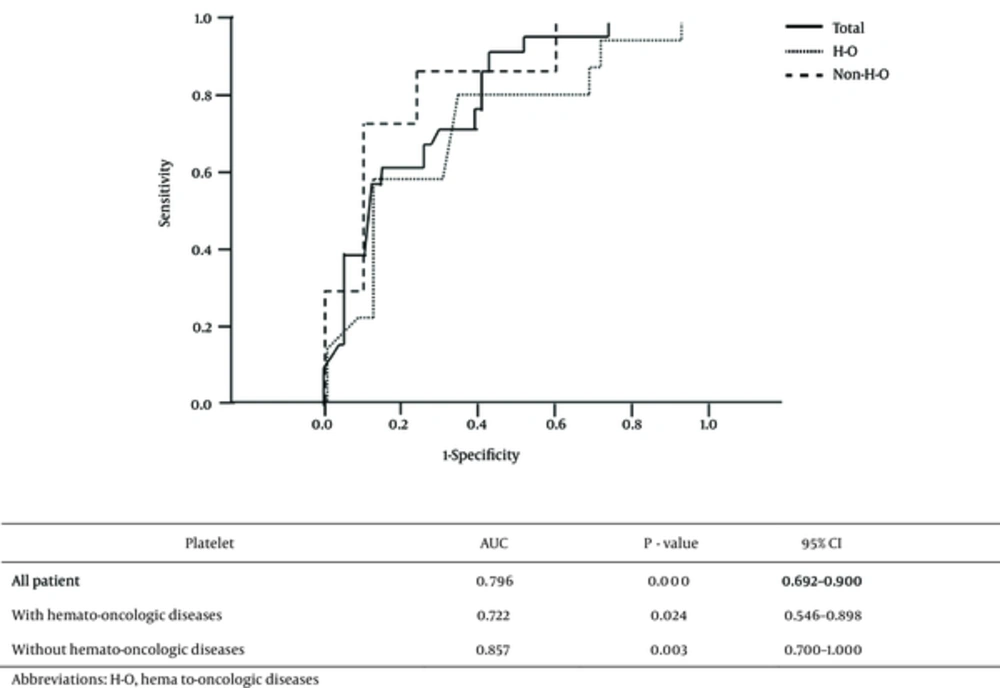
Figure 1.
Receiver Operating Characteristic (ROC) Curve Analysis of the Associations Between Platelet Counts and Mortality
Table 4.
Cutoff Values for Platelet Count in Patients With and Without Hemato-Oncologic Diseasesa
| Validation Values | All Patients | With hemato-Oncologic Diseases | Without Hemato-Oncologic Diseases |
|---|---|---|---|
| Platelet, × 103/mm3 | 52.0 | 30.5 | 106.5 |
| Sensitivity | 71.4 | 78.6 | 85.7 |
| Specificity | 71.0 | 66.7 | 78.9 |
| Accuracy | 71.1 | 71.0 | 80.0 |
| Positive predictive value | 45.5 | 57.9 | 42.9 |
| Negative predictive value | 88.0 | 84.2 | 96.8 |
| Risk ratio | 6.111 | 7.333 | 22.500 |
| 95% CI | 2.046 - 18.251 | 1.583 - 33.967 | 2.357 - 214.778 |
| P Value | 0.001 | 0.017 | 0.002 |
Abbreviation: CI, confidence interval.
aValues are expressed as %.
Table 5.
Multivariate Logistic Regression Analysis for Mortality
| Variables | Coefficient | P Value | Odds Ratio (95% Confidence Interval) |
|---|---|---|---|
| PRISM III | 0.092 | 0.145 | 1.096 (0.969 - 1.240) |
| SOFA | 0.230 | 0.062 | 1.258 (0.988 - 1.601) |
| VIS | -0.002 | 0.813 | 0.998 (0.981 - 1.015) |
| Platelet counts | -0.012 | 0.040 | 0.988 (0.977 - 0.999) |
| MPV | -0.694 | 0.230 | 0.500 (0.161 - 1.551) |
| PDW | -0.008 | 0.974 | 0.992 (0.630 - 1.563) |
Abbreviation: MPV, mean platelet volume; PDW, platelet distribution width; PRISM III, pediatric risk of mortality III; SOFA, sequential organ failure assessment; VIS, Vasoactive Inotropic Scores.
4. Discussion
Thrombocytopenia is frequently encountered in severe sepsis patients (9) and has been associated with prognosis (17, 18). However the association between platelet indices and mortality in septic shock patients is unclear. For example, increased MPV has been associated with mortality in adult septic shock patients (19, 20), but has shown contradictory results in neonatal patients with sepsis (21). Our study, involving pediatric septic shock patients, showed that platelet count on PICU admission was significantly associated with mortality, but that platelet indices such as MPV and PDW were not associated with mortality in these patients.
This study had two major findings. First, platelet count was predictive of mortality in pediatric septic shock patients, regardless of the underlying disease. Whether or not these patients had an underlying hemato-oncologic disease did not affect the association between platelet count and mortality. Low platelet counts are not uncommon in patients with hemato-oncologic diseases, even during disease-free periods, due both to the underlying disease itself and to treatment methods such as chemotherapy and irradiation. We found, however, that the mean platelet count in surviving patients with hemato-oncologic diseases was 43.1 × 10³/mm3, which, although lower than the normal reference range, and even lower than minimum criteria(50.0 × 10³/mm3) of the pediatric risk of mortality (PRISM) III score, was significantly higher than that of non-survivors with hemato-oncologic diseases. Even among patients without hemato-oncologic diseases, who had baseline platelet counts in the normal reference range, platelet count was predictive of mortality, with an AUC of 0.857, a sensitivity of 85.7%, and a specificity of 78.9%.
The second major finding of this study was the determination of cutoff values for platelet count predictive of mortality, suggesting specific reference ranges that can be utilized in clinical settings. Platelet counts showed excellent negative predictive values in all patients (88.0%) and in patients with (84.2%) and without (96.8%) hemato-oncologic diseases. Patients with platelet count higher than the cutoff values would therefore be at decreased risk of 28 day mortality. For example, the predicted survivability rate in pediatric septic shock patients without underlying hemato-oncologic diseases and an initial platelet count of 106.5 × 10³/mm3 is 96.8%.
Additional studies are needed to determine whether platelet transfusions that maintain adequate platelet count can reduce mortality rates in pediatric septic shock patients. Platelet transfusion guidelines recommend different criteria based on the underlying disease or clinical status of the patients (22-24). We observed that a cutoff value of 30.5 × 10³/mm3 had optimal sensitivity and specificity in patients with hemato-oncologic diseases. Thus, future studies may address whether platelet transfusions that maintain platelet counts above this cutoff in pediatric septic shock patients with underlying hemato-oncologic diseases can potentially enhance survival rate.
This study had several limitations. It was a retrospective observational study with a small sample size conducted in a single medical center. Further, we did assess the effects of microorganisms on platelet counts. Microorganisms have been shown to alter platelet responses in both very low birth weight infants (25, 26) and adults (14). However, microorganism growth was documented in few of these patients. Large-scale, prospective, multicenter studies that include data on microorganisms are needed to validate our findings.
In conclusion, platelet count is a useful predictor of mortality in pediatric septic shock patients, regardless of the presence of underlying hemato-oncologic disease. In contrast, MPV and PDW were not significant predictors of patient mortality.