
1. Background
In many parts of the world, obesity in school-aged children has become a major public health concern (1). Recent research in different countries has indicated a substantial increase in the rates of obesity (2). Obesity is one of the most important risk factors for chronic diseases (1, 3, 4). Changes in dietary patterns have been recognized as a chief cause of overweight and obesity (5). Therefore, it is important to examine dietary intake of this age group to learn about their dietary characteristics (1, 6) and possible improvements needed.
Dietary diversity score (DDS) reflects the number of food items consumed between and within food groups during a distinct time period. Eating a varied diet has been depicted as a preventive measure to prevent chronic diseases, including metabolic syndrome and can improve health status (7, 8). Even though higher DDS may lead to lower BMI due to higher consumption of dietary fiber, vitamin C and calcium, which are inversely associated with obesity, a more diverse diet can also be associated with higher energy intake (1, 7, 9).
In Iran, recent studies conducted in this field have shown conflicting results. Childhood and adolescence is known as a critical period in which dietary patterns are shaped with the potential to influence long-term health (10). Yet limited data are available on dietary intake of Iranian school-aged children.
2. Objectives
The main focus of this study was to examine the relationship between weight status and dietary intake and DDS in school-aged children (10 - 12-years old) in Tehran city.
3. Methods
3.1. Subjects
This cross-sectional study was carried out on a randomly-selected sample of fifth- and sixth-grade primary school children in Tehran. A total of 186761 children were eligible to participate, out of which, 900 were invited and 803 (384 girls and 419 boys) took part in the study, from October 2015 to March 2016. A multistage systematic cluster sampling frame was used. The nineteen educational districts in Tehran city were categorized into three socioeconomic categories (affluent, middle income and deprived). First, three districts from each of the three socioeconomic categories were chosen based on the population of their students. Then, public and private schools from each of these nine districts were selected based on the number of students in the schools. Finally, fifth- and sixth-grade students from each school were randomly selected.
Subjects were excluded if they or their parents did not complete the written consent form (97 students), or if their parents did not cooperate in completing 24-hours recall (84 students) and demographic questionnaires (54 students) (Figure 1). Non-Iranians and those with physical disability or sickness were not recruited for the study.
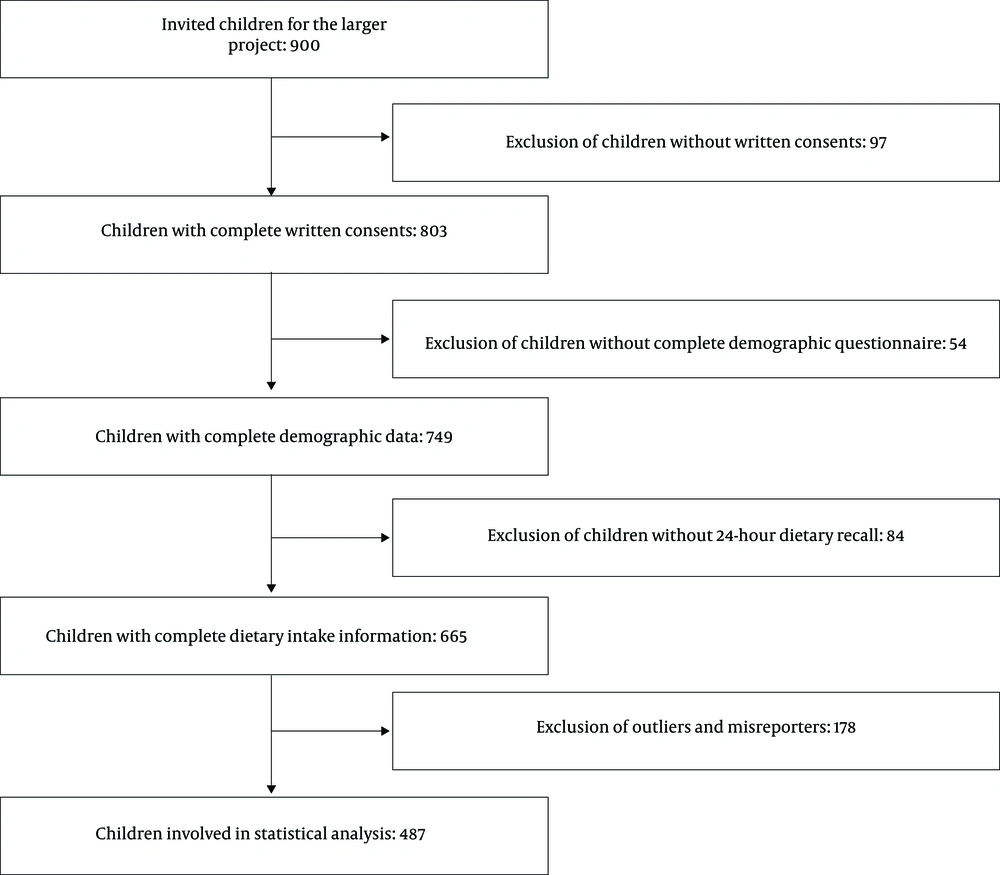
Figure 1.
Flow chart of children included in this study
Data collection was done by a team of 7 trained nutritionists. Prior to data collection, an interviewer training session was carried out to ensure consistency between interviewers. Data were gathered in the schools. To complete 24-hours recalls, physical activity and demographic questionnaires face-to-face interviews were conducted. Then parents were invited to help with completing the information. For those who were not able to attend the schools, telephone interviews were conducted.
3.2. Dietary Assessments
Dietary intake of children was assessed using 3-day 24-hours recalls (2 weekdays and one weekend) (11). Students were requested to recall all the food and drinks they had consumed during the day prior to the interview (12). Standard reference tables were used to convert reported portions into grams (12). The only available Iranian Food Composition Table (FCT) (13) provides the composition of a very limited number of raw food items; therefore, USDA FCT was used as the main food data base and the Iranian FCT complemented it. Then recalls were transferred to a software for nutrient analysis (nutritionist IV). For mixed dishes, the calculations were based on their ingredients. Finally, for each child, mean daily intakes of energy, macronutrients and food groups were calculated.
DDS of each child was calculated based on five main food groups: (1) grains, (2) vegetables, (3) fruits, (4) dairies and (5) protein foods (14) (Supplementary File Appendix 1). These main groups were divided into 23 subgroups, by which the total DDS and DS (diversity score) of each five main food groups were calculated according to Haines et al. (14).
3.3. Under/Over-Reporting
The error in self-reported dietary information is an important point that needs to be considered in data management, since it can affect associations between dietary intake and weight status (15). To determine dietary reporting accuracy of the students, their BMR (basal metabolic rate) was estimated by using the equations published by Schofield (16) taking into account age, sex, body height and weight. The ratio of EI (energy intake) to BMR (EI/BMR) was subsequently calculated. An individual’s daily food intake was considered under-reported, if EI/BMR ratio was less than 1.14, or over-reported if it was higher than 2.5 (17). Over- and under-reporters were excluded from the study as ‘misreporters’.
3.4. Anthropometric Measurements
Height and weight were measured based on standard methods (18) and BMI was calculated. BMI-Z-score for age and sex were determined according to WHO Child Growth Standards software (AnthroPlus, WHO, Geneva, Switzerland, 2007) (19). Weight status was categorized into four groups: thin (Z score: < -2SD), normal (Z score: ≥ -2SD and ≤ 1SD), overweight (Z score: > 1SD and ≤ 2SD) and obese (Z score: > 2SD) (the Z score was based on the BMI-Z-score). Girls were asked whether they had experienced menarche and their weight status was recorded as pre- and post-menarche.
3.5. Covariates
The children’s demographic and socioeconomic characteristics are presented in the Supplementary file Appendices 2 and 3 as covariates of this study. Also, children’s physical activity was measured by a locally validated version of child and adolescent international physical activity questionnaire (20) through face to face interview as another covariate.
3.6. Statistical Analysis
Data were presented as means and SDs for continuous variables and frequencies and percentages for categorical variables. The normality of distribution was assessed by the Kolmogorov-Smirnov test. Using chi-square test, the differences between qualitative variables were examined. To estimate the association between weight status and dietary intakes and DDS, logistic regression was applied. In multivariable adjusted models, data were controlled for the covariates, including energy and physical activity. Data analysis was done by the SPSS software (version 16.0; SPSS Inc., Chicago, IL, USA, 2007) and P values < 0.05 were considered as statistically significant.
4. Results
After data cleaning and excluding all outliers of BMI-Z-score (10 students), and diet recall misreporters (168 students), 487 students (268 girls and 219 boys) remained for statistical analysis (Figure 1). The characteristics of subjects excluded did not differ significantly from those remained in the study. The mean age and BMI of participants were 11.23 years and 19.66 kg/m2, respectively. Based on the BMI Z-scores, 29% of students were overweight, 15.6% were obese and 1.4% were thin. An analysis of background characteristics of the studied children (Supplementary File Appendices 2 and 3) showed that there was a marginal significant association between weight status with puberty stage and father’s job position in girls (P < 0.06) and with maternal education in boys (P < 0.08). Frequency of overweight or obesity was significantly more in girls in post-menarche stage compared to those in pre-menarche stage (P = 0.05). Moreover, overweight and obesity were higher in girls whose fathers were employees, high-rank employees/self-managers, respectively, as compared to those with other job positions. In boys, overweight and obesity were higher in those whose mothers had an educational level equal to 6 - 9 years and diploma or higher degree than boys whose mothers were illiterate or had ≤ 5 years education (P < 0.08). Other associations between weight status and background characteristics were insignificant.
The mean energy and macronutrient intakes in boys were significantly higher than in girls (Supplementary File Appendix 4). Multinomial logistic regression was used to estimate the association between energy and macronutrients intake and weight status. After adjusting for covariates, the association between obesity and the lowest and middle tertile of energy intake in boys were statistically significant (odds ratio = 0.04; 95% CI: 0.002 to 0.97, odds ratio = 0.20; 95% CI: 0.04 to 0.85, respectively) as compared to those in the highest tertile. In both sexes, there was no relationship between macronutrients intake and weight status (Table 1).
Table 1.
Odds Ratioa and 95% Confidence Intervals (95% CI) for the Association Between Energy and Macronutrients Intake and BMI-Z-Score for Age Categories for Children
| Girls (N = 268) | ||||
|---|---|---|---|---|
| Unadjusted Odds Ratio (95% CI) | Adjusted Odds Ratio (95% CI)b,c | |||
| Overweight | Obese | Overweight | Obese | |
| Energy | ||||
| Tertile 1 (lowest) | 0.99 (0.22 - 4.33) | 0.08 (0.005 - 1.23) | 1.56 (0.27 - 8.74) | 0.06 (0.002 - 1.97) |
| Tertile 2 | 1.70 (0.64 - 4.53) | 0.52 (0.15 - 1.79) | 1.97 (0.61 - 6.34) | 0.50 (0.08 - 3.11) |
| Tertile 3 (highest) | Reference | Reference | Reference | Reference |
| Carbohydrate | ||||
| Tertile 1 (lowest) | 1.29 (0.40 - 4.19) | 1.21 (0.19 - 7.77) | 0.99 (0.25 - 3.93) | 0.36 (0.03 - 4.02) |
| Tertile 2 | 0.91 (0.38 - 2.17) | 1.51 (0.50 - 4.57) | 0.69 (0.25 - 1.91) | 2.14 (0.47 - 9.68) |
| Tertile 3 (highest) | Reference | Reference | Reference | Reference |
| Protein | ||||
| Tertile 1 (lowest) | 0.59 (0.25 - 1.41) | 1.58 (0.45 - 5.54) | 0.56 (0.21 - 1.49) | 3.35 (0.54 - 20.70) |
| Tertile 2 | 0.59 (0.29 - 1.23) | 1.07 (0.41 - 2.77) | 0.55 (0.24 - 1.22) | 1.34 (0.35 - 5.13) |
| Tertile 3 (highest) | Reference | Reference | Reference | Reference |
| Fat | ||||
| Tertile 1 (lowest) | 1.42 (0.61 - 3.69) | 0.22 (0.02 - 2.07) | 1.54 (0.54 - 4.35) | 0.13 (0.008 - 2.19) |
| Tertile 2 | 0.80 (0.38 - 1.69) | 1.34 (0.52 - 3.47) | 0.76 (0.32 - 1.81) | 1.05 (0.28 - 3.93) |
| Tertile 3 (highest) | Reference | Reference | Reference | Reference |
| Boys (N = 219) | ||||
| Unadjusted Odds Ratio (95% CI) | Adjusted Odds Ratio (95% CI)b | |||
| Overweight | Obese | Overweight | Obese | |
| Energy | ||||
| Tertile 1 (lowest) | 0.61 (0.09 - 4.07) | 0.03 (0.002 - 0.53)d | 1.47 (0.15 - 13.82) | 0.04 (0.002 - 0.97)d |
| Tertile 2 | 0.82 (0.28 - 2.34) | 0.31 (0.10 - 0.98)d | 1.54 (0.42 - 5.59) | 0.20 (0.04 - 0.85)d |
| Tertile 3 (highest) | Reference | Reference | Reference | Reference |
| Carbohydrate | ||||
| Tertile 1 (lowest) | 0.81 (0.21 - 3.16) | 1.34 (0.25 - 6.95) | 0.44 (0.09 - 2.11) | 0.45 (0.06 - 3.19) |
| Tertile 2 | 1.58 (0.66 - 3.78) | 2.10 (0.85 - 5.21) | 1.66 (0.59 - 4.62) | 2.31 (0.74 - 7.21) |
| Tertile 3 (highest) | Reference | Reference | Reference | Reference |
| Protein | ||||
| Tertile 1 (lowest) | 0.31 (0.09 - 1.06) | 0.65 (0.19 - 2.15) | 0.32 (0.07 - 1.32) | 0.82 (0.19 - 3.43) |
| Tertile 2 | 1.15 (0.52 - 2.52) | 0.67 (0.27 - 1.64) | 0.87 (0.33 - 2.30) | 0.75 (0.24 - 2.33) |
| Tertile 3 (highest) | Reference | Reference | Reference | Reference |
| Fat | ||||
| Tertile 1 (lowest) | 2.48 (0.79 - 7.80) | 3.24 (0.87 - 12.01) | 1.98 (0.50 - 7.72) | 2.99 (0.64 - 13.93) |
| Tertile 2 | 1.11 (0.48 - 2.57) | 1.60 (0.66 - 3.90) | 0.96 (0.36 - 2.54) | 1.30 (0.44 - 3.79) |
| Tertile 3 (highest) | Reference | Reference | Reference | Reference |
aMultinomial logistic models comparing weight category to non-obese group/energy and macronutrients intake tertiles (reference group for energy and macronutrients intake: highest tertile/for weight: thin and normal (as one group)).
bAdjusted for grade, birth order, family size, ethnicity, parents’ age and education, father job position, mother employment, Other income source of family members, house ownership status, financial support source, energy and physical activity.
cAdditional adjusted for menstruation.
dSignificant at P < 0.05.
The subjects consumed bread and grains, as well as vegetables and fruits more than the USDA recommendation, while intake of meat and dairy was lower. Bread, grains and meat intakes were significantly higher in boys than in girls (P = 0.001); while girls consumed more vegetables than boys (P = 0.02) (Supplementary File Appendix 5). Based on multinomial regression, after adjusting for covariate factors, no significant association was found between weight status and food groups intake categories in both sexes (Table 2).
Table 2.
| Girls (N = 268) | ||||
|---|---|---|---|---|
| Unadjusted Odds Ratio (95% CI) | Adjusted Odds Ratio (95% CI)c,d | |||
| Overweight | Obese | Overweight | Obese | |
| Bread and grains, ounce | ||||
| ≥ 5 | 2.68 (0.53 - 13.4) | 2.10 (0.23 - 18.61) | 3.24 (0.58 - 18.15) | 2.26 (0.09 - 56.8) |
| < 5 | Reference | Reference | Reference | Reference |
| Vegetables, cup | ||||
| ≥ 2 | 0.47 (0.40 - 4.49) | 0.38 (0.02 - 6.70) | 0.61 (0.05 - 6.51) | 0.10 (0.002 - 4.14) |
| < 2 | Reference | Reference | Reference | Reference |
| Fruits, cup | ||||
| ≥ 1.5 | 0.90 (0.51 - 1.58) | 0.79 (0.35 - 1.75) | 0.81 (0.43 - 1.53) | 0.79 (0.27 - 2.29) |
| < 1.5 | Reference | Reference | Reference | Reference |
| Meat, ounce | ||||
| ≥ 5 | 1.47 (0.68 - 3.18) | 1.40 (0.47 - 4.15) | 1.12 (0.86 - 5.20) | 0.57 (0.13 - 2.53) |
| < 5 | Reference | Reference | Reference | Reference |
| Dairy, cup | ||||
| ≥ 3 | 2.46 (0.32 - 18.47) | 3.13 (0.26 - 37.29) | 2.09 (0.24 - 17.50) | 5.81 (0.21 - 64.22) |
| < 3 | Reference | Reference | Reference | Reference |
| Boys (N = 219) | ||||
| Unadjusted Odds Ratio (95% CI) | Adjusted Odds Ratio (95% CI)c | |||
| Overweight | Obese | Overweight | Obese | |
| Bread and grains, ounce | ||||
| ≥ 6 | 2.82 (0.48 - 16.30) | 0.86 (0.20 - 3.70) | 7.89 (0.66 - 93.97) | 1.13 (0.16 - 7.60) |
| < 6 | Reference | Reference | Reference | Reference |
| Vegetables, cup | ||||
| ≥ 2.5 | 0.59 (0.05 - 6.42) | 1.66 (0.18 - 15.14) | 0.78 (0.06 - 10.38) | 3.96 (0.27 - 57.23) |
| < 2.5 | Reference | Reference | Reference | Reference |
| Fruits, cup | ||||
| ≥ 1.5 | 0.86 (0.45 - 1.65) | 1.34 (0.65 - 2.74) | 1.29 (0.57 - 2.92) | 1.99 (0.78 - 5.07) |
| < 1.5 | Reference | Reference | Reference | Reference |
| Meat, ounce | ||||
| ≥ 5 | 2.36 (0.92 - 6.02) | 0.84 (0.15 - 4.62) | 1.66 (0.66 - 4.20) | 1.32 (0.49 - 3.57) |
| < 5 | Reference | Reference | Reference | Reference |
| Dairy, cup | ||||
| ≥ 3 | 2.71 (0.31 - 23.81) | 1.90 (0.86 - 4.20) | 0.67 (0.09 - 4.77) | 0.50 (0.06 - 4.12) |
| < 3 | Reference | Reference | Reference | Reference |
aMultinomial logistic models comparing weight category to non-obese group/food groups intake category (reference group for food groups intake: lower than recommendation/for weight: thin and normal (as one group)).
bSignificant at P < 0.05.
cAdjusted for grade, birth order, family size, ethnicity, parents’ age and education, father job position, mother employment, Other income source of family members, house ownership status, financial support source, energy and physical activity.
dAdditional adjusted for menstruation.
Table 3 shows the results of multinomial logistic regression on the association between dietary diversity score and weight status. After adjusting for covariates a significant association was observed between the middle tertile of grains diversity score and obesity in boys (odds ratio = 5.84; 95% CI: 1.29 to 26.42) as compared to the highest tertile. Also, in girls associations between the lowest and middle tertiles of dairy diversity score and overweight were statistically significant (odds ratio = 10.02; 95% CI: 1.70 to 59.13, odds ratio = 5.43; 95% CI: 1.03 to 28.72, respectively) as compared to the highest tertile.
Table 3.
Odds Ratioa and 95% Confidence Intervals (95% CI) for the Association Bbetween DDS1 and BMI-Z-Score for Age Categories for Children
| Girls (n = 268) | ||||
|---|---|---|---|---|
| Unadjusted Odds Ratio (95% CI) | Adjusted Odds Ratio (95% CI)b,c | |||
| Overweight | Obese | Overweight | Obese | |
| Total dietary diversity score | ||||
| Tertile 1 (lowest) | 0.58 (0.15 - 2.26) | 0.69 (0.10 - 4.44) | 0.45 (0.08 - 2.62) | 0.31 (0.02 - 4.37) |
| Tertile 2 | 0.56 (0.21 - 1.48) | 1.11 (0.29 - 4.22) | 0.41 (0.13 - 1.27) | 0.98 (0.17 - 5.53) |
| Tertile 3 (highest) | Reference | Reference | Reference | Reference |
| Grains diversity score | ||||
| Tertile 1 (lowest) | 0.85 (0.34 - 2.11) | 1.78 (0.35 - 8.96) | 0.97 (0.33 - 2.87) | 4.78 (0.50 - 45.52) |
| Tertile 2 | 0.81 (0.32 - 2.03) | 1.99 (0.39 - 10.07) | 0.82 (0.28 - 2.38) | 4.89 (0.51 - 46.28) |
| Tertile 3 (highest) | Reference | Reference | Reference | Reference |
| Vegetable diversity score | ||||
| Tertile 1 (lowest) | 1.91 (0.77 - 4.72) | 1.23 (0.38 - 3.92) | 2.64 (0.94 - 7.37) | 1.03 (0.23 - 4.58) |
| Tertile 2 | 1.59 (0.64 - 3.91) | 0.66 (0.19 - 2.28) | 2.21 (0.82 - 5.94) | 0.34 (0.06 - 1.83) |
| Tertile 3 (highest) | Reference | Reference | Reference | Reference |
| Fruit diversity score | ||||
| Tertile 1 (lowest) | 1.96 (0.44 - 8.73) | 1.22 (0.13 - 10.80) | 1.55 (0.29 - 8.24) | 1.77 (0.12 - 24.86) |
| Tertile 2 | 1.20 (0.48 - 3.02) | 1.27 (0.37 - 4.30) | 1.28 (0.45 - 3.60) | 1.38 (0.30 - 6.37) |
| Tertile 3 (highest) | Reference | Reference | Reference | Reference |
| Meat diversity score | ||||
| Tertile 1 (lowest) | 1.02 (0.43 - 2.44) | 0.35 (0.10 - 1.22) | 1.17 (0.40 - 3.39) | 0.74 (0.15 - 3.67) |
| Tertile 2 | 1.10 (0.53 - 2.31) | 0.60 (0.23 - 1.57) | 1.39 (0.60 - 3.20) | 1.22 (0.36 - 4.12) |
| Tertile 3 (highest) | Reference | Reference | Reference | Reference |
| Dairy diversity score | ||||
| Tertile 1 (lowest) | 6.89 (1.35 - 34.98)d | 3.35 (0.35 - 31.68) | 10.02 (1.70 - 59.13)d | 10.77 (0.50 - 32.18) |
| Tertile 2 | 5.04 (1.06 - 23.86)d | 3.54 (0.41 - 30.44) | 5.43 (1.03 - 28.72)d | 7.50 (0.33 - 67.51) |
| Tertile 3 (highest) | Reference | Reference | Reference | Reference |
| Boys (N = 219) | ||||
| Unadjusted Odds Ratio (95% CI) | Adjusted Odds Ratio (95% CI)b | |||
| Overweight | Obese | Overweight | Obese | |
| Total dietary diversity score | ||||
| Tertile 1 (lowest) | 0.91 (0.19 - 4.25) | 0.15 (0.02 - 0.89)d | 0.26 (0.03 - 2.02) | 0.12 (0.01 - 1.10) |
| Tertile 2 | 0.94 (0.31 - 2.81) | 0.32 (0.09 - 1.03) | 0.61 (0.16 - 2.27) | 0.30 (0.06 - 1.31) |
| Tertile 3 (highest) | Reference | Reference | Reference | Reference |
| Grains diversity score | ||||
| Tertile 1 (lowest) | 0.79 (0.28 - 2.25) | 2.31 (0.62 - 8.55) | 1.11 (0.32 - 3.78) | 3.16 (0.65 - 15.28) |
| Tertile 2 | 1.29 (0.46 - 3.59) | 3.36 (0.93 - 12.20) | 1.87 (0.56 - 6.19) | 5.84 (1.29 - 26.42)d |
| Tertile 3 (highest) | reference | reference | reference | reference |
| Vegetable diversity score | ||||
| Tertile 1 (lowest) | 0.97 (0.35 - 2.69) | 1.56 (0.50 - 4.82) | 1.43 (0.41 - 4.94) | 1.75 (0.40 - 7.62) |
| Tertile 2 | 1.03 (0.36 - 2.90) | 0.91 (0.27 - 3.01) | 1.66 (0.47 - 5.90) | 1.02 (0.21 - 4.87) |
| Tertile 3 (highest) | Reference | Reference | Reference | Reference |
| Fruit diversity score | ||||
| Tertile 1 (lowest) | 2.85 (0.65 - 12.56) | 2.66 (0.41 - 17.00) | 5.13 (0.87 - 30.06) | 1.65 (0.20 - 13.63) |
| Tertile 2 | 1.18 (0.44 - 3.11) | 1.71 (0.57 - 5.12) | 1.31 (0.41 - 4.19) | 0.98 (0.24 - 3.88) |
| Tertile 3 (highest) | Reference | Reference | Reference | Reference |
| Meat diversity score | ||||
| Tertile 1 (lowest) | 0.91 (0.33 - 2.52) | 0.99 (0.32 - 3.05) | 1.75 (0.52 - 5.93) | 1.12 (0.28 - 4.49) |
| Tertile 2 | 0.98 (0.43 - 2.21) | 0.92 (0.39 - 2.17) | 1.46 (0.54 - 3.99) | 0.86 (0.28 - 2.57) |
| Tertile 3 (highest) | Reference | Reference | Reference | Reference |
| Dairy diversity score | ||||
| Tertile 1 (lowest) | 1.57 (0.37 - 6.69) | 2.80 (0.65 - 12.03) | 1.32 (0.25 - 7.04) | 1.55 (0.23 - 10.07) |
| Tertile 2 | 1.06 (0.27 - 4.23) | 1.46 (0.37 - 5.78) | 0.65 (0.13 - 3.11) | 0.79 (0.13 - 4.84) |
| Tertile 3 (highest) | Reference | Reference | Reference | Reference |
Abbreviation, DDS: dietary diversity score.
aMultinomial logistic models comparing weight category to non-obese group/DDS tertiles (reference group for diversity score: highest tertile/for weight: thin and normal (as one group)).
bAdjusted for grade, birth order, family size, ethnicity, parents’ age and education, father job position, mother employment, other income source of family members, house ownership status, financial support source, energy and physical activity.
cAdditional adjusted for menstruation.
dSignificant at P < 0.05.
5. Discussion
The results showed that obese children consumed more energy compared with their thin and normal weight counterparts. The probability of obesity increased with more energy intake in boys which is consistent with most previous studies (21-23). Based on several studies (21, 24), increase in energy intake is one of the main risk factors of obesity, as excess energy consumed is stored by different tissues in the form of fat through hormonal and biochemical reactions (21, 24).
However, based on the findings, there was no significant relationship between the intake of macro-nutrients and the risk of obesity. The results of different studies in this field are inconsistent (21, 23). This may be due to the characteristics of the studied population and/or differences in methods of dietary intake and weight status assessment. Also, there was no significant association between weight status and daily food groups’ intake in the present study. In this regard, the literature has reported conflicting results. Some studies have shown a direct relationship between obesity and the consumption of breads and cereals (25, 26), and some have reported an inverse association between obesity and fruit and vegetable intake (27, 28). A study showed an inverse association between obesity and the consumption of red meat (27), while others (25, 26) have reported a positive association between these two. On the other hand, there are some reports indicating that obesity is positively associated with dairy products intake (26, 28), while others have shown an inverse relationship (27). These conflicting findings can be due to differences in participants’ socio-economic status, age groups, food patterns and methods of body weight and food intake assessment.
In the present study, no significant relationship between DDS and obesity was observed; however, when the association of DS with each food group was assessed, the probability of obesity was significantly higher in boys with medium grains DS and in girls with a low or medium dairy DS. Previous studies in this field have shown conflicting results (29-32). Studies by Mohajeri et al. (29) on 9-year-old children, Fernandez et al. (30) on preschool children and Savy et al. (31) on women aged 20 - 59 years, reported no significant association between BMI and DDS. This was also confirmed in a systematic review and meta-analysis (1). On the other hand, there are reports showing that individuals with more diversified diet, had higher odds of obesity (6, 8, 9), while Azadbakht et al. (7, 32) reported lower probability of obesity among those with higher DDS. In fact, the nature of the relationship between obesity and DDS is influenced by the type of food items consumed by individuals not just the number of items themselves (7, 32); for instance whether higher intake of grain products refer to refined breads/cereals or whole-grain products affects energy density of diet.
Based on the results of the present study, there was a higher risk of obesity in the low tertile of dairy DS. This may be attributed to high calcium content of dairy products (33, 34). Low calcium intake due to low consumption of dairy products stimulates 1,25-dihydroxyvitamin D3 production, causing adipocyte intracellular Ca2+ promotion; therefore, leads to rise in lipogenesis and decline in lipolysis. Consequently, it will bring about more fat mass and higher probability of obesity (35, 36). Moreover, the present study showed that lower grains DS can result in higher probability of obesity. The fact that the main source of grains and cereals in the studied children were white rice and white flat breads (refined grains) can explain the nature of this observation. It has been shown that whole grain products are among the low-energy-dense food groups and are inversely associated with obesity (17, 32), whereas refined grains and cereals with high glycemic index (15) can contribute to increased risk of obesity.
The difference observed between dietary intake and diet diversity of boys and girls calls the need for further investigation, as low DS of grains group in boys (37, 38) and dairy products in girls (39, 40) was related to higher risk of overweight/obesity. The reasons behind such differences can be defined by physiological, psychological and socio-cultural factors (41, 42) between the two genders and should be taken into account in designing future interventions aiming to promote dietary change.
To the best of our knowledge, this is the first study on the association between DDS and DS of individual food groups with obesity in school-aged children in Iran. Moreover, one of the strengths of the present study is taking into account a number of confounders (socioeconomic factors, total energy intake and physical activity) in reported models of logistic regression.
There are a number of limitations that need to be taken into consideration when evaluating the results of the present study. First, due to the cross-sectional nature of the study making any causal association is impossible. It is not clear whether such association will remain over time and in the process of growth and puberty. Second, this study was limited to children in the fifth and sixth grades and may not be generalizable to younger or older ages. Thirdly, the excluded data was quite large, although we found no significant difference in characteristics of dropout subjects with those remained in the study. Therefore, the use of a larger sample size in subsequent studies would be beneficial and could provide more reliable and generalizable results. After all, the socio-cultural and psychological influences of overweight/obesity were not examined in this study and can be considered a limitation in the analysis.
In conclusion, the findings reemphasize the importance of high energy intake and low dietary diversity in the risk of overweight and obesity among children and early adolescents. Such observations can guide the development of appropriate policies, recommendations and program options to assure healthy weight, healthy dietary intake in this age group. Future research is needed to examine the association between different aspects of dietary intake and weight status.