


1. Background
2. Objectives
3. Patients and Methods
3.1. Patient Population
3.2. Computed Tomography Technique
3.3. Radiological and Clinical Data Acquisition
3.4. Radiomics Feature Acquisition
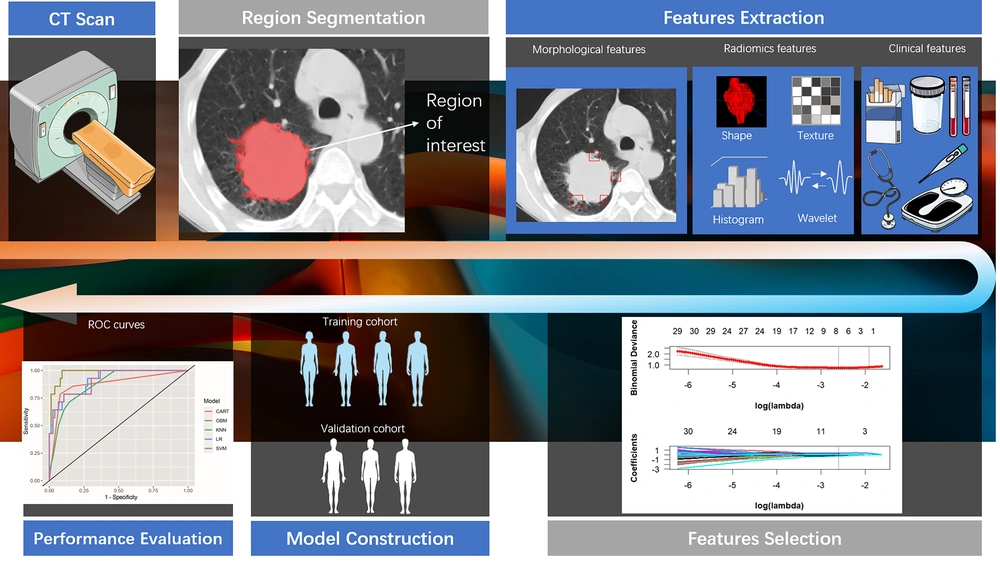
The flowchart for building the radiomics model
3.5. Development of Machine Learning Models
3.6. Statistical Analysis
4. Results
4.1. Patients’ Population and Radiological Characteristics
| Variables | Total (n = 90) | PIP (n = 76) | PSC (n = 14) | P-Value |
|---|---|---|---|---|
| Age (y) | 58.1 ± 9.2 | 57.3 ± 9.3 | 62.4 ± 7.2 | 0.030 |
| Sex | 0.056 | |||
| Female | 63 (70) | 50 (65.8) | 13 (92.9) | |
| Male | 27 (30) | 26 (34.2) | 1 (7.1) | |
| Smoking status | 0.009 | |||
| Never | 38 (42.2) | 37 (48.7) | 1 (7.1) | |
| Smoker | 52 (57.8) | 39 (51.3) | 13 (92.9) | |
| Prolonged fever | 0.027 | |||
| No | 77 (85.6) | 68 (89.5) | 9 (64.3) | |
| Yes | 13 (14.4) | 8 (10.5) | 5 (35.7) | |
| Cough history | 1.000 | |||
| No | 21 (23.3) | 18 (23.7) | 3 (21.4) | |
| Yes | 69 (76.7) | 58 (76.3) | 11 (78.6) | |
| Sputum | 0.573 | |||
| No | 35 (38.9) | 31 (40.8) | 4 (28.6) | |
| Yes | 55 (61.1) | 45 (59.2) | 10 (71.4) | |
| Bloody sputum | 0.058 | |||
| No | 61 (67.8) | 55 (72.4) | 6 (42.9) | |
| Yes | 29 (32.2) | 21 (27.6) | 8 (57.1) | |
| Hemoptysis | 0.286 | |||
| No | 72 (80) | 59 (77.6) | 13 (92.9) | |
| Yes | 18 (20) | 17 (22.4) | 1 (7.1) | |
| Pleural pain | 1.000 | |||
| No | 70 (77.8) | 59 (77.6) | 11 (78.6) | |
| Yes | 20 (22.2) | 17 (22.4) | 3 (21.4) | |
| Asymptomatic | 0.651 | |||
| No | 10 (11.1) | 8 (10.5) | 2 (14.3) | |
| Yes | 80 (88.9) | 68 (89.5) | 12 (85.7) | |
| Total white blood cell count | 6.6 (5.2, 9.3) | 6.6 (5.3, 9.2) | 6.6 (5, 10) | 0.881 |
Abbreviations: PSC, pulmonary sarcomatoid carcinoma; PIP, pulmonary inflammatory pseudotumor.
a Values are expressed as mean ± SD or No. (%) unless otherwise indicated.
| Variables | Total (n = 90) | PIP (n = 76) | PSC (n = 14) | P-Value |
|---|---|---|---|---|
| Location | 0.943 | |||
| Upper lobe | 49 (54.4) | 42 (55.3) | 7 (50) | |
| Middle lobe and lower lobe | 41 (45.6) | 34 (44.7) | 7 (50) | |
| Boundary of the lesion | 1.000 | |||
| Well-defined | 35 (38.9) | 30 (39.5) | 5 (35.7) | |
| Ill-defined | 55 (61.1) | 46 (60.5) | 9 (64.3) | |
| Lobulation sign | 0.084 | |||
| No | 48 (53.3) | 44 (57.9) | 4 (28.6) | |
| Yes | 42 (46.7) | 32 (42.1) | 10 (71.4) | |
| Burr signs | 1.000 | |||
| No | 64 (71.1) | 54 (71.1) | 10 (71.4) | |
| Yes | 26 (28.9) | 22 (28.9) | 4 (28.6) | |
| Vacuole sign | 0.841 | |||
| No | 44 (48.9) | 38 (50) | 6 (42.9) | |
| Yes | 46 (51.1) | 38 (50) | 8 (57.1) | |
| Air bronchial sign | 0.156 | |||
| No | 52 (57.8) | 41 (53.9) | 11 (78.6) | |
| Yes | 38 (42.2) | 35 (46.1) | 3 (21.4) | |
| Necrotic zone | 0.406 | |||
| No | 38 (42.2) | 34 (44.7) | 4 (28.6) | |
| Yes | 52 (57.8) | 42 (55.3) | 10 (71.4) | |
| Calcifications | 1.000 | |||
| No | 82 (91.1) | 69 (90.8) | 13 (92.9) | |
| Yes | 8 (8.9) | 7 (9.2) | 1 (7.1) | |
| Halo sign | 0.637 | |||
| No | 47 (52.2) | 41 (53.9) | 6 (42.9) | |
| Yes | 43 (47.8) | 35 (46.1) | 8 (57.1) | |
| Satellite lesions | 0.211 | |||
| No | 61 (67.8) | 49 (64.5) | 12 (85.7) | |
| Yes | 29 (32.2) | 27 (35.5) | 2 (14.3) | |
| Interlobular septal thickening | 0.133 | |||
| No | 61 (67.8) | 54 (71.1) | 7 (50) | |
| Yes | 29 (32.2) | 22 (28.9) | 7 (50) | |
| Pleural indentation | 0.005 | |||
| No | 68 (75.6) | 62 (81.6) | 6 (42.9) | |
| Yes | 22 (24.4) | 14 (18.4) | 8 (57.1) | |
| Pleural effusion | 0.483 | |||
| No | 71 (78.9) | 61 (80.3) | 10 (71.4) | |
| Yes | 19 (21.1) | 15 (19.7) | 4 (28.6) | |
| Mediastinal or hilar lymphadenopathy | < 0.001 | |||
| No | 63 (70) | 60 (78.9) | 3 (21.4) | |
| Yes | 27 (30) | 16 (21.1) | 11 (78.6) | |
| Maximum diameter of the lesion (mm) | 44.7 (38.2, 60.9) | 44.5 (38.2, 56.8) | 62 (40.2, 80.5) | 0.146 |
Abbreviations: PSC, pulmonary sarcomatoid carcinoma; PIP, pulmonary inflammatory pseudotumor.
a Values are expressed as No. (%) unless otherwise indicated.
4.2. Machine Learning Models and Performances
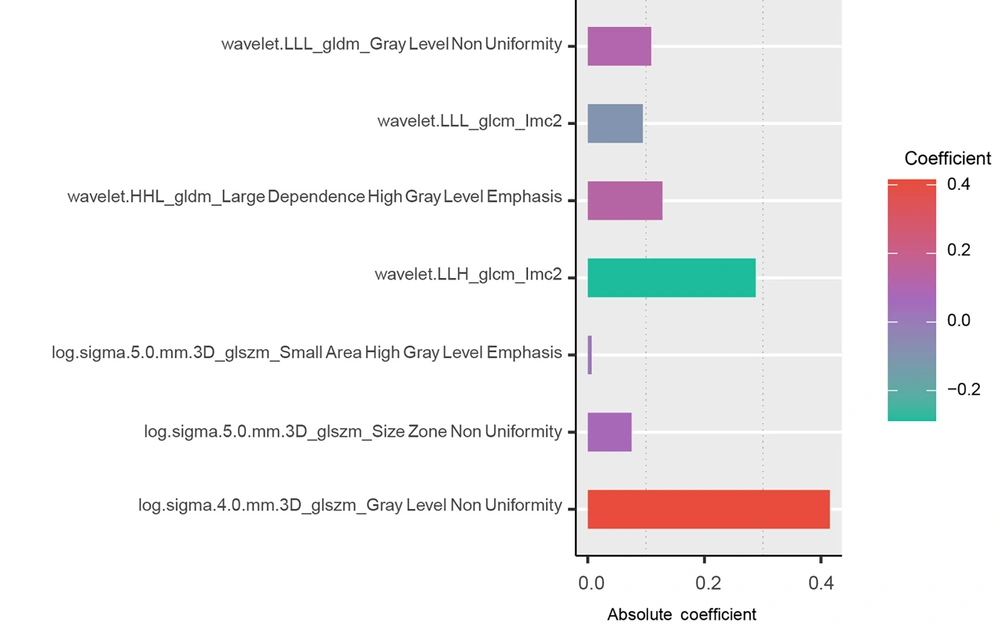
Radiomics features with nonzero coefficients remained via the least absolute shrinkage and selection operator.
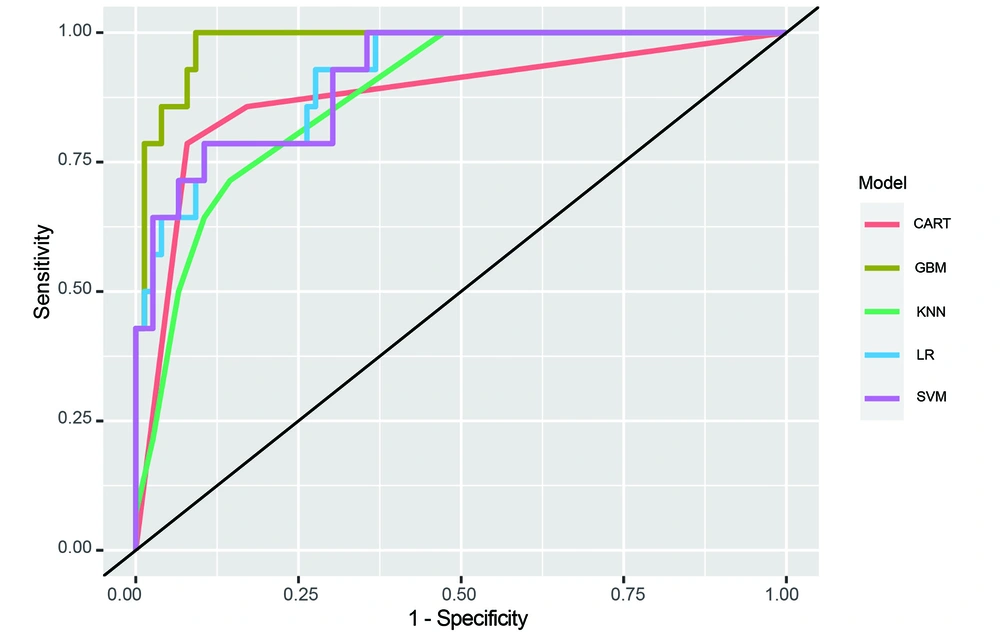
The receiver operating characteristic curves of all machine models
| Model | ACC | F1 Score | AUC | Log Loss |
|---|---|---|---|---|
| SVM | 0.878 | 0.938 | 0.914 | 0.273 |
| CART | 0.900 | 0.939 | 0.876 | 0.255 |
| GBM | 0.922 | 0.967 | 0.980 | 0.161 |
| KNN | 0.833 | 0.919 | 0.875 | 0.285 |
| LR | 0.878 | 0.942 | 0.915 | 0.242 |
Abbreviations: ACC, accuracy; AUC, area under the curve; SVM, support vector machine; CART, classification and regression trees; GBM, gradient boosting machine; KNN, k-nearest neighbors; LR, logistic regression.
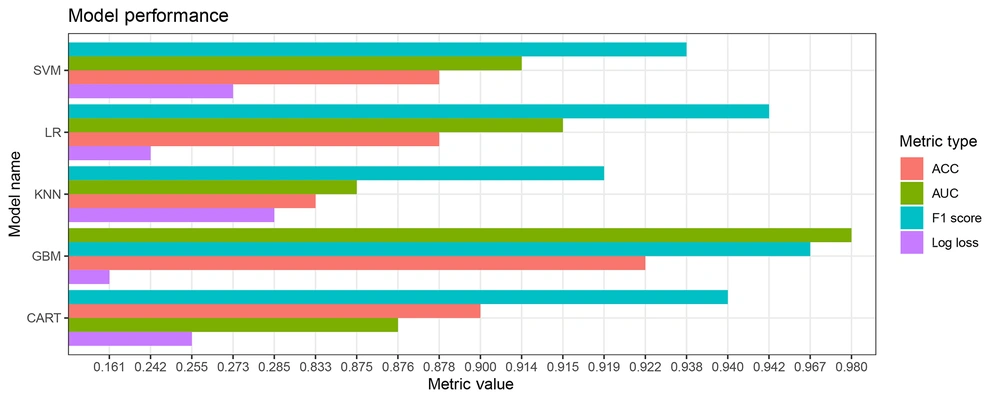
Diagnostic efficacy analysis of all machine models
4.3. Multivariable Logistic Regression Analysis for the Combined Model
| Variables | B | Wald | OR (95% CI) | P-Value |
|---|---|---|---|---|
| Age | 0.12 | 0.184 | 1.127 (0.676 ~ 3.108) | 0.668 |
| Smoking status | -0.149 | 0.001 | 0.862 (0 ~ 131) | 0.981 |
| Fever | 2.225 | 0.001 | 9.252 (0.044 ~ 1588.911) | 0.979 |
| Mediastinal or hilar lymphadenopathy | 8.034 | 1.287 | 3084.472 (4.468 ~ 10807) | 0.257 |
| Pleural indentation | 7.048 | 1.077 | 1150.752 (0.915 ~ 1541) | 0.299 |
| GBM model | 34.33 | 3.388 | 8.119 (3.761 ~ 9.079) | 0.006 |
Abbreviations: GBM, gradient boosting machine; OR, odds ratio.




