


1. Background
2. Objectives
3. Patients and Methods
| Characteristics | Frequency, No. | % |
|---|---|---|
| Sex | ||
| Female | 59 | 31.4 |
| Male | 129 | 68.6 |
| Tumor location | ||
| High | 18 | 9.6 |
| Low | 84 | 44.7 |
| Middle | 86 | 45.7 |
| Pathological vascular invasion | ||
| Negative | 153 | 81.4 |
| Positive | 35 | 18.6 |
| Pathological lymphatic invasion | ||
| Negative | 103 | 54.8 |
| Positive | 85 | 45.2 |
| Pathological perineural invasion | ||
| Negative | 129 | 68.6 |
| Positive | 59 | 31.4 |
| Reader1 T3 sub-staging | ||
| T3a | 10 | 5.3 |
| T3b | 81 | 43.1 |
| T3c | 92 | 48.9 |
| T3d | 5 | 2.7 |
| Reader2 T3 sub-staging | ||
| T3a | 2 | 1.1 |
| T3b | 89 | 47.3 |
| T3c | 94 | 50.0 |
| T3d | 3 | 1.6 |
aThe distribution of general population and the readings carried out by the two readers are shown in the table above. The obvious difference in T3a can be seen between the two readers.
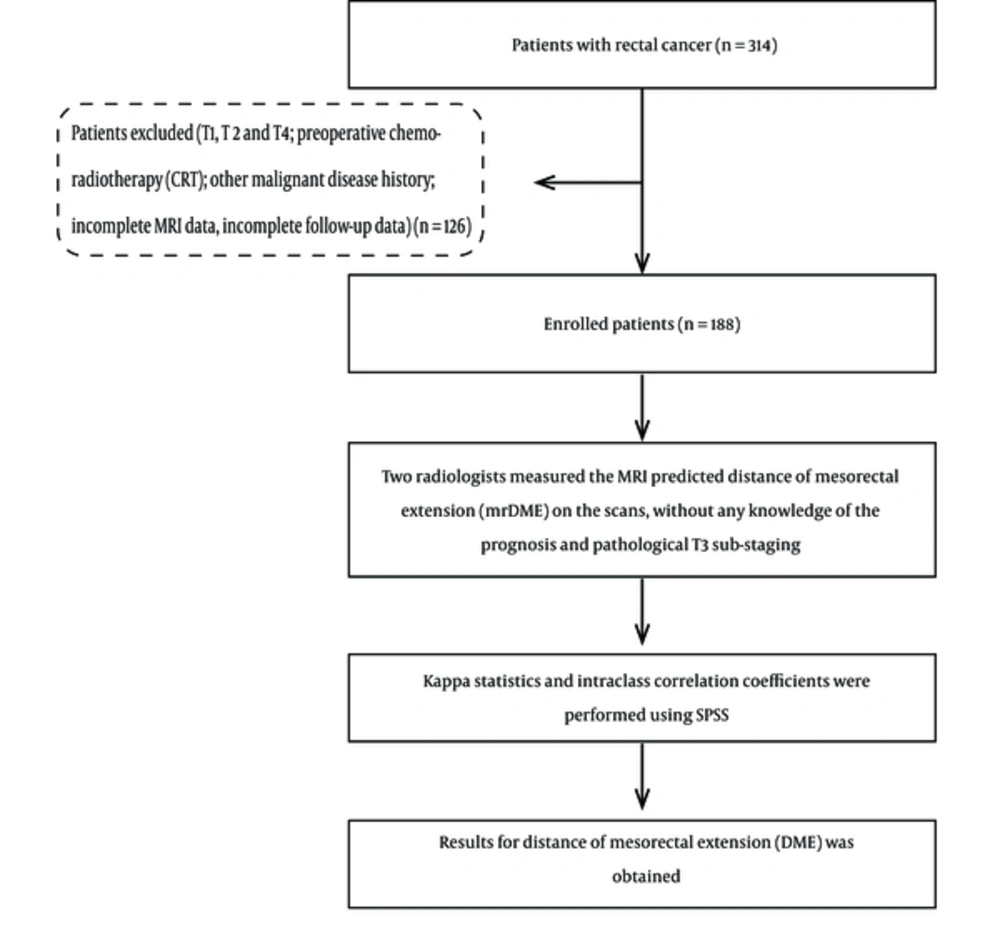
Flowchart of patints' enrollment, data collection and analysis.
3.1. MRI Method
| Sequence Key Features | Sagittal T2 TSE | ||
|---|---|---|---|
| VERIO 3.0 T | AVANTO 1.5 T | AERA 1.5 T | |
| Repetition time, ms | 3840 | 3000 | 5740 |
| Echo time, ms | 89.0 | 97 | 82.0 |
| Number of slices | 24 | 20 | 25 |
| FOV, mm | 280 | 200 | 280 |
| Base resolution | 320 | 320 | 320 |
| Slice thickness, mm | 5 | 4 | 4 |
| Phase FOV, % | 73.8 | 100 | 100 |
| Distance factor, % | 30 | 0 | 30 |
| Phase encode direction | A > > P | A > > P | H > > F |
| Phase resolution, % | 70 | 85 | 70 |
Abbreviations: FOV, field of view; T, Tesla; T2 TSE, T2-Weighted turbo spin-echo (TSE).
aThree different MRI machines were used for the pelvic imaging. No different machines were used in the same patients for both readers.
3.2. Magnetic Resonance Distance Predicted Mesorectal Extension Criteria (mrDME)
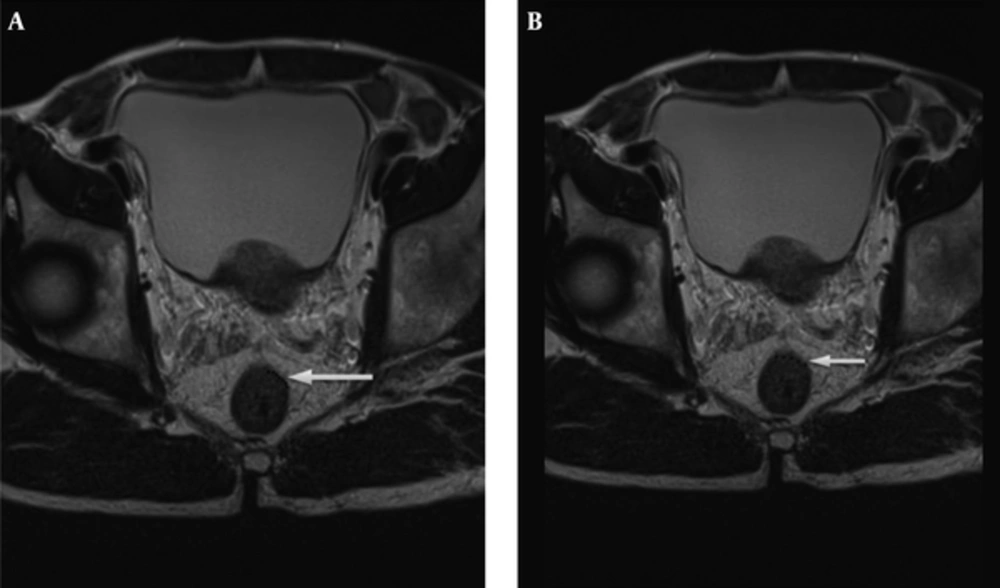
Tumor extension is seen beyond muscularis propria (hypointense signal in T2WI). A, The MRI-predicted distance of mesorectal extension (mrDME) measurement of the T3 rectal cancer by reader 1 was 0.81 mm (T3a), the area is shown by the white arrow. B, The mrDME measurement of the T3 rectal cancer by reader 2 was 1.6 mm (T3b); the white arrow shows the area. The black dots are the boundary from which the readers started their measurement.
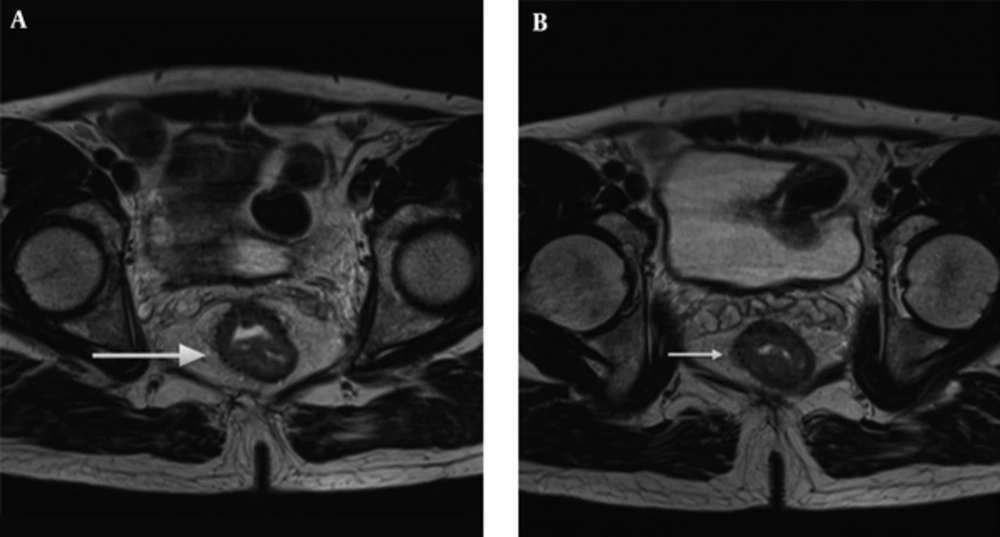
Tumor extension is seen beyond muscularis propria (hypointense signal in T2WI). A, The MRI-predicted distance of mesorectal extension (mrDME) measurement of the T3 rectal cancer by reader 1 was 3.8 mm (T3b), the area is shown by the white arrow. B, The mrDME measurement of the T3 rectal cancer by reader 2 was 5.1 mm (T3c); the white arrow shows the area. The black dots are the boundary from which the readers started their measurement.
3.3. Statistical Analysis
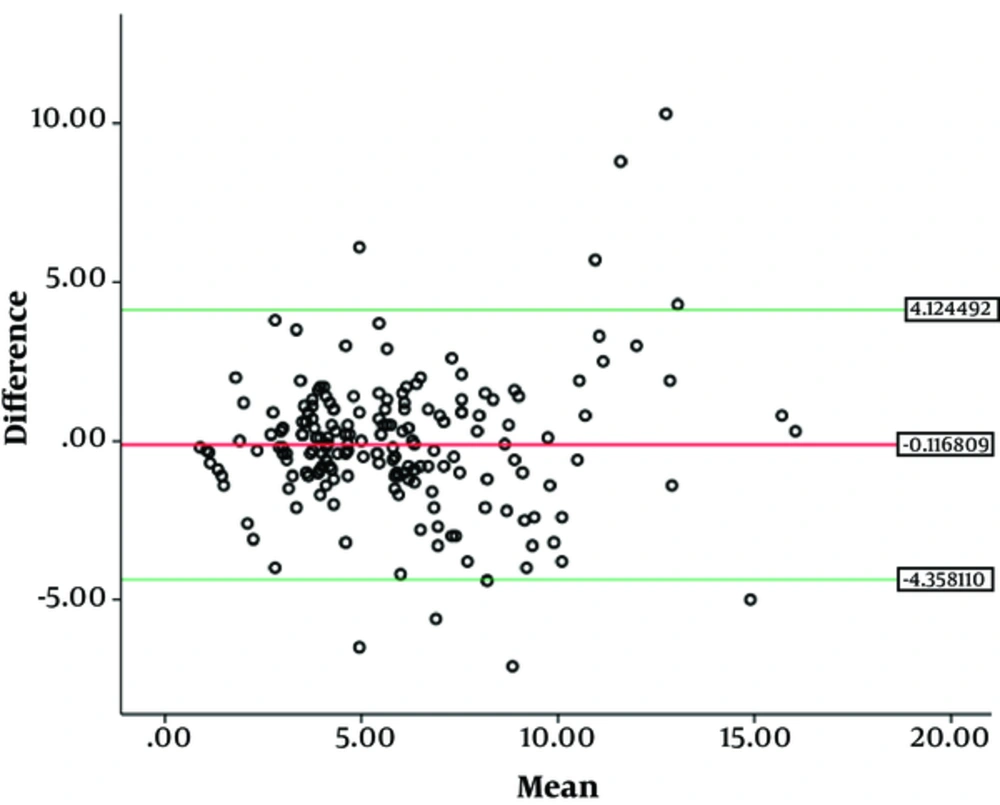
Bland-Altman plot between two readers to show reproducibility in T3 rectal cancer; (note: the red line denotes the mean value, green lines are upper and lower bounds of 95% confidence interval)
4. Results
4.1. Demographics
4.2. MRI Distance of Mesorectal Extension (mrDME)
4.3. ICC Between Two Groups in Two Readers
| Intraclass correlation coefficient (ICC) | 95% Confidence interval | P value | ||
|---|---|---|---|---|
| Lower Bound | Upper Bound | |||
| T3a vs. T3b vs. T3c vs. T3d | ||||
| Inter-observer | 0.772 | 0.706958 | 0.823824 | < 0.001 |
| Intra-observer | 0.786 | 0.724954 | 0.835336 | < 0.001 |
| T3ab vs. T3cd | ||||
| Inter-observer | 0.829 | 0.778038 | 0.868737 | < 0.001 |
| Intra-observer | 0.796 | 0.736777 | 0.842846 | < 0.001 |
| Parameter | Inter-Observer Kappa (k) | Intra-Observer Kappa (k) | P value |
|---|---|---|---|
| T3a vs. T3b vs. T3c vs. T3d | 0.700 | 0.718 | < 0.001 |
| T3ab vs. T3cd | 0.819 | 0.883 |
aObvious increase in the agreement between the two readers after combining two sub-stages can be seen. ICC and kappa (k) both increased after re-classifying four sub-stages into two sub-stages.
5. Discussion
5.1. Management for T3 Rectal Cancer
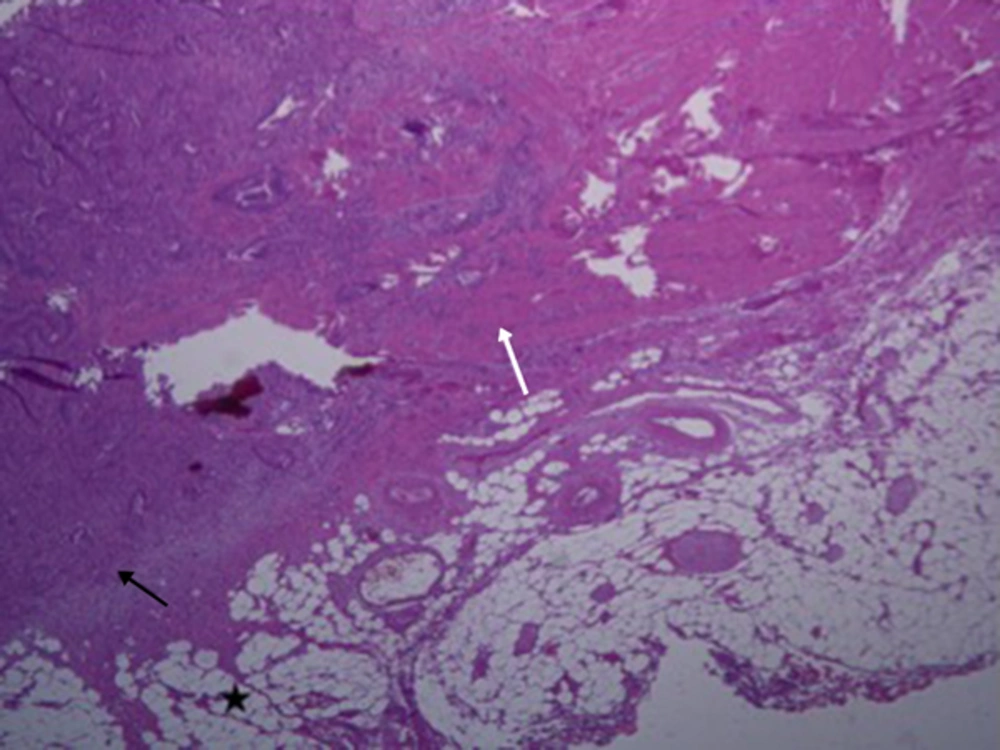
Tumor extension (histopathology). Tumor extension (black arrow) beyond the muscularis propria (white arrow) into the serosal fat (black star) can be seen; H & E, original magnification × 10.


