Is a CT Scan Reliable for Determining the Depth of Invasion in Patients with Oral Tongue Squamous Cell Carcinoma? An Original Study and Literature Review

Author(s):
Hashem SharifianHashem Sharifian1, Fahimeh AzizinikFahimeh AzizinikFahimeh Azizinik ORCID2,*, Moein MoradpourMoein Moradpour3, Zahra GhomiZahra Ghomi4, Javad EhteshamfarJavad Ehteshamfar5, Maryam LotfiMaryam Lotfi6, Sheida JavadiSheida Javadi7, Fatemeh Shakki KatouliFatemeh Shakki Katouli7, Jayran ZebardastJayran ZebardastJayran Zebardast ORCID8
1Department of Radiology, Advanced Diagnostic and Interventional Radiology Research Center (ADIR), Academic Tertiary Center Head and Neck Amir-Alam Hospital, Tehran University of Medical Sciences, Tehran, Iran
2Department of Radiology, Advanced Diagnostic and Interventional Radiology Research Center (ADIR), Academic Tertiary Center Head and Neck Amir-Alam Hospital and Yas Women Hospital Complex, Tehran University of Medical Sciences, Tehran, Iran
3Department of Radiology, Hospital of the University of Pennsylvania (HUP), University of Pennsylvania (UPenn) Philadelphia, PA 19104, Philadelphia, USA
4Department of Radiology, Shahid Beheshti University Hospital, Tehran, Iran
5Department of Radiology, Imam Khomeini Complex Hospital, Tehran, Iran
6Department of Pathology, Academic Tertiary Center Head and Neck Amir-Alam Hospital, Tehran, Iran
7Department of Radiology, Advanced Diagnostic and Interventional Radiology Research Center (ADIR), Tehran University of Medical Sciences, Tehran, Iran
8Advanced Diagnostic and Interventional Radiology Research Center (ADIR), Tehran University of Medical Sciences, Tehran, Iran
*Corresponding Author: Department of Radiology, Amir-Alam Hospital, Sa'adi Shomali Street, Darwazeh Doulat, Tehran, Iran. Email: [email protected]

IJ Radiology:Vol. 23, issue 1; e170881
Published online:Mar 29, 2026
Article type:Research Article
Received:Jan 25, 2026
Accepted:Mar 20, 2026
How to Cite:Sharifian H, Azizinik F, Moradpour M, Ghomi Z, Ehteshamfar J, et al. Is a CT Scan Reliable for Determining the Depth of Invasion in Patients with Oral Tongue Squamous Cell Carcinoma? An Original Study and Literature Review. I J Radiol. 2026;23(1):e170881. doi: https://doi.org/10.5812/iranjradiol-170881

Abstract

Background:

Depth of invasion (DOI) in oral tongue squamous cell carcinoma (OTSCC) is an important prognostic factor influencing tumor staging, surgical planning, and overall prognosis.

Objectives:

This study aimed to assess the correlation between computed tomography-based radiologic DOI (rDOI) and pathologic DOI (pDOI) and to evaluate the diagnostic accuracy of computed tomography-based rDOI, using pDOI as the gold standard.

Methods:

This retrospective, single-center diagnostic accuracy study included 60 consecutive eligible patients with biopsy-proven OTSCC who underwent preoperative contrast-enhanced computed tomography at an academic referral center between April 2022 and March 2023. Patients with recurrent tumors, prior head-and-neck radiotherapy, computed tomography artifacts precluding measurement, or missing pathological DOI were excluded. The index test, computed tomography-derived rDOI, was measured independently by two blinded radiologists with 5 and 20 years of head-and-neck imaging experience and compared with histopathological DOI as the reference standard, assessed by a dedicated head-and-neck pathologist blinded to imaging findings. The primary analysis evaluated agreement and diagnostic accuracy. Inter-reader reliability and the association between DOI and nodal involvement were prespecified secondary objectives.

Results:

Sixty patients were analyzed, including 35 men and 25 women, with a mean age of 54.0 ± 14.2 years. The mean pDOI was 10.71 ± 6.47 mm. Computed tomography systematically overestimated the pDOI by 1.12 mm for Radiologist 1 and by 2.19 mm for Radiologist 2. Lymph node involvement was present in 15 patients (25%), who had a significantly higher pDOI than those without lymph node involvement (14.13 vs. 8.91 mm; P = 0.002). Strong agreement was observed between pDOI and rDOI, particularly for DOI > 5 mm. For Radiologist 1, κ = 0.797 (95% CI: 0.69 - 0.91), Spearman's rho = 0.668 (95% CI: 0.53 - 0.77), and P < 0.001. For Radiologist 2, κ = 0.700 (95% CI: 0.59 - 0.81) and P < 0.001. For detecting DOI > 5 mm, computed tomography showed an area under the curve of 0.934 for Radiologist 1 and 0.921 for Radiologist 2, with sensitivity > 89% and specificity > 85%. Inter-reader agreement was excellent (κ = 0.838; 95% CI: 0.76 - 0.92; Spearman's rho = 0.945; P < 0.001) and was independent of patient sex or lymph node status.

Conclusions:

Computed tomography-based rDOI is a reliable and diagnostically accurate preoperative tool for OTSCC staging, particularly for tumors with DOI > 5 mm. It may serve as a useful preoperative surrogate estimate of DOI when surgical pathology is not yet available. Ultrasound may be more accurate for superficial lesions with DOI ≤ 5 mm.

1. Background

Oral tongue squamous cell carcinoma (OTSCC) is a major malignancy of the oral cavity, and the tongue is the most frequently involved oral cavity subsite in squamous cell carcinoma (1). Although tobacco and alcohol are established primary risk factors (2), other contributors include chronic irritation, poor oral hygiene, viral infection, occupational exposure, malnutrition, and genetic predisposition (3). Unlike oropharyngeal squamous cell carcinoma, a consistent etiological association between human papillomavirus (HPV) and OTSCC has not been clearly established (1).
The 8th edition of the American Joint Committee on Cancer (AJCC) and Union for International Cancer Control (UICC) staging systems incorporated DOI as a critical prognostic factor and a key determinant of T staging for OTSCC. DOI is strongly associated with cervical lymph node metastasis and decreased survival (4-7). DOI is defined as the distance from the basement membrane of the nearest normal mucosa to the deepest point of tumor invasion and is distinct from tumor thickness, which is measured from the surface (6, 7).
DOI thresholds of ≤ 5 mm, > 5 to ≤ 10 mm, and > 10 mm define T subcategories in oral cavity cancer (8), and DOI ≥ 4 mm is commonly used as the cutoff for elective neck dissection (9). Although pathologic DOI from surgical specimens remains the gold standard, some patients with OTSCC are not surgical candidates because of comorbidities or functional concerns. In such cases, imaging-derived DOI may be the only available preoperative measure (10, 11). Clinical examination alone is inaccurate for this purpose (11).
Computed tomography (CT) scan and magnetic resonance imaging (MRI) have both been reported to overestimate DOI by approximately 20% to 30% compared with histopathology (11, 12). Magnetic resonance imaging is often preferred for soft-tissue characterization but may be limited by motion artifacts and difficulty detecting superficial tumors (13).

2. Objectives

The primary objective of this study was to evaluate the correlation between CT-based rDOI and histopathologic pDOI and to assess the diagnostic accuracy of CT-based rDOI, using pDOI as the gold standard. As prespecified secondary objectives, we assessed the inter-reader reliability of CT-based rDOI measurements between 2 radiologists with different levels of experience and explored the relationship between DOI and cervical lymph node involvement as an exploratory secondary analysis.

3. Methods

3.1. Study Design and Participants

This retrospective, single-center diagnostic accuracy study was designed and reported in accordance with the Standards for Reporting of Diagnostic Accuracy Studies (STARD) 2015 guidelines. Patients with biopsy-proven OTSCC who underwent preoperative contrast-enhanced CT within 8 weeks before surgery at our academic referral center between April 2022 and March 2023 were eligible. All consecutive eligible patients during this period were included. The exclusion criteria were recurrent tumor at a previous surgical site, missing pDOI in the pathology report, prior head-and-neck radiotherapy, CT artifacts preventing DOI measurement, and invasion of adjacent structures, including the mandible or maxilla. Of 71 patients initially screened, 11 were excluded, including 3 with recurrent tumors, 2 with missing pDOI, 2 with previous radiotherapy, 2 with CT artifacts, and 2 with invasion of adjacent bone. Finally, 60 patients were included in the analysis. No other cases with missing or incomplete data were identified in the analyzed cohort. The study was approved by the institutional research ethics committee, and the principles of the Declaration of Helsinki were followed.

3.2. Sample Size Calculation

The sample size was calculated a priori using a reference Spearman correlation coefficient of r = 0.70 from comparable published studies (5), a 95% confidence level (Z1-α/2 = 1.96), and 80% statistical power (Zβ = 0.842). Using the formula:
n=((Z1-α2+Zβ)C)2+3
where C = 0.5 × ln[(1 + r)/(1 - r)], the minimum required sample size was estimated to be 55 patients. Sixty patients were enrolled to account for potential exclusions.

3.3. Computed Tomography Imaging Protocol
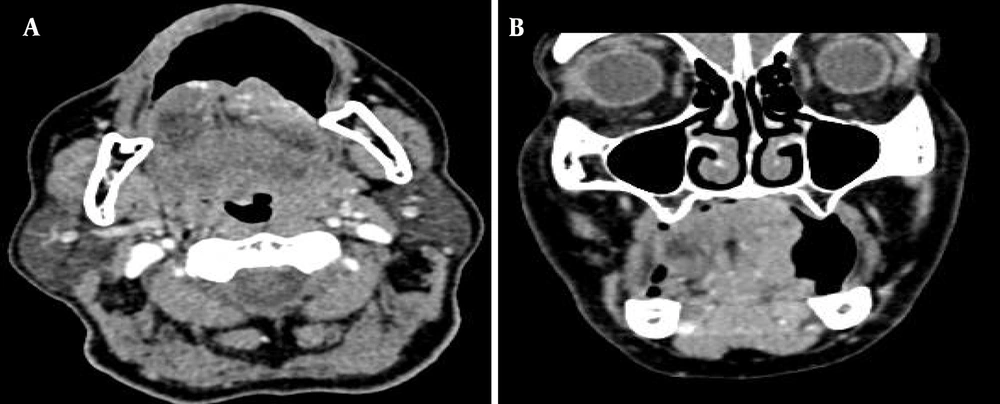
Patient demographic data, including age and sex, were obtained from medical records. Computed tomography was performed using a SIEMENS SOMATOM Emotion 16-slice scanner (Germany) with a standard contrast-enhanced head-and-neck protocol covering the inferior orbit to the superior mediastinum. Nonionic iodine contrast material (Idixanol/Visipaque 320 mgI/mL; GE Healthcare, Norway) was injected intravenously at 1.5 mL/kg, and scanning began 70 to 90 seconds after injection. The parameters were as follows: 110 kV, approximately 125 mA, 1-mm axial slice thickness, 220-mm field of view, and 0.7-mm coronal reconstructions. The puffed-cheek technique was used to maximize separation of the buccal mucosa and improve oral cavity visualization in patients with a poorly defined tumor surface (Figure 1). Images were stored in a picture archiving and communication system with a window width of 300 to 400 HU and a window level of 30 to 40 HU. Images were reviewed independently by 2 radiologists with 5 and 20 years of head-and-neck imaging experience, each blinded to the other’s measurements and to the pathology results.
The puffed-cheek technique was used in this patient with left lateral tongue squamous cell carcinoma to separate the buccal mucosa and improve visualization of the tumor surface, as shown in the axial (A) and coronal (B) planes of contrast-enhanced CT.
Figure 1.

The puffed-cheek technique was used in this patient with left lateral tongue squamous cell carcinoma to separate the buccal mucosa and improve visualization of the tumor surface, as shown in the axial (A) and coronal (B) planes of contrast-enhanced CT.

3.4. Depth of Invasion Measurement on Computed Tomography
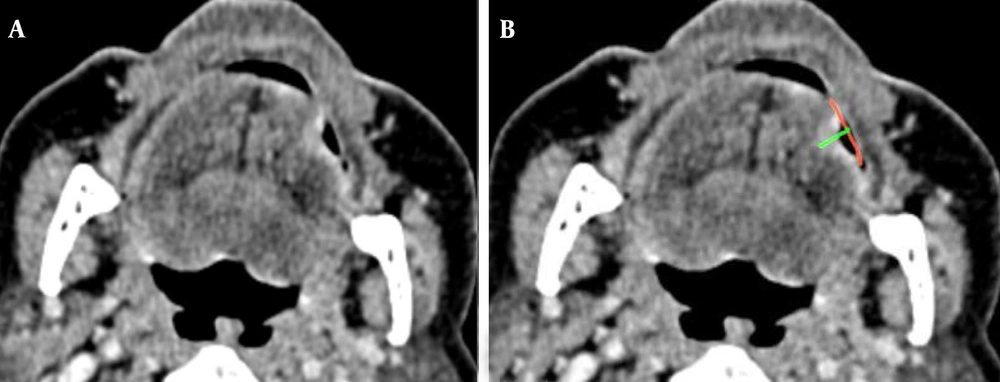
The reviewers examined axial, coronal, and sagittal series to identify the section showing the maximum tumor depth of invasion. Radiologic DOI was measured in millimeters as a perpendicular line from the imaginary reconstructed normal mucosal baseline to the deepest point of tumor invasion, regardless of exophytic or ulcerative components (Figures 2 and 3). For laterally located lesions, a virtual arc referencing the contour of the adjacent normal mucosa was used to establish the baseline (5). Representative 3-plane CT images with marked DOI measurements are shown in Figure 4.
Measurement of depth of invasion on the axial planes of contrast-enhanced computed tomography (A and B) in a 62-year-old man with oral tongue squamous cell carcinoma and an ulcerative tumor at the left lateral border of the tongue. The red virtual arc represents the reconstructed mucosal line joining the normal mucosal surface on the adjacent sides of the lesion. The green line shows tumor depth, measured perpendicularly from the deepest point to the reconstructed mucosal line without considering the ulcer surface.
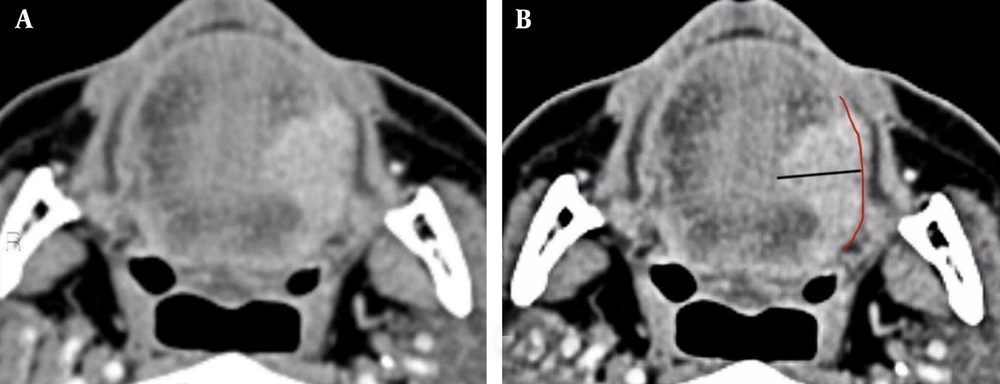
Figure 2.

Measurement of depth of invasion on the axial planes of contrast-enhanced computed tomography (A and B) in a 62-year-old man with oral tongue squamous cell carcinoma and an ulcerative tumor at the left lateral border of the tongue. The red virtual arc represents the reconstructed mucosal line joining the normal mucosal surface on the adjacent sides of the lesion. The green line shows tumor depth, measured perpendicularly from the deepest point to the reconstructed mucosal line without considering the ulcer surface.

Measurement of depth of invasion on the axial planes of contrast-enhanced computed tomography (A and B) in a 58-year-old man with oral tongue squamous cell carcinoma and a small exophytic component at the left lateral border of the tongue. The red line represents the reconstructed mucosal line joining the normal mucosal surface on the adjacent sides of the lesion. The black line shows tumor depth, measured perpendicularly from the deepest point to the reconstructed mucosal line, excluding the exophytic component.
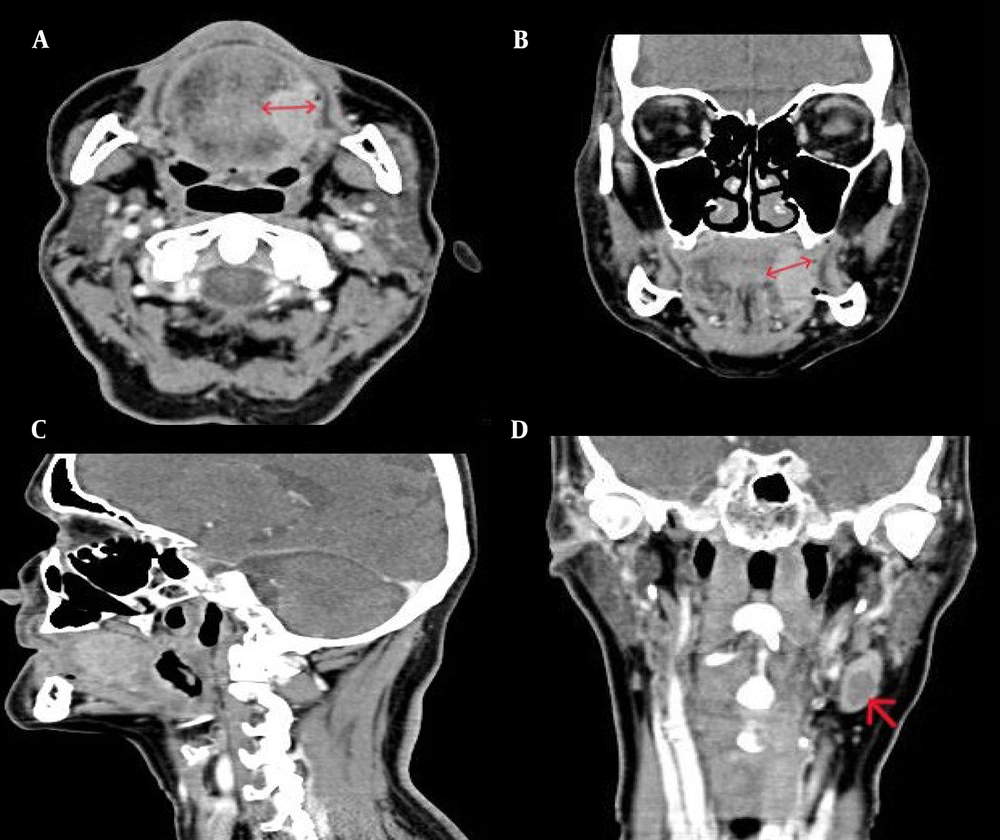
Figure 3.

Measurement of depth of invasion on the axial planes of contrast-enhanced computed tomography (A and B) in a 58-year-old man with oral tongue squamous cell carcinoma and a small exophytic component at the left lateral border of the tongue. The red line represents the reconstructed mucosal line joining the normal mucosal surface on the adjacent sides of the lesion. The black line shows tumor depth, measured perpendicularly from the deepest point to the reconstructed mucosal line, excluding the exophytic component.

Contrast-enhanced computed tomography of a 60-year-old man with lateral tongue squamous cell carcinoma. Red lines indicate rDOI measurement in the axial (A) and coronal (B) planes: a perpendicular line from the proposed normal mucosal baseline to the deepest point of tumor invasion. In this case, the measurement was approximately 17 mm in both coronal and axial planes; however, the plane showing the greatest DOI is preferred for measurement. The sagittal plane (C) is not representative of maximum DOI in laterally located tongue squamous cell carcinoma. pDOI = 16 mm; rDOI by Radiologist 1 = 17 mm; rDOI by Radiologist 2 = 17.5 mm. The red arrow in the coronal plane (D) shows necrotic lymphadenopathy at level II of the left cervical chain in the same patient.
Figure 4.

Contrast-enhanced computed tomography of a 60-year-old man with lateral tongue squamous cell carcinoma. Red lines indicate rDOI measurement in the axial (A) and coronal (B) planes: a perpendicular line from the proposed normal mucosal baseline to the deepest point of tumor invasion. In this case, the measurement was approximately 17 mm in both coronal and axial planes; however, the plane showing the greatest DOI is preferred for measurement. The sagittal plane (C) is not representative of maximum DOI in laterally located tongue squamous cell carcinoma. pDOI = 16 mm; rDOI by Radiologist 1 = 17 mm; rDOI by Radiologist 2 = 17.5 mm. The red arrow in the coronal plane (D) shows necrotic lymphadenopathy at level II of the left cervical chain in the same patient.

3.5. Pathological Assessment as the Reference Standard

Hematoxylin and eosin-stained slides were reviewed by a dedicated head-and-neck pathologist with 12 years of experience, who was blinded to radiological findings. Pathologic DOI was measured from the basement membrane of the nearest morphologically normal epithelium to the deepest invasive tumor cells, according to the AJCC Cancer Staging Manual, 8th edition, and the College of American Pathologists protocol for examination of specimens from patients with carcinomas of the lip and oral cavity.

3.6. Blinding Procedures and Outcomes

The 2 radiologists performed rDOI measurements independently, each blinded to the other’s measurements and to all pathological results. The head-and-neck pathologist was blinded to imaging findings. The primary outcome was the diagnostic accuracy of CT-based rDOI for detecting pDOI > 5 mm, including area under the curve (AUC), sensitivity, specificity, positive predictive value (PPV), and negative predictive value (NPV). The prespecified secondary outcomes were inter-reader agreement, assessed using kappa and intraclass correlation coefficient (ICC), between the 2 radiologists and agreement between rDOI and pDOI across DOI strata. The association between DOI and cervical lymph node involvement was a prespecified exploratory outcome.

3.7. Statistical Analysis

Continuous variables are reported as mean ± standard deviation (SD), and categorical variables are reported as frequency and percentage. Normality was assessed using the Shapiro-Wilk test. Between-group differences in continuous variables were evaluated using the independent-samples t-test or the Mann-Whitney U test, as appropriate. Categorical variables were compared using the chi-square test or Fisher exact test. Cohen’s kappa, linearly weighted for ordinal categories, and Spearman’s rho were used to assess agreement and correlation between pDOI and rDOI. To supplement these measures, Bland-Altman analysis was performed to evaluate systematic bias and limits of agreement between CT-derived rDOI and pDOI. Intraclass correlation coefficients were additionally calculated using a 2-way mixed model with absolute agreement as a more appropriate metric for agreement between continuous measurements. All kappa and rho values are reported with 95% confidence intervals (CIs). Kappa CIs were calculated using the asymptotic standard error method, and Spearman rho CIs were calculated using Fisher’s Z transformation. Diagnostic accuracy measures, including sensitivity, specificity, PPV, NPV, and AUC with 95% CIs, were calculated using a clinically relevant binary threshold of DOI > 5 mm, corresponding to the AJCC 8th edition T-stage boundary. Confidence intervals for sensitivity, specificity, PPV, and NPV were derived using the exact binomial method, and AUC CIs were calculated using DeLong’s method. Multivariable linear regression analysis was performed with mean rDOI as the dependent variable and pDOI, patient age, sex, and lymph node involvement as independent variables. Before multivariable analysis, the assumptions of linear regression were assessed and confirmed to be acceptable: linearity was verified by visual inspection of partial regression plots, homoscedasticity by the Breusch-Pagan test, normality of residuals by the Shapiro-Wilk test on regression residuals, and multicollinearity by variance inflation factor, with VIF < 5 for all predictors. Subgroup analyses for DOI ≤ 5 mm and DOI > 5 mm were considered exploratory because of the limited number of patients in some strata. Statistical analysis was performed using SPSS version 23.0 (IBM, Armonk, NY, USA) and MedCalc version 20.0 (MedCalc Software, Ostend, Belgium). P ≤ 0.05 was considered statistically significant.

4. Results

4.1. Patient Demographics

Sixty patients with confirmed tongue squamous cell carcinoma were included: 35 men (58.3%) and 25 women (41.7%). The mean age was 54.0 ± 14.2 years (range, 22 - 78 years). Full demographic and clinical characteristics are presented in Table 1. Mean pDOI did not differ significantly between sexes (men: 10.18 ± 6.21 mm; women: 11.36 ± 6.59 mm; P = 0.512). Lymphadenopathy was pathologically confirmed in 15 patients (25.0%) and was significantly more frequent in men (12/35, 34.3%) than in women (3/25, 12.0%) (P = 0.049).
Table 1.Demographic and Clinical Characteristics of Study Patients (N = 60) a
CharacteristicsTotal (n = 60)Male (n = 35)Female (n = 25)
Age (y)54.0 ± 14.253.1 ± 13.855.3 ± 14.9
Age range (y)22 - 7824 - 7622 - 78
Lymph node involvement15 (25.0)12 (34.3)3 (12.0)
pDOI (mm)10.71 ± 6.4710.18 ± 6.2111.36 ± 6.59
rDOI Radiologist 1 (mm)11.83 ± 5.5111.40 ± 5.2012.45 ± 5.90
rDOI Radiologist 2 (mm)12.90 ± 6.2212.30 ± 5.9513.80 ± 6.60
P value for sex difference in pDOI0.512

a Values are expressed as mean ± SD or No. (%) unless otherwise indicated. Abbreviations: LN, lymph node; pDOI, pathologic depth of invasion; rDOI, radiologic depth of invasion; R1, Radiologist 1; R2, Radiologist 2; SD, standard deviation.

4.2. Depth of Invasion Values by Measurement Method

Mean DOI values stratified by DOI group and measurement method are presented in Table 2. The overall mean pDOI was 10.71 ± 6.47 mm. The mean rDOI was 11.83 ± 5.51 mm for Radiologist 1 and 12.90 ± 6.22 mm for Radiologist 2, corresponding to CT overestimation of 1.12 mm and 2.19 mm, respectively.
Table 2.Comparison Between pDOI and rDOI Within Each DOI Group a
DOI GroupsValuespDOIrDOI R1rDOI R2P-Value
0 - 5 mm12 (20.0)3.8 ± 1.14.9 ± 1.45.2 ± 1.60.072
6 - 10 mm24 (40.0)8.2 ± 1.49.4 ± 1.810.1 ± 2.00.041
11 - 20 mm21 (35.0)14.6 ± 2.815.9 ± 3.117.0 ± 3.4< 0.001
21 - 30 mm2 (3.3)24.5 ± 2.125.8 ± 2.427.2 ± 2.80.083
> 30 mm1 (1.7)33.034.536.0
Overall60 (100)10.71 ± 6.4711.83 ± 5.5112.90 ± 6.22

a Values are expressed as No. (%) or mean ± SD. Abbreviations: pDOI, pathologic depth of invasion; rDOI, radiologic depth of invasion; R1, Radiologist 1; R2, Radiologist 2; SD, standard deviation. The P value refers to the comparison between pDOI and mean rDOI within each DOI stratum.

4.3. Correlation Between rDOI and pDOI

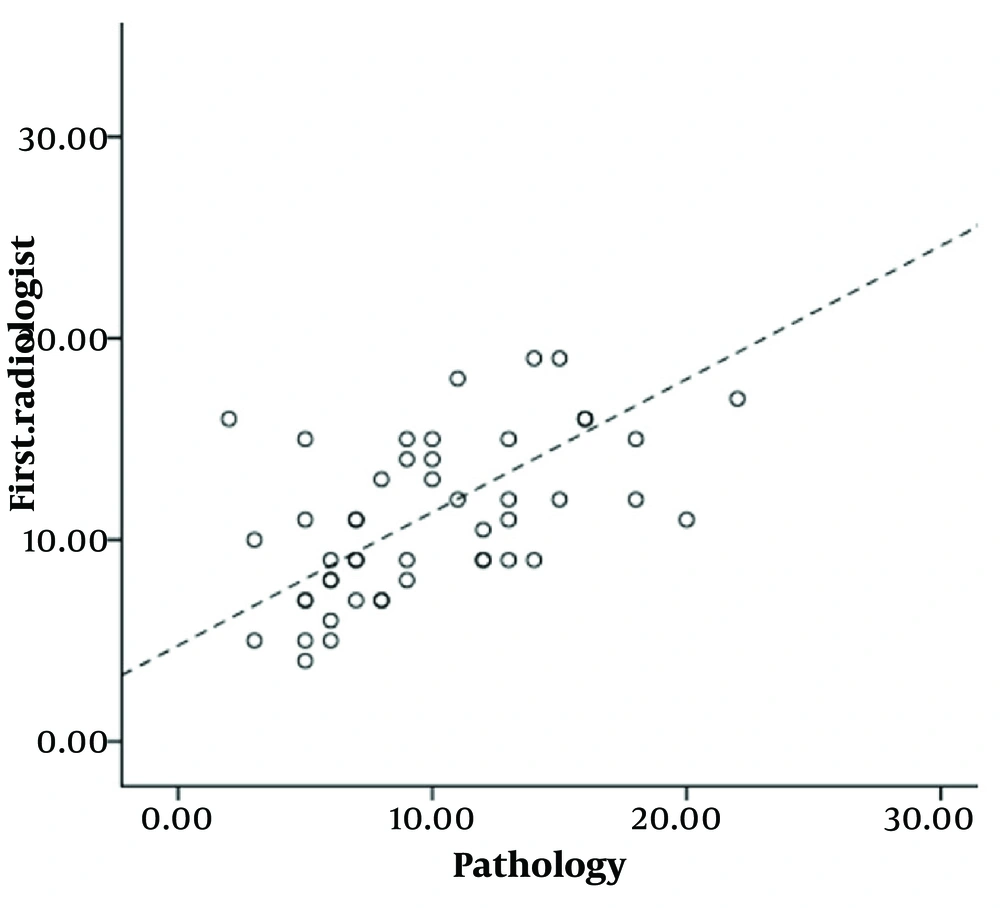
A strong and significant correlation and agreement were observed between rDOI and pDOI, particularly for DOI > 5 mm (Figures 5 and 6). For Radiologist 1, κ = 0.797 (95% CI: 0.69 - 0.91), Spearman's rho = 0.668 (95% CI: 0.53 - 0.77), and P < 0.001. For Radiologist 2, κ = 0.700 (95% CI: 0.59 - 0.81), Spearman's rho = 0.658 (95% CI: 0.52 - 0.76), and P < 0.001. Agreement was moderate for DOI ≤ 5 mm (Radiologist 1: κ = 0.615; Radiologist 2: κ = 0.568) (Table 3 and 4). The diagnostic performance of CT-based rDOI was stratified by pathologic DOI thresholds of ≤ 5 mm and > 5 mm. Agreement between pDOI and rDOI was substantial to excellent across all subgroups, with superior concordance in the DOI > 5 mm cohort (Radiologist 1: κ = 0.797; Radiologist 2: κ = 0.700). Conversely, although agreement remained statistically significant for tumors with DOI ≤ 5 mm (Radiologist 1: κ = 0.615, P = 0.018; Radiologist 2: κ = 0.568, P = 0.041), the lower kappa and rho values indicate greater variability in CT measurements for superficial lesions. This pattern highlights the inherent technical challenges of assessing minimal tumor invasion on cross-sectional imaging and supports the use of complementary modalities for superficial staging.
Table 3.Cohen Kappa, Spearman Rho, and Intraclass Correlation Coefficient Between pDOI and rDOI for Radiologist 1 by Subgroup a
SubgroupsΚκ 95% CIrsrs 95% CIP-ValueICC (95% CI)
All patients (n = 60)0.7970.69 - 0.910.6680.53 - 0.77< 0.0010.659 (0.49 - 0.78)
Males (n = 35)0.8040.70 - 0.910.7400.59 - 0.84< 0.0010.728 (0.53 - 0.85)
Females (n = 25)0.7910.65 - 0.930.7910.62 - 0.90< 0.0010.786 (0.57 - 0.90)
LN involvement (n = 15)0.8300.70 - 0.960.8930.74 - 0.96< 0.0010.885 (0.69 - 0.96)
No LN involvement (n = 45)0.6400.50 - 0.780.5300.30 - 0.72< 0.0010.528 (0.28 - 0.71)
DOI > 5 mm (n = 48)0.7970.69 - 0.910.6680.53 - 0.77< 0.0010.666 (0.47 - 0.80)
DOI ≤ 5 mm (n = 12)0.6150.44 - 0.790.6670.20 - 0.890.0180.648 (0.15 - 0.88)

a Abbreviation: LN, lymph node.

Table 4.Cohen Kappa, Spearman Rho, and Intraclass Correlation Coefficient Between pDOI and rDOI for Radiologist 2 by Subgroup a
Subgroupsκκ 95% CIrsrs 95% CIP-ValueICC (95% CI)
All patients (n = 60)0.7000.59 - 0.810.6580.52 - 0.76< 0.0010.657 (0.49 - 0.78)
Males (n = 35)0.6890.56 - 0.820.6380.47 - 0.77< 0.0010.637 (0.39 - 0.80)
Females (n = 25)0.8460.71 - 0.980.8460.68 - 0.93< 0.0010.846 (0.68 - 0.93)
LN involvement (n = 15)0.9170.80 - 1.000.9200.79 - 0.97< 0.0010.918 (0.77 - 0.97)
No LN involvement (n = 45)0.6400.49 - 0.790.6310.41 - 0.79< 0.0010.631 (0.42 - 0.78)
DOI > 5 mm (n = 48)0.7000.59 - 0.810.6580.52 - 0.76< 0.0010.658 (0.46 - 0.79)
DOI ≤ 5 mm (n = 12)0.5680.38 - 0.760.5970.04 - 0.870.0410.557 (0.01 - 0.85)

a Abbreviation: LN, lymph node.

Scatter plot showing the correlation between pDOI measured by pathology and rDOI measured by Radiologist 1.
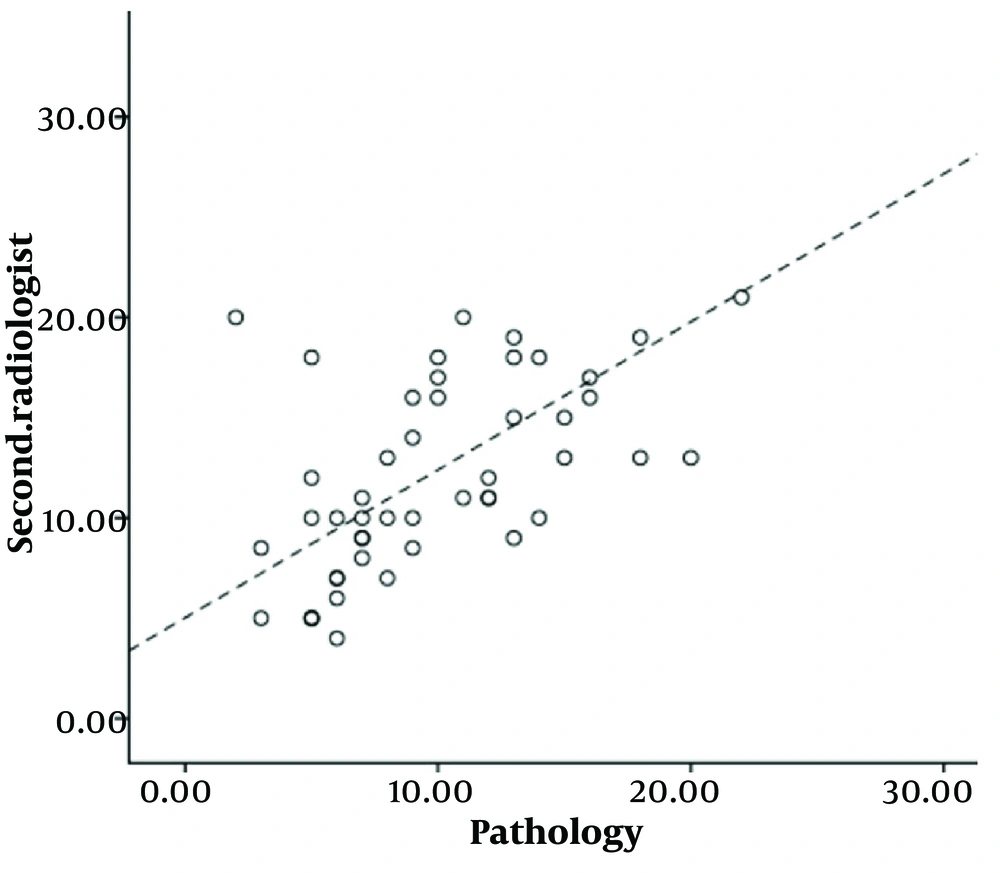
Figure 5.

Scatter plot showing the correlation between pDOI measured by pathology and rDOI measured by Radiologist 1.

Scatter plot showing the correlation between pDOI measured by pathology and rDOI measured by Radiologist 2.
Figure 6.

Scatter plot showing the correlation between pDOI measured by pathology and rDOI measured by Radiologist 2.

Bland-Altman analysis confirmed systematic CT scan overestimation of pDOI. The mean bias was 1.12 mm for Radiologist 1 (95% limits of agreement: -3.84 to 6.08 mm) and 2.19 mm for Radiologist 2 (95% limits of agreement: -4.12 to 8.50 mm), indicating that CT consistently yielded higher values than histopathology, particularly for Radiologist 2. Intraclass correlation coefficients between rDOI and pDOI, calculated using a 2-way mixed model with absolute agreement, were excellent: ICC = 0.891 (95% CI: 0.82 - 0.93) for Radiologist 1 and ICC = 0.863 (95% CI: 0.78 - 0.92) for Radiologist 2 (Table 5). The inter-reader ICC between Radiologist 1 and Radiologist 2 was also excellent (ICC = 0.947; 95% CI: 0.91 - 0.97). These results confirm strong absolute agreement between CT-derived rDOI and pDOI while acknowledging the systematic overestimation inherent to cross-sectional imaging.
Table 5.Bland-Altman Analysis and Intraclass Correlation Coefficients Between rDOI R1, rDOI R2, and pDOI a
ComparisonsMean Bias (mm)95% LoA (mm)ICCICC 95% CI
rDOI R1 vs. pDOI+1.12-3.84 to 6.080.8910.82 - 0.93
rDOI R2 vs. pDOI+2.19-4.12 to 8.500.8630.78 - 0.92
rDOI R1 vs. rDOI R2 (inter-reader)+1.07-2.18 to 4.320.9470.91 - 0.97

a Abbreviations: ICC, intraclass correlation coefficient, calculated using a 2-way mixed model with absolute agreement; LoA, limits of agreement by Bland-Altman analysis; pDOI, pathologic depth of invasion; rDOI, radiologic depth of invasion; R1, Radiologist 1; R2, Radiologist 2.

4.4. Diagnostic Accuracy of Computed Tomography-Based rDOI

Diagnostic accuracy measures are presented in Tables 6 and 7. For detecting pDOI > 5 mm, CT demonstrated higher accuracy. For Radiologist 1, AUC = 0.934 (95% CI: 0.85 - 0.98), sensitivity = 91.4%, specificity = 87.5%, PPV = 93.1%, and NPV = 84.0%. For Radiologist 2, AUC = 0.921 (95% CI: 0.84 - 0.97), sensitivity = 89.7%, specificity = 85.0%, PPV = 92.0%, and NPV = 80.8%.
Table 6.Diagnostic Accuracy of Computed Tomography-Based rDOI for Detecting Pathologically Confirmed DOI > 5 Mm a
Accuracy MeasuresR1R1 95% CIR2R2 95% CI
Sensitivity91.482.3 - 96.889.780.1 - 95.8
Specificity87.574.8 - 95.385.072.0 - 93.4
PPV93.184.5 - 97.792.082.4 - 97.4
NPV84.070.9 - 93.580.867.5 - 91.1
AUC (ROC)0.9340.85 - 0.980.9210.84 - 0.97
Overall accuracy89.979.8 - 96.287.877.4 - 94.7

a Values are expressed as percentage except AUC (ROC). Abbreviations: AUC, area under the receiver operating characteristic curve; NPV, negative predictive value; PPV, positive predictive value; ROC, receiver operating characteristic; R1, Radiologist 1; R2, Radiologist 2.

Table 7.Diagnostic Accuracy of Computed Tomography-Based rDOI for Detecting Pathologically Confirmed DOI ≤ 5 Mm a
Accuracy MeasuresR1R1 95% CIR2R2 95% CI
Sensitivity66.729.9 - 92.555.621.2 - 86.3
Specificity92.579.6 - 98.490.276.9 - 97.3
PPV66.729.9 - 92.562.524.5 - 91.5
NPV92.579.6 - 98.488.174.4 - 96.0
AUC (ROC)0.7960.65 - 0.900.7290.58 - 0.85
Overall accuracy88.075.7 - 95.584.070.9 - 92.8

a Values are expressed as percentage except AUC (ROC). Abbreviations: AUC, area under the receiver operating characteristic curve; NPV, negative predictive value; PPV, positive predictive value; ROC, receiver operating characteristic; R1, Radiologist 1; R2, Radiologist 2.

4.5. Inter-Reader Agreement

Inter-reader agreement was excellent overall (κ = 0.838; 95% CI: 0.76 - 0.92; Spearman's rho = 0.945; 95% CI: 0.91 - 0.97; P < 0.001). The inter-reader ICC was also excellent at 0.947 (95% CI: 0.91 - 0.97). Agreement remained high and was independent of patient sex or lymph node status. Full inter-reader data are presented in Table 8.
Table 8.Inter-Reader Agreement Between Radiologist 1 and Radiologist 2 by Subgroup, Including Intraclass Correlation Coefficient a
SubgroupsΚΚ 95% CIrsrs 95% CIP-ValueICC (95% CI)
All patients (n = 60)0.8380.76 - 0.920.9450.91 - 0.97< 0.0010.906 (0.85 - 0.94)
Males (n = 35)0.8400.75 - 0.930.9400.90 - 0.97< 0.0010.907 (0.82 - 0.95)
Females (n = 25)0.8500.74 - 0.960.9500.90 - 0.98< 0.0010.900 (0.79 - 0.95)
LN involvement (n = 15)0.9170.80 - 1.000.9710.92 - 0.99< 0.0010.951 (0.86 - 0.98)
No LN involvement (n = 45)0.8200.72 - 0.920.9390.89 - 0.97< 0.0010.879 (0.79 - 0.93)

a Abbreviations: ICC, intraclass correlation coefficient; LN, lymph node; rs, Spearman's rho.

Inter-reader agreement between Radiologist 1 and Radiologist 2 remained consistently high across all patient strata (Table 8). Stratification by lymph node involvement demonstrated excellent concordance in both lymph-node-positive (R2 = 0.971) and lymph-node-negative (R2 = 0.939) subgroups. The high degree of inter-reader reliability was independent of nodal status (all P < 0.001), suggesting that the CT-based rDOI measurement protocol is highly reproducible.

4.6. Lymph Node Involvement

Mean pDOI was significantly higher in patients with lymph node involvement than in those without lymph node involvement (14.13 ± 8.78 mm vs. 8.91 ± 4.46 mm; P = 0.002) (Figure 4D).

4.7. Multivariable Analysis

To determine whether the rDOI-pDOI association remained robust after adjustment for clinical covariates and, specifically, to assess whether CT overestimation of pDOI varied systematically across patient subgroups defined by age, sex, or lymph node status, multivariable linear regression was performed using the enter method. This question is conceptually distinct from the primary agreement analyses, including kappa, Spearman rho, Bland-Altman analysis, and ICC, which describe overall agreement without covariate adjustment. The model used mean rDOI, calculated as the average of Radiologist 1 and Radiologist 2 measurements, as the dependent variable, with pDOI, patient age, sex, and lymph node involvement as independent variables. All regression assumptions were confirmed to be acceptable before analysis: linearity by visual inspection of partial regression plots, homoscedasticity by the Breusch-Pagan test, normality of residuals by the Shapiro-Wilk test, and multicollinearity by variance inflation factor, with VIF < 5 for all predictors.
Multivariable linear regression confirmed that pDOI was the only significant independent predictor of rDOI (β = 0.87; 95% CI: 0.79 - 0.95; P < 0.001) after adjustment for patient age, sex, and lymph node involvement, none of which reached statistical significance (age: P = 0.519; sex: P = 0.617; lymph node involvement: P = 0.384) (Table 9). The model demonstrated high explanatory power (R2 = 0.792; F(4, 55) = 52.1; P < 0.001), indicating that pDOI accounted for approximately 79% of the variance in rDOI. Critically, the absence of significant interactions between pDOI and clinical covariates indicates that CT overestimation of DOI is uniform across patient subgroups and is not significantly modified by age, sex, or nodal status. This finding has direct clinical relevance for generalizing the use of CT-based rDOI across diverse patient populations.
Table 9.Multivariable Linear Regression of Independent Predictors of rDOI, Defined as the Mean of Radiologist 1 and Radiologist 2 Measurements a
PredictorsB95% CIStandard ErrortP-Value
pDOI (mm)0.870.79 to 0.950.04121.2< 0.001
Age (y)0.03-0.06 to 0.120.0460.650.519
Sex (female = 1)0.41-1.20 to 2.020.8140.500.617
Lymph node involvement0.68-0.85 to 2.210.7760.880.384
Intercept1.12-0.40 to 2.640.7711.450.152

a R2 = 0.792; F(4, 55) = 52.1; P < 0.001. Reference categories: sex = male; lymph node involvement = absent.

5. Discussion

The 8th edition AJCC and UICC staging systems introduced DOI as a key parameter for T classification because of its established correlation with cervical lymph node metastasis, locoregional recurrence, and disease-specific survival (4-7). Accurate preoperative estimation of DOI is therefore critical for staging and surgical resection planning, particularly regarding margin adequacy, neck dissection decisions, and reconstruction design (5). Because clinical examination alone is unreliable for this purpose (11), cross-sectional imaging with CT or MRI is indispensable, especially in patients who are not surgical candidates.
The primary objective of this study was to evaluate the correlation and diagnostic accuracy of CT-based rDOI relative to histopathological pDOI as the reference standard. As secondary objectives, the inter-reader reliability of CT-based rDOI measurements between 2 radiologists with different experience levels was assessed, and the relationship between DOI and cervical lymph node involvement was evaluated as an exploratory secondary analysis.
The principal finding of this study is that CT-based rDOI demonstrates strong agreement with histopathologic pDOI in patients with OTSCC, particularly for tumors with DOI > 5 mm. For this threshold, the AUC was > 0.92, sensitivity was > 89%, and specificity was > 85% for both radiologists. Moreover, inter-reader agreement was excellent (κ = 0.838) despite a marked difference in radiological experience (5 years for one radiologist and 20 years for the other). This finding indicates that CT-based rDOI measurement is reproducible when a standardized measurement protocol is applied. Multivariable regression confirmed that pDOI was the sole significant predictor of rDOI after adjustment for potential confounders, indicating that the rDOI-pDOI relationship is robust.

5.1. Comparison and Review the Previous Literature

Our finding of a strong rDOI-pDOI correlation for DOI > 5 mm and only moderate agreement for DOI ≤ 5 mm is consistent with the broader literature. Waech et al. compared rDOI on CT and MRI with histopathology in patients with OTSCC and found better correlation for tumors with pDOI > 5 mm, noting that imaging modalities, especially MRI, tended to overestimate rDOI compared with histology. In a study of 53 patients, Alsaffar et al. reported strong correlations between pathologic and radiologic measurements for tumors with pDOI ≥ 5 mm (11). Similar to our study, Naha et al. found that CT-derived rDOI correlated well with pDOI in 63 patients, but this correlation was not significant for superficial tumors with DOI < 5 mm. Baba et al. demonstrated the superiority of CT over MRI for rDOI estimation, attributing this to higher spatial resolution (4). Chin et al. confirmed an excellent correlation between rDOI on CT and pDOI in a cohort of 18 patients (5).
Across modalities, rDOI typically exceeds pDOI by approximately 1 to 2 mm on CT and 2 to 3 mm on MRI (14-16). In our series, mean CT overestimation was 1.12 mm for Radiologist 1 and 2.19 mm for Radiologist 2. Proposed mechanisms include peritumoral inflammatory edema visible on imaging but not representing true invasion, specimen shrinkage during formalin fixation (17), and the technical difficulty of establishing the basement membrane reference line on cross-sectional imaging, particularly when adjacent epithelial dysplasia is present, which CT scan and MRI cannot differentiate from normal mucosa (4, 15).
In modality comparisons reported in the literature, Takamura et al. found that intraoral ultrasound resulted in less overestimation (0.2 mm) than CT or MRI (2 to 3 mm) in 48 patients with tongue squamous cell carcinoma. A 2023 meta-analysis of 23 studies including 1787 patients confirmed that ultrasound showed the highest overall rDOI-pDOI correlation, followed by MRI and CT. That meta-analysis suggested that ultrasound may better differentiate tumors from edematous changes, especially in early-stage superficial lesions. However, ultrasound is limited by operator dependency, patient pain and cooperation, the need for dedicated intraoral probes, and reduced accuracy for DOI > 5 mm. Conversely, CT scan and MRI correlations improve specifically for DOI > 5 mm, as demonstrated in our data.
Taken together, our findings and the reviewed literature suggest that DOI derived from CT scan or MRI may be more reliable for tumors with DOI > 5 mm, whereas ultrasound may be more accurate for determining the depth of invasion in superficial lesions. Our observation of significantly higher pDOI in lymph-node-positive patients aligns with previous evidence linking DOI with nodal metastasis risk (5, 9).

5.2. Clinical Implications

Computed tomography-based rDOI measurement using a standardized protocol can be integrated into routine preoperative staging of OTSCC, particularly for tumors with DOI > 5 mm, for which CT performance is highest. The protocol is reproducible across radiologists with different experience levels, supporting its applicability in centers with less subspecialty head-and-neck imaging expertise. For superficial lesions with DOI ≤ 5 mm, intraoral ultrasound remains preferable because of the reduced sensitivity of CT in this stratum. The finding that higher DOI is independently associated with lymph node involvement supports the use of preoperative CT-based rDOI to stratify patients for elective neck dissection. Although histopathology remains the definitive gold standard, CT-derived rDOI provides clinically actionable preoperative information, particularly in patients who are not surgical candidates or when pathological assessment is not yet available.

5.3. Strengths and Limitations

A particular strength of this study is the explicit evaluation of inter-reader reliability between 2 radiologists with markedly different levels of experience, a factor that few studies have evaluated. This strengthens the reliability of our findings.
This study also has limitations that should be acknowledged. First, the retrospective, single-center design and modest sample size limit generalizability and may introduce selection bias. Second, subgroup analyses involving small strata, particularly DOI ≤ 5 mm (n = 12) and higher DOI categories, are statistically underpowered and should be interpreted as exploratory. Third, this study lacks a direct within-cohort comparison with MRI or ultrasound, precluding head-to-head modality evaluation. Fourth, external validation in independent cohorts is absent. Future prospective multicenter studies with direct comparisons of imaging modalities and external validation are warranted.

5.4. Future Directions

Future studies should prospectively compare CT, MRI, and ultrasound in the same cohort using a standardized protocol, with external validation in multicenter settings. Radiomics-based approaches and deep learning algorithms may further improve CT-based DOI estimation, particularly for superficial lesions. Standardization of CT acquisition parameters across institutions is also warranted to improve the reproducibility of rDOI measurements in routine practice.

5.5. Conclusions

Computed tomography-derived rDOI is reliable and diagnostically accurate in OTSCC, particularly for tumors with DOI > 5 mm, with an AUC > 0.92, sensitivity > 89%, and specificity > 85%. High inter-reader agreement, independent of radiologist experience level, supports the standardized use of CT-based DOI assessment in routine clinical practice. Based on the literature and our data, DOI derived from CT or MRI may be more reliable for tumors with DOI > 5 mm, whereas ultrasound may be more accurate for superficial lesions. Although histopathology remains the gold standard for definitive DOI assessment, rDOI provides clinically useful preoperative information for staging, elective neck dissection planning, reconstruction design, and prognosis, particularly when pathological assessment is not yet available. Mean DOI was significantly higher in patients with lymph node involvement, confirming the prognostic value of DOI in this population.

Acknowledgments

Footnotes

  • AI Use Disclosure:For the purpose of Text Editing, the Chat Gpt was used Minor in the Introduction section.

  • Authors' Contribution:Study concept/design: F. A., H. S., and M. L.; Data acquisition: F. A., J. E., and M. L.; Data analysis/interpretation: J. Z.; Manuscript drafting: F. A.; Critical revision for important intellectual content: F. A., Z. G., S. J., and F. S. K.; Statistical analysis: J. E. and J. Z.; Administrative/technical/material support: M. M. and S. J.; Study supervision: F. A. and H. S.

  • Conflict of Interests Statement:The authors do not declare any conflicts of interests for this study.

  • Data Availability:The dataset presented in the study is available on request from the corresponding author during submission or after publication. The data are not publicly available due to participant privacy and ethical restrictions.

  • Ethical Approval:This study is approved under the ethical approval code of IR.TUMS.AMIRALAM.REC.1400.046

  • Funding/Support:No funding was received for this study.

References

  • 1.
    Koyfman SA, Ismaila N, Crook D, D'Cruz A, Rodriguez CP, Sher DJ, et al. Management of the neck in squamous cell carcinoma of the oral cavity and oropharynx: ASCO Clinical Practice Guideline. J Clin Oncol. 2019;37(20):1753-1774. [PubMed ID: 30811281]. [PubMed Central ID: PMC7098829]. https://doi.org/10.1200/JCO.18.01921.
  • 2.
    Hashim D, Genden E, Posner M, Hashibe M, Boffetta P. Head and neck cancer prevention: from primary prevention to impact of clinicians on reducing burden. Ann Oncol. 2019;30(5):744-756. [PubMed ID: 30840052]. [PubMed Central ID: PMC6551449]. https://doi.org/10.1093/annonc/mdz084.
  • 3.
    Llewellyn CD, Johnson NW, Warnakulasuriya KAAS. Risk factors for oral cancer in newly diagnosed patients aged 45 years and younger: a case-control study in Southern England. J Oral Pathol Med. 2004;33(9):525-532. [PubMed ID: 15357672]. https://doi.org/10.1111/j.1600-0714.2004.00222.x.
  • 4.
    Baba A, Ojiri H, Ogane S, Hashimoto K, Inoue T, Takagiwa M, et al. Usefulness of contrast-enhanced CT in the evaluation of depth of invasion in oral tongue squamous cell carcinoma: comparison with MRI. Oral Radiol. 2021;37(1):86-94. [PubMed ID: 32086730]. https://doi.org/10.1007/s11282-020-00429-y.
  • 5.
    Chin SY, Kadir K, Ibrahim N, Rahmat K. Correlation and accuracy of contrast-enhanced computed tomography in assessing depth of invasion of oral tongue carcinoma. Int J Oral Maxillofac Surg. 2021;50(6):718-724. [PubMed ID: 33162298]. https://doi.org/10.1016/j.ijom.2020.09.025.
  • 6.
    Spiro RH, Huvos AG, Wong GY, Spiro JD, Gnecco CA, Strong EW. Predictive value of tumor thickness in squamous carcinoma confined to the tongue and floor of the mouth. Am J Surg. 1986;152(4):345-350. [PubMed ID: 3766861]. https://doi.org/10.1016/0002-9610(86)90302-8.
  • 7.
    Fukano H, Matsuura H, Hasegawa Y, Nakamura S. Depth of invasion as a predictive factor for cervical node metastasis in tongue carcinoma. Head Neck. 1997;19:205-210. https://doi.org/10.1002/(SICI)1097-0347(199705)19:3<205::AID-HED7>3.0.CO.
  • 8.
    Brierley JD, Gospodarowicz MK, Wittekind C. Skin Tumours. Oxford: Wiley-Blackwell; 2017. p. 131-132. https://doi.org/10.1002/9780471420194.tnmc26.pub3.
  • 9.
    Asakage T, Yokose T, Mukai K, et al. Tumor thickness predicts cervical metastasis in patients with stage I/II carcinoma of the tongue. Cancer. 1998;82:1443-1448. https://doi.org/10.1002/(SICI)1097-0142(19980415)82:8<1443::AID-CNCR2>3.0.CO.
  • 10.
    Sarrión Pérez MG, Bagán JV, Jiménez Y, Margaix M, Marzal C. Utility of imaging techniques in the diagnosis of oral cancer. J Craniomaxillofac Surg. 2015;43(9):1880-1894. [PubMed ID: 26325616]. https://doi.org/10.1016/j.jcms.2015.07.037.
  • 11.
    Alsaffar HA, Goldstein DP, King EV, de Almeida JR, Brown DH, Gilbert RW, et al. Correlation between clinical and MRI assessment of depth of invasion in oral tongue squamous cell carcinoma. J Otolaryngol Head Neck Surg. 2016;45(1). 61. [PubMed ID: 27876067]. [PubMed Central ID: PMC5120480]. https://doi.org/10.1186/s40463-016-0172-0.
  • 12.
    Arakawa A, Tsuruta J, Nishimura R, Sakamoto Y, Korogi Y, Baba Y, et al. Lingual carcinoma: correlation of MR imaging with histopathological findings. Acta Radiol. 1996;37(3P2):700-707. [PubMed ID: 8915280]. https://doi.org/10.1177/02841851960373P257.
  • 13.
    Locatello LG, Bruno C, Pietragalla M, Taverna C, Novelli L, Nardi C, et al. A critical evaluation of CT-derived depth of invasion in the preoperative assessment of oral cancer staging. Oral Oncol. 2020;107. 104749. [PubMed ID: 32388410]. https://doi.org/10.1016/j.oraloncology.2020.104749.
  • 14.
    Weimar EAM, Huang SH, Lu L, O'Sullivan B, Perez-Ordonez B, Weinreb I, et al. Radiologic-pathologic correlation of tumor thickness and its prognostic importance in squamous cell carcinoma of the oral cavity: implications for the 8th edition TNM classification. AJNR Am J Neuroradiol. 2018;39(10):1896-1902. [PubMed ID: 30166432]. [PubMed Central ID: PMC7410722]. https://doi.org/10.3174/ajnr.A5782.
  • 15.
    Huang SH, Hwang D, Lockwood G, Goldstein DP, O'Sullivan B. Predictive value of tumor thickness for cervical lymph node involvement in squamous cell carcinoma of the oral cavity. Cancer. 2009;115(7):2439-2447. [PubMed ID: 19197973]. https://doi.org/10.1002/cncr.24161.
  • 16.
    Madana J, Laliberté F, Morand GB, Yolmo D, Black MJ, Mlynarek AM, et al. Computerized tomography-based tumor-thickness measurement in oral tongue SCC. J Otolaryngol Head Neck Surg. 2015;44:49. [PubMed ID: 26573595]. [PubMed Central ID: PMC4647627]. https://doi.org/10.1186/s40463-015-0089-z.
  • 17.
    Cheng A, Schmidt BL. Management of the N0 neck in oral squamous cell carcinoma. Oral Maxillofac Surg Clin North Am. 2008;20(3):477-497. [PubMed ID: 18603204]. https://doi.org/10.1016/j.coms.2008.02.002.

Copyright

Copyright © 2026, Sharifian et al. This open-access article is available under the Creative Commons Attribution 4.0 (CC BY 4.0) International License (https://creativecommons.org/licenses/by/4.0/), which allows for unrestricted use, distribution, and reproduction in any medium, provided that the original work is properly cited.

Similar Articles

15
Aug
2016

Malignant Tumors of Tongue in Iranian Population

Mohammad Esmaeil Akbari,
Saede Atarbashi Moghadam,
Fazele Atarbashi Moghadam,
Zahra Bastani

Akbari ME, Atarbashi Moghadam S, Atarbashi Moghadam F, Bastani Z. Malignant Tumors of Tongue in Iranian Population. Int J Cancer Manag. 2016;9(4):e4467. doi: https://doi.org/10.17795/ijcp-4467

25
Aug
2018
Quantitative Analysis of Cartilage Invasion by Laryngeal Carcinoma with Dual-Energy CT Iodine Overlay Images and Spectrum Curve

Quantitative Analysis of Cartilage Invasion by Laryngeal Carcinoma with Dual-Energy CT Iodine Overlay Images and Spectrum Curve

Jie Jiang,
Shu-Juan Li,
Li Wu,
Wen Zhao,
Dan Han

Jiang J, Li S, Wu L, Zhao W, Han D. Quantitative Analysis of Cartilage Invasion by Laryngeal Carcinoma with Dual-Energy CT Iodine Overlay Images and Spectrum Curve. I J Radiol. 2019;16(1):e63217. doi: https://doi.org/10.5812/iranjradiol.63217

14
Feb
2026

Diagnostic and Prognostic Value of Dynamic CT Time-Density Curve Parameters in Non-small Cell Lung Cancer: A Retrospective Cohort Study

Haifeng Jiang,
Wenwei Shi,
Yaqiong Ma,
Mingzhong Ma,
Ying Ma,
Bingyin Zhu

Jiang H, Shi W, Ma Y, Ma M, Ma Y, et al. Diagnostic and Prognostic Value of Dynamic CT Time-Density Curve Parameters in Non-small Cell Lung Cancer: A Retrospective Cohort Study. I J Radiol. 2025;22(4):e167129. doi: https://doi.org/10.5812/iranjradiol-167129

7
Oct
2017
Agreement Between High-Resolution Computed Tomography and Pathological Tumor Size of Lung Adenocarcinoma: Influence of Ground Glass Opacity Ratio

Agreement Between High-Resolution Computed Tomography and Pathological Tumor Size of Lung Adenocarcinoma: Influence of Ground Glass Opacity Ratio

Hongliang Sun,
Yanyan Xu,
Zhenrong Zhang,
Wu Wang

Sun H, Xu Y, Zhang Z, Wang W. Agreement Between High-Resolution Computed Tomography and Pathological Tumor Size of Lung Adenocarcinoma: Influence of Ground Glass Opacity Ratio. I J Radiol. 2017;14(4):e22027. doi: https://doi.org/10.5812/iranjradiol.22027

24
Jun
2020
Iranian Journal of Radiology

Diagnostic Value of Dual-Energy CT Iodine for Characterization of Papillary Thyroid Microcarcinoma and Better Prediction of Metastatic Cervical Lymph Nodes

YI-Long Huang,
Yuan-Ming Jiang,
Zheng-Hua Zhang,
Wen Zhao,
Yue Jiang,
Yang Lin
,et al.

Huang Y, Jiang Y, Zhang Z, Zhao W, Jiang Y, et al. Diagnostic Value of Dual-Energy CT Iodine for Characterization of Papillary Thyroid Microcarcinoma and Better Prediction of Metastatic Cervical Lymph Nodes. I J Radiol. 2020;17(3):e99924. doi: https://doi.org/10.5812/iranjradiol.99924

Download PDF1.98 MB

Crossmark

Crossmark

Checking

Share on
Cited by
Metrics

Ordering Reprints

Articles are published under the Creative Commons license stated on each article. No permission or royalty fee is required for uses permitted by that license. CCC handles optional bulk and customized reprint orders. Any quotation covers production and delivery services only, not copyright permission. > Request Reprints from CCC 

Search Relations

Author(s):

Related Articles