Between May 2012 and March 2013, 25 patients with soft tissue neoplasm (17 males and eight females), aged between 3 and 77 years (mean, 36.6 years) with no previous surgery or treatment were prospectively included in our study. The diagnosis of all masses was confirmed by biopsy and/or surgery after MR imaging.
Nine patients had benign cystic tumors: three had a ganglion cyst, three had complex synovial cyst, two had epidermal cyst and one had complicated Baker’s cyst. Ten patients had benign solid or mixed tumors, three had hemangioma, two had schwannoma, while chronic hematoma, neurofibroma (
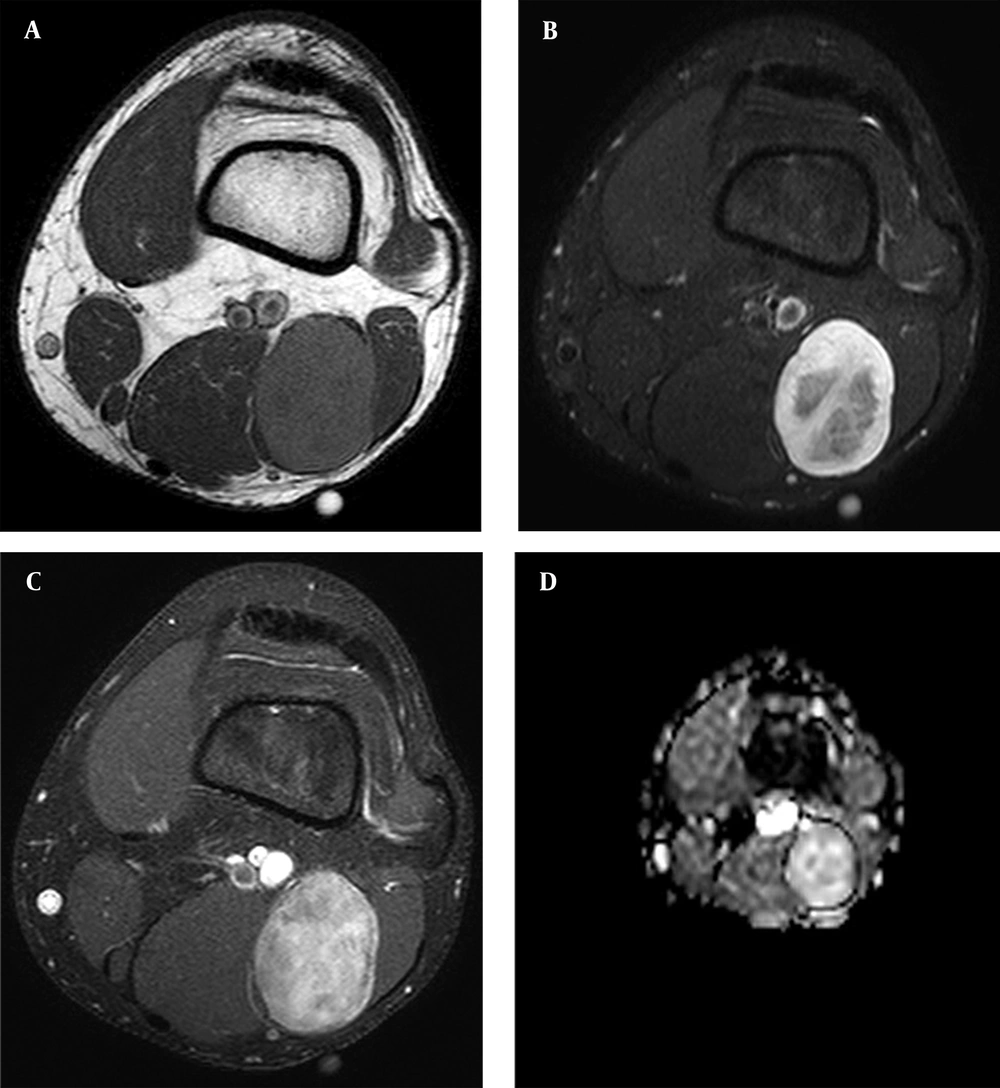
Figure 1), fibromatosis, giant cell tumor of tendon sheath and pigmented villonodular synovitis affected one patient each. There was only one patient in the malignant cystic tumor group (pleomorphic liposarcoma). Five patients had malignant solid or mixed tumors, two had soft tissue metastasis from lung adenocarcinoma (
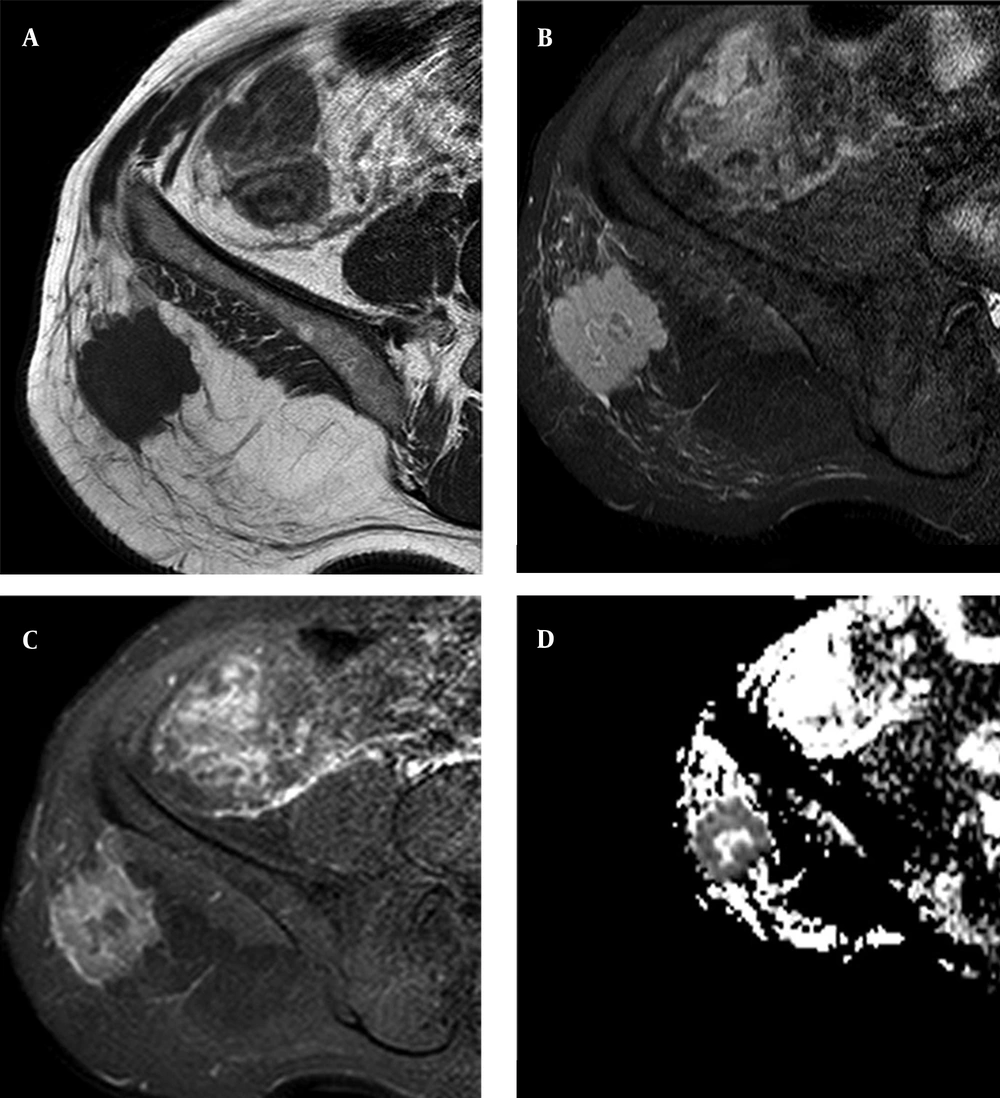
Figure 2), one had embryonal rhabdomyosarcoma, one had synovial sarcoma, and one had undifferentiated soft tissue sarcoma. Lesions were located in the thighs (
5), knees, ankles (
4), buttock, phalanx (
2), groin, shoulder, upper arm, forearm and calf (
1).
Magnetic resonance imaging of seventeen-year-old male with neurofibroma in the thigh. A, Axial T1-weighted. B, Fat-suppressed proton density. C, T1-weighted fat suppression postcontrast images. D, ADC maps. Mean ADC value was 1.92 × 10 -3 mm2/sec.
Magnetic resonance imaging of fifty-eight year-old male with subcutaneous fatty tissue metastasis in the right gluteal region from lung adenocarcinoma. A, Sagittal T1-weighted. B, Fat-suppressed proton density. C, T1-weighted fat suppression postcontrast image. D, ADC maps. lung adenocarcinoma, soft tissue metastasis. Mean ADC value from the solid portion was 0.78 × 10 -3 mm2/sec.
Lipomas were not included in this study because of their classic appearance on conventional MR and the fat-saturated pulse that was used on DWI. In three patients with hemangioma, lesions were intramuscular in location. One patient with chronic hematoma did not have previous trauma or anticoagulant medication history.
The institutional research ethics committee approved this study, and informed consent was obtained from all participants.
3.1. Magnetic Resonance Imaging
All studies were conducted using a 1.5-T system (Achieva; Philips, The Netherlands). Our routine bone tumor MR imaging protocol includes the following sequences: axial, coronal and/or sagittal T1-weighted, fat-suppressed T2-weighted, dynamic MR imaging and contrast-enhanced fat-suppressed axial, coronal and/or sagittal T1-weighted images.
We obtained diffusion-weighted images before contrast administration for all patients that participated in the study. The pulse sequence used for obtaining the DW images was a single-shot spin-echo Echo-Planar Imaging (EPI) technique with the following parameters: repetition time, 4500 msec; echo time, 105 msec; directions of the motion-probing gradients, three orthogonal axes; b value, and 1000 sec/mm2; field of view, 220 mm; matrix size, 128 × 128; section thickness, 5 mm with 0.2 - 1.0-mm intersection gaps; and two signals acquired. Parallel imaging techniques (SENSE) with a reduction factor of 1 - 1.5 were used. In all images, a fat-saturated pulse was used to exclude chemical-shift artifacts. Three DW images were obtained within an acquisition time of one to two minutes.
ADC maps were automatically generated on the operating console from concurrent images. The ADC values were calculated using the following equation: ADC = − ln [S(b)/S(0)]/b, where b indicates the b value and S(b) and S(0) are the signal intensities of images with b values equal to 1000 and 0, respectively.
3.2. Image Analysis
All the DW images were transferred to a workstation (Easy Vision; Philips Medical Systems). The ADC values were obtained by drawing a region of interest (ROI) on the ADC map and histogram analyses were obtained. The DW image analyses were made by two radiologists independently that were blind to the clinical data of the patients. For solid and mixed tumors, the ROIs were placed on the solid part of the lesions, as selected from T2-weighted and contrast enhanced MR images. Cystic and necrotic areas were not included in solid tumors.
3.3. Statistical Analysis
We grouped lesions as benign cystic, benign solid or mixed, malignant cystic and malignant solid or mixed tumors. Data analyses were performed using the SPSS software (ver. 15.0, SPSS for windows; SPSS inc., Chicago, IL, USA). The mean ADC values were compared between malignant and benign tumors using the Mann-Whitney U test. We only had one patient with a malignant cystic tumor and did not include it in the statistical analysis. P values of less than 0.05 were considered statistically significant.