1. Background
With less blood loss and fewer postoperative complications, segmental resection is promoted and accepted by hepatic surgeons in the treatment of liver neoplasms (1-3). The dorsal sector of the liver, the parenchyma surrounding the vena cava, is quite independent of the remaining liver and deserves special attention in the segmental resections or the partition for transplantation. This part of the parenchyma forms a dorsal sector on its own and deserves special attention, because of the problems it poses to surgeons undertaking liver segmental resections or partition for transplantation (4). The identification of the dorsal sector of the liver and its detailed anatomy is of primary importance for surgical practice. Segmental transcatheter arterial chemoembolization (TACE) possesses markedly stronger anticancerous effect but much less damage to liver function; hence, its long-term effectiveness excels the conventional TACE in liver cancers treatment (5-7). A sufficient segmental TACE of the tumor in the dorsal sector depends on the identification of feeding arteries to the segment; however, the origin of hepatic arterial blood supplying to the dorsal sector is intricate and needs further research. Several studies have described the portal and biliary anatomy of the liver (4, 8). To our knowledge, the arterial anatomy of the dorsal sector of human liver has not been understood completely. In the present study, we retrospectively analyzed computed tomography (CT) and digital subtraction angiography (DSA) images of the patients with tumors in the dorsal sector of the liver. The hepatic arteries feeding the tumors in the dorsal sector were evaluated by DSA in living bodies. We believe that information from this study would be useful for understanding the arterial anatomy of the dorsal sector of the liver.
2. Objectives
The objective of this study was to investigate the feeding arteries of tumors in dorsal sector of the liver.
3. Patients and Methods
The retrospective study was performed in accordance with approvals and the guidelines of ethical review board of our hospital. As the CT and DSA images of the patients were analyzed anonymously in the study, the ethical review board waived the need for written informed consent from the participants. CT and DSA images of the patients with tumors in the dorsal sector of the liver between August 2008 and May 2013 were analyzed retrospectively. The images were reviewed and interpreted by three radiologists with more than ten years of clinical experience, one surgeon, and one DSA technician. They analyzed all the images and then obtained consistent diagnosis of each case. Philips 8000 4-slice spiral CT was used (120 KV, 250 MAS) (Philips Healthcare, Cleveland, OH, USA), with a slice thickness of 5 mm. The enhanced scan was performed after bolus injection of 80 to 100 mL of Iohexol via a cubital vein (2-3 mL per second). The arterial phase, portal vein phase, and parenchymal phase scans were initiated at 20, 50, and 100 seconds after injection, respectively. DSA examinations and interventional treatments were performed under the Standardized Regulations of Interventional Treatments for Liver Cancers (Draft) (9). Siemens Polystar DSA device (Siemens Medical Solutions, Forchheim, Germany) was used for celiac artery, proper hepatic artery, and superior mesenteric artery angiography and indirect portography. For this purpose, 20 to 30 mL of iohexol was injected with a speed of 1.5 to 3 mL per second. The image acquisition was one to four frames per second. The time of visualization lasted 15 to 25 seconds. The definite diagnosis of hepatocellular carcinoma was made according to clinical diagnosis and staging criteria of primary hepatic carcinoma, established by Chinese Society of Liver Cancer (CSLC) (10). Liver metastasis was diagnosed by CT images and histopathologic analysis of primary tumor. To determine the Michels type of hepatic artery, we observed the vessels such as right hepatic artery, left hepatic artery, etc. (11). The localization diagnosis of tumors in the dorsal sector was determined by CT images based on the previous reports (Figure 1) (4, 12-14). The dorsal sector of the liver is located at the front and at the right side of the vena cava. The edges of the dorsal sector are as follows: segment I on the left side; right portal pedicle, segment Ⅷ and at times segment Ⅶ is in front of the dorsal sector; segment VII on the right side; The inferior vena cava at the back; and the terminal portions of the middle and right hepatic vein above (4). The DSA images were used to observe the hepatic artery branches including right anterior hepatic artery (RAHA), right posterior hepatic artery (RPHA), middle hepatic artery (MHA), left medial hepatic artery (LMHA), left lateral hepatic artery (LLHA), right hepatic artery (RHA), left hepatic artery (LHA), caudate hepatic artery (CaHA), and cystic artery (CyA). A scoring method was used to estimate each artery contribution to the tumor stain in dynamic DSA images. An artery contributing to > 75% of tumor stain was scored as 4 points, 50% to 75% as 3 points, 25% to 50% as 2 points, < 25% as 1 point, and 0% as 0 point (Figures 2 and 3). Dynamic DSA images of each patient were reviewed. The early phase images were used to determine the feeding arteries of the tumor (Figure 2). The scores of such arteries were evaluated according to their contributions to the tumor stain in the later phase images (Figure 3). The accumulative scores of each hepatic artery of eleven patients were used to evaluate the blood supply of feeding arteries to the tumors. Cases were excluded from the study if they had one or more of the followings: (a) liver with irregular outward appearance, eg, severe cirrhosis; (b) arterio-portal fistula; (c) arterio-venous fistula; (d) abnormal anastomotic or collateral arteries between left and right hepatic arteries; (e) a history of abdominal surgery before interventional procedure; (f) diffuse tumors in liver. The SPSS 11.0 (SPSS Inc, Chicago, Illinois, the USA) was used for statistical analysis. The case numbers of the feeding arteries of the tumors were compared by Cochran’s Q test. The scores of feeding arteries of the tumors were compared by test for several related samples (Friedman) and test for two related samples (Wilcoxon). P values < 0.05 were considered statistically significant.
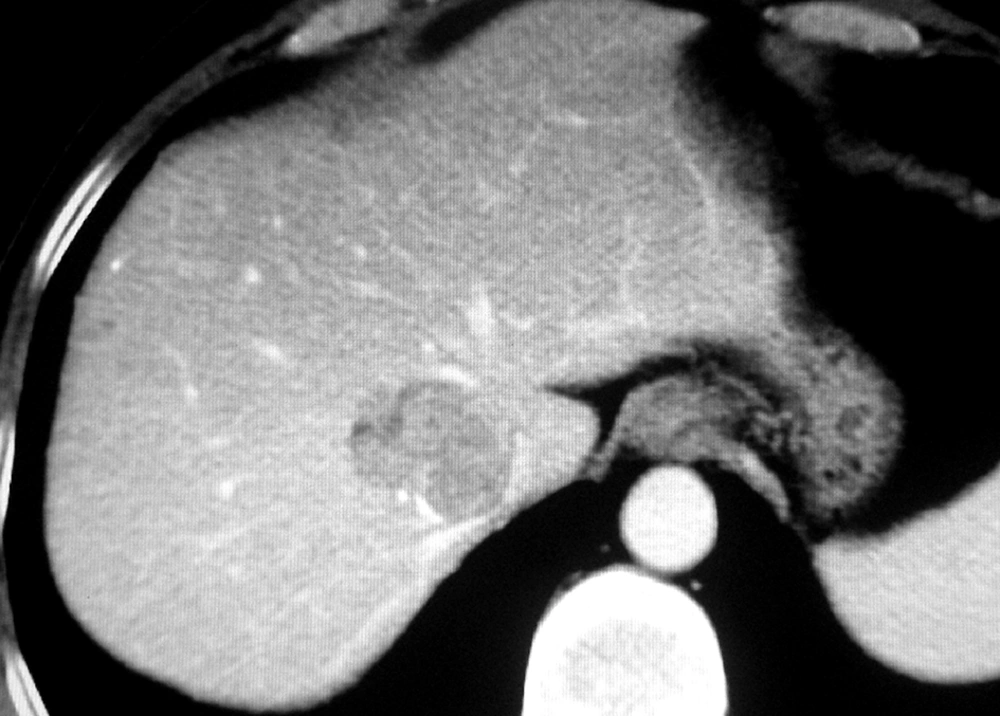
Figure 1.
Hepatocellular carcinoma located in dorsal sector of the liver in computed tomography image.
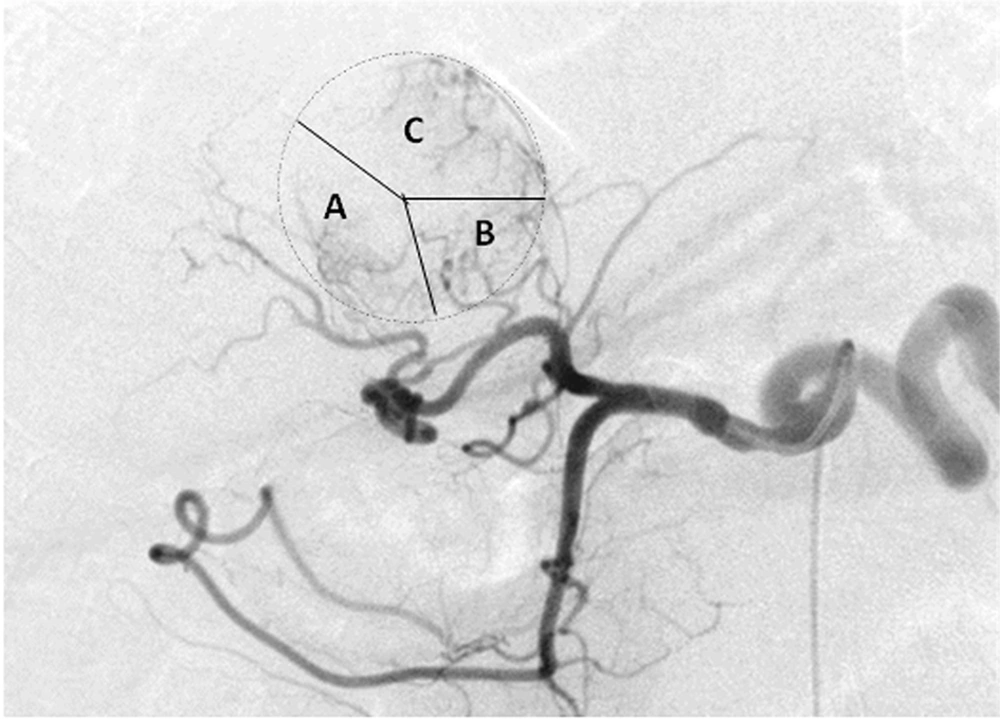
Figure 2.
Feeding arteries in the same patient as Figure 1. Early phase digital subtraction angiography imaging revealed that the tumor was supplied by several branches of right hepatic artery (RHA) and left hepatic artery (LHA). The main blood of the tumor was provided. A, right posterior hepatic artery (RPHA). B, Caudate hepatic artery (CaHA). C, Left medial hepatic artery (LMHA).
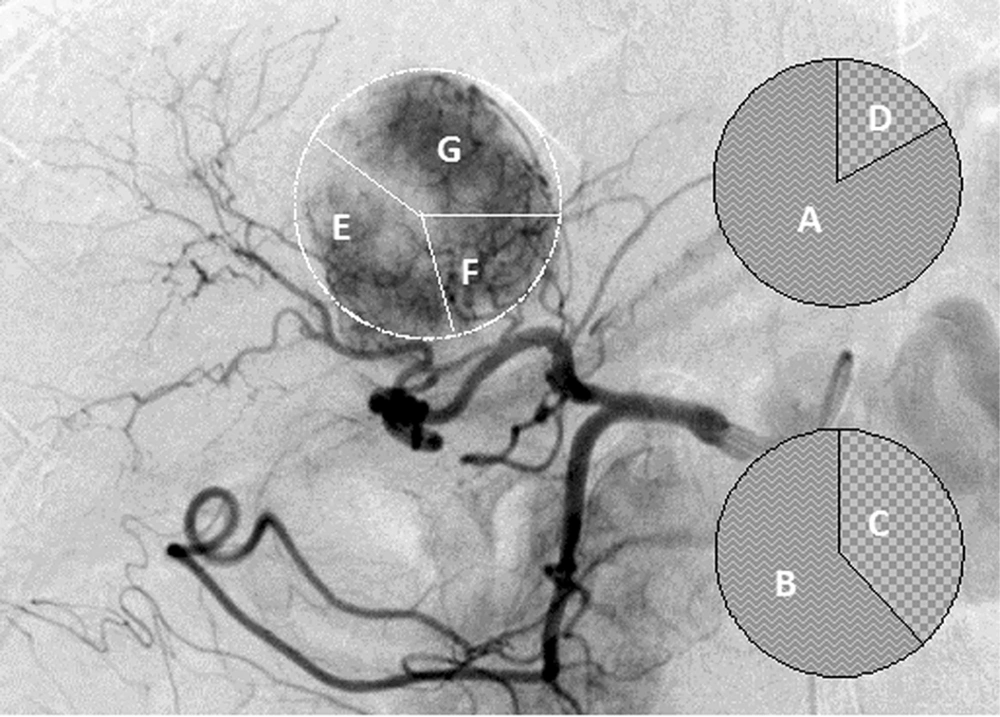
Figure 3.
Diagram of scoring definition in the same patient as Figure 1 and 2. A, A feeding artery contributing to > 75% of tumor stain was scored as 4 points; B, 50% to 75% as 3 points; C, 25% to 50% as 2 points; and D, < 25% as 1 point. E, Right posterior hepatic artery (RPHA). F, Caudate hepatic artery (CaHA). G, Left medial hepatic artery (LMHA) were respectively scored as 2, 1, and 2 points in later phase of digital subtraction image of the patient.
4. Results
This study included 11 patients, ten men and one woman, with the mean age of 53.9 years (range, 38-65 year) who had tumors in the dorsal sector of the liver. Eight cases were hepatocellular carcinoma and three were liver metastases. The primary tumors were colon cancer (n = 2) and gastric cancer (n = 1). The mean of maximum diameter of these tumors was 5.0 cm (range, 2.6-10.8 cm). According to the Michels classification of hepatic arterial anatomy, there were eight cases of type I, one case of type II, and one case of type III. Both the RHA and LHA originated directly from the celiac artery in one case. MHAs were revealed in nine cases. MHAs originated from RHA in seven cases, from LHA in one case, and from the proper hepatic artery (PHA) in one case. The scores of MHAs were cumulated to the corresponding RHA and LHA system in the current study. The data of the study revealed that the arterial blood of tumors in the dorsal sector originated from multiple arteries including RAHA, RPHA, CaHA, MHA, and LMHA (Table 1). The frequency and score of each arterial branch feeding the tumors was calculated (Tables 2 and 3). In this regard, the most prevalent feeding branch was RPHA followed by MHA. RPHA was seen in nine cases (81.8%) with 23 points in total. MHA was seen in eight cases (72.7%) with 17 points in total. The total scores of RHA branches and LHA branches were 51 and 11 points, respectively (Z = -2.764, P = 0.006, Wilcoxon).
Table 1.
Scores of Hepatic Arteries Contributing Tumor Stain a
| Case No. | Scores of Hepatic Arteries | ||||||
|---|---|---|---|---|---|---|---|
| RAHA (S/I) | RPHA (S/I) | CaHA (R/L) | MHA | LMHA | LLHA | CyA | |
| 1 | 1/1 | 3/0 | 1/0 | 1 | 0 | 0 | 0 |
| 2 | 0/1 | 1/1 | 1/0 | 2 | 1 | 0 | 0 |
| 3 | 1/0 | 3/0 | 0/0 | 2 | 0 | 0 | 0 |
| 4 | 0/0 | 0/0 | 0/0 | 4 | 1 | 0 | 0 |
| 5 | 0/0 | 2/0 | 0/0 | 3 | 1 | 0 | 0 |
| 6 | 3/0 | 0/0 | 0/0 | 2 | 0 | 0 | 0 |
| 7 | 0/0 | 2/0 | 0/0 | 1 | 2 | 0 | 0 |
| 8 | 4/0 | 1/0 | 0/0 | 0 | 1 | 0 | 0 |
| 9 | 0/0 | 2/0 | 1/1 | 0 | 1 | 0 | 0 |
| 10 | 0/0 | 4/0 | 0/0 | 2 | 0 | 0 | 0 |
| 11 | 0/0 | 4/0 | 0/0 | 0 | 0 | 0 | 0 |
a Abbreviations: RAHA, right anterior hepatic artery; RPHA, right posterior hepatic artery; CaHA, caudate hepatic artery; MHA, middle hepatic artery; LMHA, left medial hepatic artery; LLHA, left lateral hepatic artery; CyA, cystic artery; S, superior branch; I, inferior branch; R, right branch; and L, left branch.
Table 2.
Frequency of Arteries Supplying the Tumors (n = 11) a
| Feeding artery | MHA | RAHA | RPHA | CaHA | LMHA | Cochran’s Q | P Value |
|---|---|---|---|---|---|---|---|
| Frequency, No. (%) | 8 (72.7) | 5 (45.5) | 9 (81.8) | 3 (27.3) | 6 (54.5) | 3.677 | 0.086 |
a Abbreviations: MHA, middle hepatic artery; RAHA, right anterior hepatic artery; RPHA, right posterior hepatic artery; CaHA, caudate hepatic artery; and LMHA, left medial hepatic artery.
Table 3.
Scores of Feeding Arteries Contributing inTumor Stain (n = 11) a
| Feeding artery | RAHA | RPHA | CaHA (R) | MHA | CaHA (L) | LMHA | χ2 (Z) | P Value | Test |
|---|---|---|---|---|---|---|---|---|---|
| Score, No. (%) | 11 (17.7) b | 23 (37.1) | 3 (4.8) | 17 (27.4) | 1 (1.6) | 7 (11.3) | 20.574 | 0.001 | Friedman |
| Score, No. (%) | 51 (82.3) c | 11 (17.7) d | -2.764 | 0.006 | Wilcoxon | ||||
a Abbreviations: RAHA, right anterior hepatic artery; RPHA, right posterior hepatic artery; CaHA, caudate hepatic artery; MHA, middle hepatic artery; LMHA, left medial hepatic artery; R, right branch; and L, left branch.
b Friedman test is for the scores of RAHA, RPHA, CaHA (R),MHA, CaHA (L) and LMHA.; χ2 = 6.827, P = 0.078.
c The points of RHA system including RAHA, RPHA, right branch of CaHA, and MHA originated from RHA.
d The points of LHA system including LMHA, Left branch of CaHA, and MHA originated from LHA.
5. Discussion
5.1. Localization Diagnosis
The spatial and temporal resolution of CT was well improved as a result of increased speed and thin slice collimation over the past decades, which in turn provided a higher sensitivity in the detection of focal lesions and vascular structures (15, 16). Several researches revealed that CT has the ability to accurately identify the vascular structures on which segment anatomy was based in the liver of living body (13, 14, 17). The identification of inferior vena cava and hepatic veins is necessary to localize the diagnosis of the dorsal sector. Based on the previous reports, the diagnostic localization of tumors of the dorsal sector was determined by CT images in the present study (Figure 1) (4, 12-14).
5.2. Feeding Arteries
The vascular anatomy of the liver can be learned from autopsy, surgery, CT, and magnetic resonance imaging (MRI). Nevertheless, semi-quantitative analysis on the volume of blood flow of each artery feeding to a tumor in liver is almost impossible with these methods. DSA is powerful in the evaluation of vascular structure in living bodies. Moreover, dynamic DSA images of tumor staining may provide semi-quantitative information on blood flow of feeding arteries in pathophysiologic conditions (Figures 2 and 3). The data from the study showed that the origination of arteries feeding the tumors in the dorsal sector varies. Branch arteries from both RHA system and LHA system are blood source for the tumors in the dorsal sector. These branch arteries are MHA, RPHA, RAHA, LMHA, and CaHA, and should be observed seriously in clinic practice of interventional radiology (Table 2). The scores indicated that RPHA, MHA, RAHA, and LMHA were the main feeding arteries (Table 3). MHA is generally considered as feeding artery to liver segment IV (18, 19). However, it was one of the main feeding arteries of the tumors in the dorsal sector, and presented in eight cases (8/11; 72.7%). According to the data of the present study, CyA and LLHA did not supply blood to the tumors in the dorsal sector. CyA supplies the gallbladder area, while LLHA supplies the left lateral lobe of liver. These two regions do not have any interface on the dorsal sector of liver.
5.3. Clinical Significance
Segmental liver resection is preferable because it can conserve liver function and reduce postoperative complications in the treatment of liver neoplasms (2, 3). In cases of segmental surgery, the greater the posterior liver is, the more difficult the surgery can be (4). It was reported that continuous occlusion of hepatic artery is proper for preventing blood loss in partial hepatectomy in ruptured hepatocellular carcinoma (20). The information of tumor feeding arteries in the current study would promote understanding arterial anatomy of the dorsal sector of the liver, which can provide better presurgical mapping of the hepatic arteries. Segmental transarterial embolization (TAE) can reinforce anticancer effects and can be performed more safely than conventional TAE (21). TACE is an effective palliative intervention for unresectable liver tumors without affecting the patients’ quality of life (22, 23). Angiography displaying all the feeding arteries of the tumor is prerequisite to a successful segmental TACE. As for the segmental TACE of the tumor in the dorsal sector, superselective catheterization of each feeding artery should be performed individually for the administration of medications or embolism agents. The distribution of administrated medications and embolism agents depends on the evaluation of each feeding artery contributing to the tumor in the dorsal sector. The data in the present study indicated that semi-quantitative analysis of the tumor staining on dynamic DSA images was useful for determining the blood flow from each feeding artery of the tumor and planning the administration of medications and embolism agents in the interventional treatment. In general, the volume of blood flow from RHA system was larger than that from LHA system (51 points vs. 11 points; z = -2.764, P = 0.006, Wilcoxon test). It implied that more medications and embolism agents should be distributed to RHA branches in most tumors of the dorsal sector.
5.4. Limitations of the Study
The present study was limited by a small number of patients with two-dimensional digital subtraction angiography (DSA) images. An adequately powered study on feeding arteries of tumors in dorsal sector using three-dimensional digital reconstruction angiography and C-arm computed tomography images is necessary to confirm our findings. In conclusion, the arterial blood of tumors in hepatic dorsal sector originates from multiple arteries. Both RHA and LHA systems are blood source for the tumors in the dorsal sector. The volume of blood flow from RHA system to the tumors is larger than that from LHA system. RPHA, MHA, RAHA, and LMHA are the main feeding arteries. Radiologists and surgeons should pay close attention on these arteries in clinic practice.