


1. Background
2. Objectives
3. Patients and Methods
3.1. Patient Population
3.2. Image Acquisition
3.3. Imaging and Clinical Analysis
3.4. Histopathological Analysis
3.5. Statistical Analysis
4. Results
4.1. Image Findings
| Variable | Mean ± Standard Deviation (Range) or No. (%) |
|---|---|
| Age (year) | 51.7 ± 10.7 (24 - 79) |
| Size (cm) | 2.7 ± 2.0 (0 - 12) |
| Intervala (day) | 13.5 ± 8.0 (0 - 89) |
| T1, Subareolar Ductal Hemorrhage | |
| Negative | 355 (91.03) |
| Positive | 35 (8.97) |
| T1, Intra-Lesional Hemorrhage | |
| Negative | 356 (91.28) |
| Positive | 34 (8.72) |
| T2, Hemorrhage or Cystic Change | |
| Negative | 385 (98.72) |
| Positive | 5 (1.28) |
| T2, Edema | |
| Negative | 355 (91.03) |
| Positive | 35 (8.97) |
| Operation Method | |
| Breast-conserving surgery | 268 (68.72) |
| Mastectomy | 122 (31.28) |
| Cancer Type | |
| Ductal carcinoma in situ | 62 (15.90) |
| Invasive carcinoma | 328 (84.10) |
aInterval: from core needle biopsy to breast MRI
4.2. Image and Clinical Analyses
| T1, Subareolar Ductal Hemorrhage | P Value | T1, Intra-Lesional Hemorrhage | P Value | T2, High, Hemorrhage or Cystic Change | P Value | T2, Edema | P Value | |||||
|---|---|---|---|---|---|---|---|---|---|---|---|---|
| Negative (n = 355) | Positive (n = 35) | Negative (n = 356) | Positive (n = 34) | Negative (n = 385) | Positive (n = 5) | Negative (n = 355) | Positive (n = 35) | |||||
| Age | 51.7 ± 10.9; 50 (24 - 79) | 52.4 ± 8.8; 52 (28 - 67) | 0.4613 | 51.9 ± 10.7; 51 (24 - 79) | 50.4 ± 10.1; 49.5 (34 - 70) | 0.4646 | 51.7 ± 10.6; 51 (24 - 79) | 54.8 ± 15.9; 58 (31 - 71) | 0.4708 | 51.9 ± 10.4; 51 (24 - 79) | 50.0 ± 13.0; 50 (27 - 73) | 0.3923 |
| Tumor Size (cm) | 2.6 ± 1.9; 2.1 (0 - 12) | 3.4 ± 2.4; 2.5 (0 - 9) | 0.1413 | 2.6 ± 1.9; 2.1 (0 - 12) | 3.6 ± 2.6; 2.8 (0.6 - 9.2) | 0.059 | 2.7 ± 1.9; 2.1 (0 - 12) | 3.4 ± 3.2; 1.5 (1 - 7.9) | 0.8699 | 2.6 ± 0.9; 2.1 (0 - 12) | 3.8 ± 2.3; 2.9 (1.2 - 10.5) | 0.0002 |
| Intervala (day) | 13.3 ± 7.8; 12 (0 - 89) | 15.6 ± 9.4; 14 (5 - 50) | 0.1549 | 13.2 ± 7.7; 12 (0 - 89) | 16.7 ± 10.5; 13.5 (5 - 50) | 0.0522 | 13.4 ± 8.0; 12 (0 - 89) | 16.0 ± 6.0; 18 (8 - 23) | 0.2390 | 13.8 ± 8.2; 12 (0 - 89) | 10.4 ± 4.5; 11 (1 - 23) | 0.0091 |
| Operation Method | 0.1216 | 0.3600 | 0.6501 | 0.0071 | ||||||||
| Breast-Conserving Therapy | 248 (69.86) | 20 (57.14) | 247 (69.38) | 21 (61.76) | 265 (68.83) | 3 (60.0) | 251 (70.70) | 17 (48.57) | ||||
| Mastectomy | 107 (30.14) | 15 (42.86) | 109 (30.62) | 13 (38.24) | 120 (31.17) | 2 (40.0) | 104 (29.30) | 18 (51.43) | ||||
| DCE-MRI | 0.0001 | 0.0003 | 0.9999 | 0.9653 | ||||||||
| Mass | 284 (80.0) | 18 (51.43) | 284 (79.78) | 18 (52.94) | 298 (77.40) | 4 (80.0) | 275 (77.46) | 27 (77.14) | ||||
| Non-Mass | 71 (20.0) | 17 (48.57) | 72 (20.22) | 16 (47.06) | 87 (22.60) | 1 (20.0) | 80 (22.54) | 8 (22.86) | ||||
| Cancer Type | 0.0018 | 0.4337 | 0.1807 | 0.0842 | ||||||||
| DCIS | 50 (14.08) | 12 (34.29) | 55 (15.45) | 7 (20.59) | 60 (15.58) | 2 (40.0) | 60 (16.90) | 2 (5.71) | ||||
| Invasive Carcinoma | 305 (85.92) | 23 (65.71) | 301 (84.55) | 27 (79.41) | 325 (84.42) | 3 (60.0) | 295 (83.10) | 33 (94.29) | ||||
Abbreviations: DCE, dynamic contrast enhanced; DCIS, ductal carcinoma in situ.
aInterval: from core needle biopsy to breast MRI.
4.3. Histopathological Analysis
| No. | Age | Pre-Contrast MRI | Contrast-Enhanced MRI | Size in MRI | Size in Operation | Operation | Biopsy Pathology (× number) (size) | Subareolar Involvement | Inta |
|---|---|---|---|---|---|---|---|---|---|
| 1 | 28 | SD | Masses; irregular, spiculated, heterogeneous | 2.5 | 4 | SM | IDC (×4), DCIS (4 cm) | + | 23 |
| 2 | 54 | SD | Masses; oval, smooth, heterogeneous | 1.8, 0.8 | 3 | SM | No IDC, DCIS (1.5 cm, 1.5 cm), | + | 26 |
Abbreviations: DCIS, ductal carcinoma in situ; IDC, invasive ductal carcinoma; MD, (moderate differentiated); PD, (poorly differentiated); SD, subareolar ductal pre-contrast high signal on T1WI; SM, simple mastectomy; WD (well differentiated).
aInt: Interval period from core needle biopsy to breast MRI.
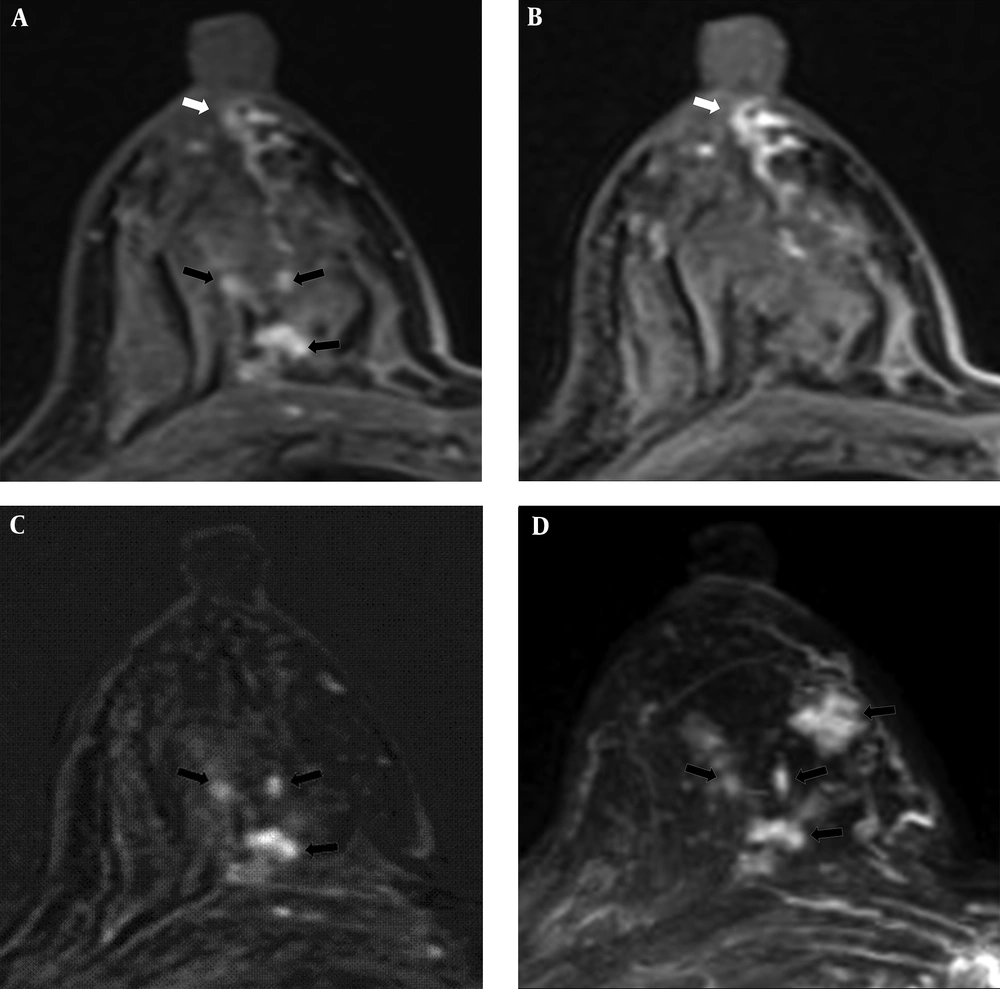
A 54-year-old woman had 1.8 cm and 0.8 cm lesions in the right breast that were confirmed as ductal carcinoma in situ by core needle biopsy. Subareolar involvement was confirmed on the pathological report after mastectomy. A, A post-contrast enhanced image revealed multiple enhancing lesions (black arrows) with a subareolar ductal high signal area (white arrow) that was described as BI-RADS category 6. B, A pre-contrast enhanced T1WI exhibiting subareolar ductal pre-contrast high signal area (white arrow). No findings were detected on T2WI. C, Subtraction and D, Maximal intensity projection images reveal multiple enhancing lesions (black arrows).
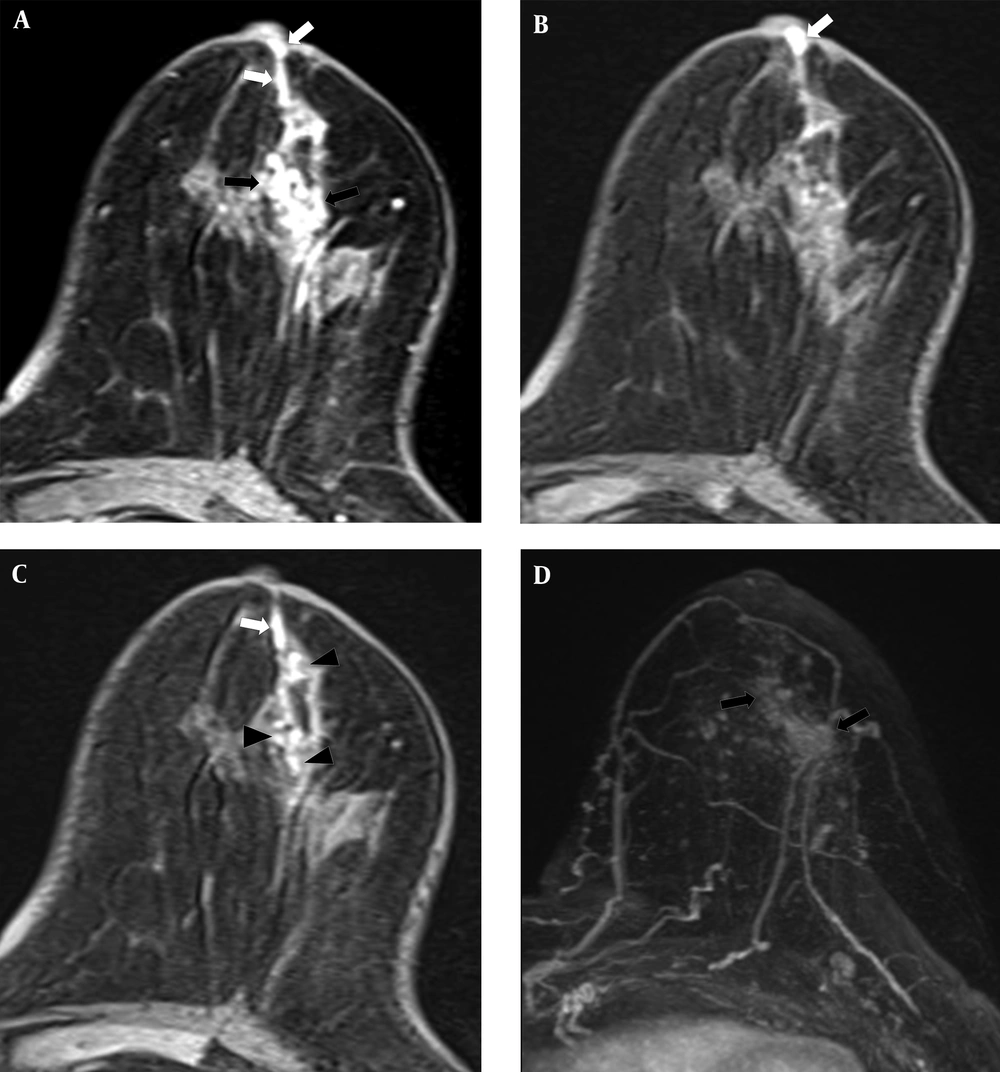
A 67-year-old woman had a 7 cm lesion in the left breast that was confirmed to be invasive ductal cancer and ductal carcinoma in situ by core needle biopsy. Subareolar involvement was not confirmed on the pathological report after mastectomy. A, A post-contrast enhanced image revealing segmental non-mass enhancement (black arrows) with subareolar ductal high signal areas (white arrows) was described as BI-RADS category 6. B and C, A pre-contrast enhanced T1WI exhibiting subareolar ductal (white arrows) and intra-lesional pre-contrast high signal areas (black arrowheads). No findings were detected on T2WI. D, Maximal intensity projection reveals segmental non-mass enhancement (black arrows) without subareolar ductal enhancement.
4.4 Relationship Between Findings and Interval Period from Core Needle Biopsy
| 1 Week (0 - 7 days) | 2 Weeks (8 - 14 days) | 3 Weeks (15 - 21 days) | 4 Weeks (22 - 28 days) | 5 Weeks (29 days) | P Value | |
|---|---|---|---|---|---|---|
| Distribution of Patients Based on Interval Period (%) | 50 (12.92) | 209 (54.01) | 90 (23.26) | 23 (5.94) | 15 (3.88) | |
| T1, Subareolar Ductal Hemorrhage | 0.4706 | |||||
| Negative | 48 (96.0) | 191 (91.39) | 80 (88.89) | 20 (86.96) | 13 (86.67) | |
| Positive | 2 (4.0) | 18 (8.61) | 10 (11.11) | 3 (13.04)b | 2 (13.33) | |
| T1, Intra-Lesional Hemorrhage | 0.0483 | |||||
| Negative | 49 (98.0) | 191 (91.39) | 80 (88.89) | 22 (95.65) | 11 (73.33) | |
| Positive | 1 (2.0) | 18 (8.61) | 10 (11.11) | 1 (4.35) | 4 (26.67) | |
| T2, High, Hemorrhage or Cystic Change | 0.3840 | |||||
| Negative | 50 (100.0) | 207 (99.04) | 88 (97.78) | 22 (95.65) | 15 (100.0) | |
| Positive | 0 (0.0) | 2 (0.96) | 2 (2.22) | 1 (4.35) | 0 (0.0) | |
| T2, Edema | 0.0342 | |||||
| Negative | 40 (80.0) | 189 (90.43) | 86 (95.56) | 22 (95.65) | 15 (100.0) | |
| Positive | 10 (20.0) | 20 (9.57) | 4 (4.44) | 1 (4.35) | 0 (0.0) |
aValues are presented as No. (%).
bTwo subareolar involvement cases were included at 4 weeks.

