


1. Background
| Variable | Weighting Factor |
|---|---|
| Number of liquid or soft stools over 7 days | × 2 |
| Abdominal pain | × 6 |
| 0 = none | |
| 1 - 2 = intermediate | |
| 3 = severe | |
| General well-being | × 6 |
| 0 = well | |
| 1 - 3 = intermediate | |
| 4 = terrible | |
| Extraintestinal complications | × 20 |
| Arthritis/arthralgia, iritis/uveitis, erythema nodosum, pyoderma gangrenosum, aphthous stomatitis, fissure/fistula/abscess, or fever of > 37.8°C during the previous week | |
| Use of antidiarrheal drugs in the previous 7 days | × 30 |
| Abdominal mass | × 10 |
| 0 = none | |
| 2 = questionable | |
| 5 = definite | |
| Hematocrit level | × 6 |
| 0.47 in males | |
| 0.42 in females | |
| Percentage deviation from standard body weight | × 1 |
2. Objectives
3. Patients and Methods
3.1. Patients
3.2. CT Enterography Technique
3.3. Image analysis
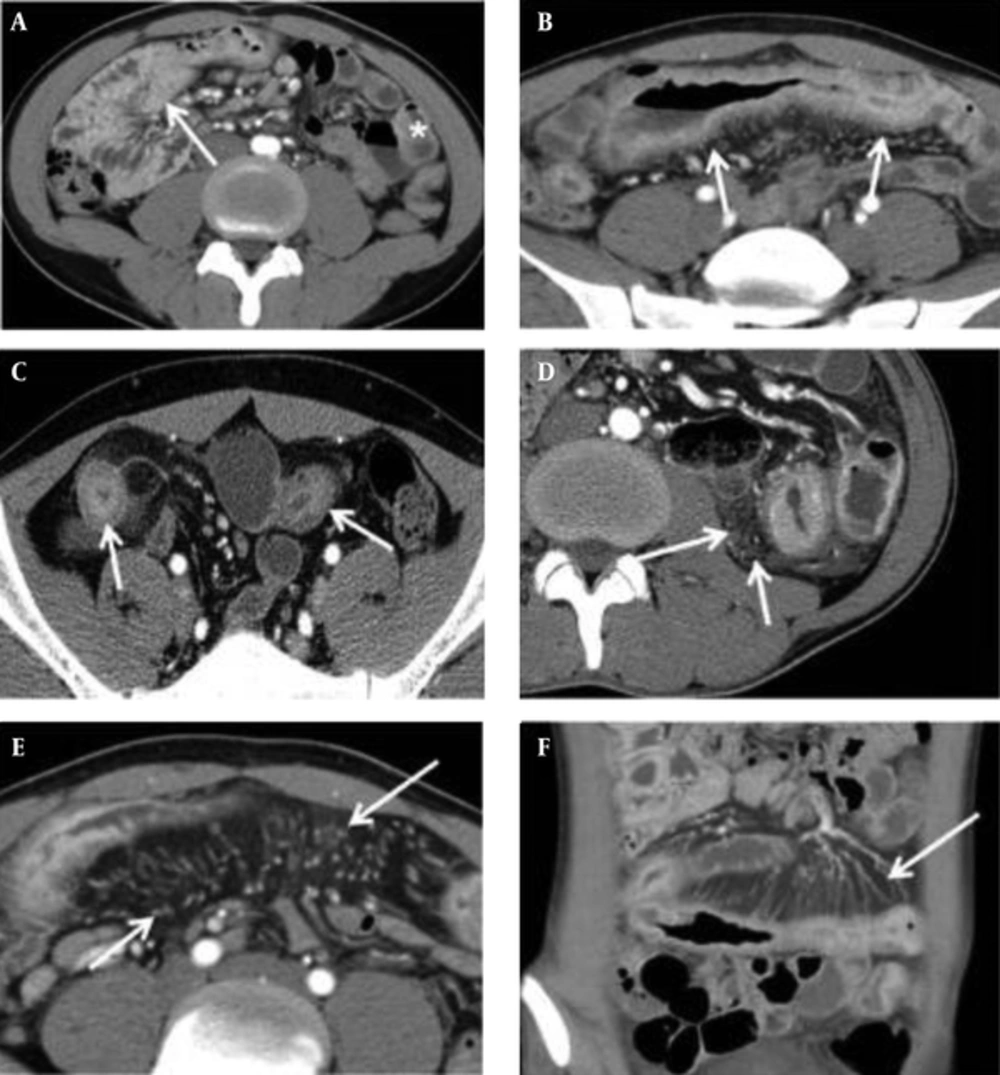
Five CTE Parameters. A, Mural hyperenhancement, defined as segmental increased attenuation of the bowel wall (arrow) compared with the attenuation of normal small bowel loop (asterisk); B, Mural thickness, defined as a bowel wall thickness of > 3 mm (arrows); C, Mural stratification, defined as a visualization of a two- or three-layer appearance within the bowel wall (arrows); D, Increased density in the mesenteric fat (arrows); E, and F, The comb sign, defined as vascular enlargement of the vasa recta (arrows).
| Parameters | |
|---|---|
| Mural Hyperenhancement (Late Arterial Phase) | |
| 0 | Not greater than enhancement of the normal-appearing distended loops in the same bowel segment |
| 1 | Greater than enhancement of the adjacent normal-appearing distended bowel loops |
| 2 | Present to a moderate degree, not 1 or 3 |
| 3 | Greater than enhancement of collapsed bowel loop wall |
| Mural thickening (portal phase) | |
| 0 | Same thickness of the adjacent non-inflamed bowel loops |
| 1 | Greater than 3 mm and less than 5 mm |
| 2 | Greater than 5 mm and less than 7 mm |
| 3 | Greater than 7 mm |
| Mural stratification (late arterial phase) | |
| 0 | Non-visualization of layers of the bowel wall |
| 1 | Bilaminar appearance of the small bowel wall |
| 2 | Trilaminar appearance of the small bowel wall |
| 3 | Trilaminar appearance with intramural edema (soft-tissue or water attenuation in the submucosa) |
| Comb sign (portal phase) | |
| 0 | Normal mesenteric vascularity |
| 1 | Minimal regional engorged vasa recta |
| 2 | Segmental dilatation of vasa recta with mild tortuosity |
| 3 | Diffuse tortuous vasa recta, oriented perpendicularly with extension to the affected bowel wall |
| Increased mesenteric fat density (portal phase) | |
| 0 | Same attenuation as perienteric fat adjacent to non-inflamed bowel loops |
| 1 | Mild inhomogeneous attenuation as compared to that of non-inflamed bowel loops |
| 2 | Present to a moderate degree, not 1 or 3 |
| 3 | Diffuse increased mesenteric fat attenuation |
3.4. Statistical Analysis
4. Results
4.1. Basic Characteristics
4.2. Associations Between CTE Parameters and CDAI and CRP
| CT Parameter | CDAI | CRP | ||
|---|---|---|---|---|
| Coefficient | P Value | Coefficient | P Value | |
| Mural hyperenhancement | 0.516 | 0.000 | 0.389 | 0.005 |
| Mural thickening | 0.442 | 0.001 | 0.386 | 0.006 |
| Mural stratification | 0.487 | 0.000 | 0.521 | 0.000 |
| Comb sign | 0.377 | 0.007 | 0.318 | 0.024 |
| Mesenteric fat density | 0.548 | 0.000 | 0.523 | 0.000 |
Abbreviations: CDAI, Crohn’s disease activity index CRP, C reactive protein.
| CT parameter | Beta Coefficient | Standard Error | Odds Ratio | P Value | 95% Confidence Interval | |
|---|---|---|---|---|---|---|
| Mural stratification | 1.823 | 0.760 | 6.192 | 0.016 | 1.395 | 27.480 |
| Mesenteric fat density | 3.420 | 1.485 | 30.556 | 0.021 | 1.665 | 560.666 |
| Enhanced lymph nodes | 3.218 | 1.548 | 24.983 | 0.038 | 1.293 | 518.768 |
| Fibrofatty proliferation | -2.866 | 1.934 | 0.057 | 0.138 | 0.001 | 2.522 |
| Fistula | 28.896 | 15248.249 | 3543617.343 | 0.998 | 0.000 | - |
| Stricture | -1.991 | 1.299 | 0.136 | 0.125 | 0.011 | 1.740 |
4.3. ROC Analysis
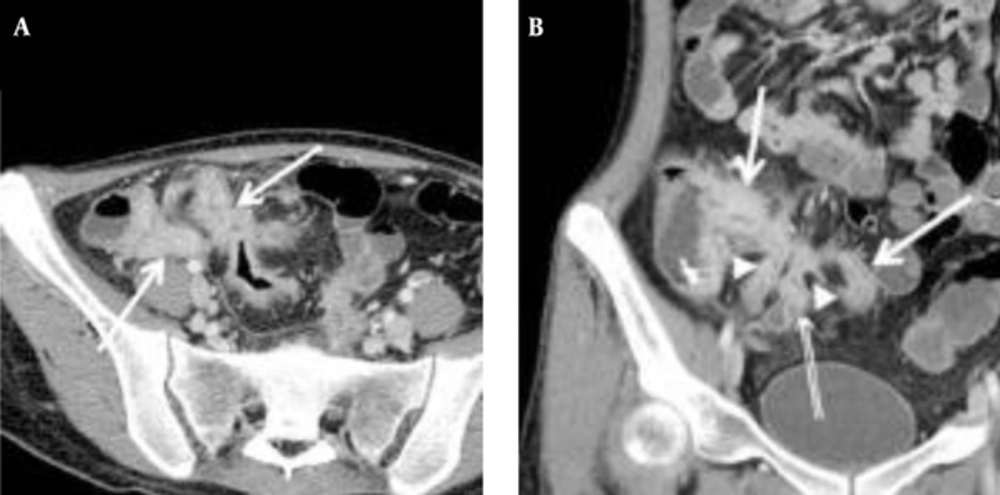
A, Transverse; B, Coronal CTE images of a 21-year-old woman with the highest CTE index (score of 15) among the 23 patients, showing abnormal bowel enhancement with wall thickening (white arrows) in the terminal and distal ileum, mural hyperenhancement (double arrows), and fistula formation (arrow heads) between the distal ileal loops (CDAI = 197.5, CRP = 67.3 mg/dL).
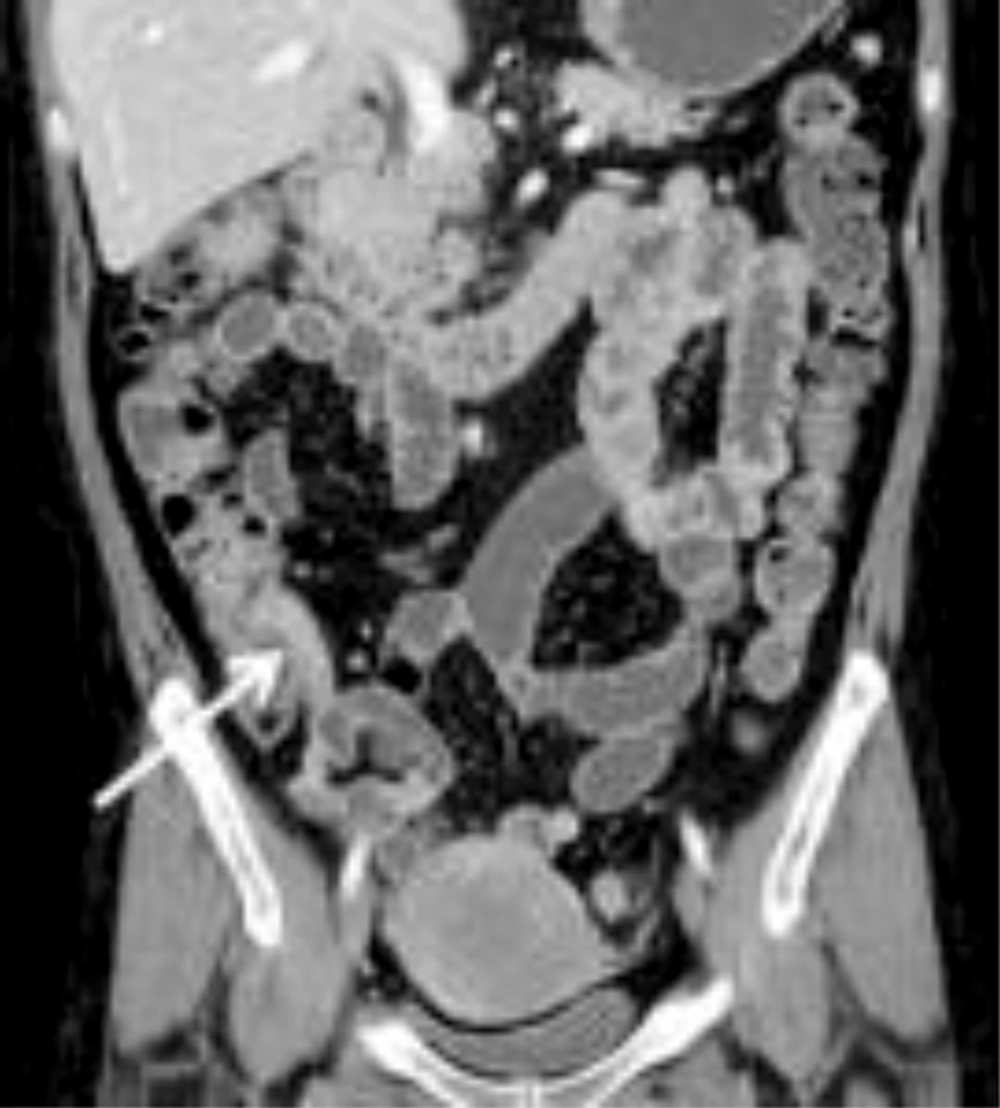
Coronal CTE image of a 35-year-old woman with the lowest CTE index (score of 3), showing only slight mural enhancement with mild bowel wall thickening in the terminal ileum (arrow). In this patient, the CDAI score was also low at 70.6, and CRP was 0.5 mg/dL
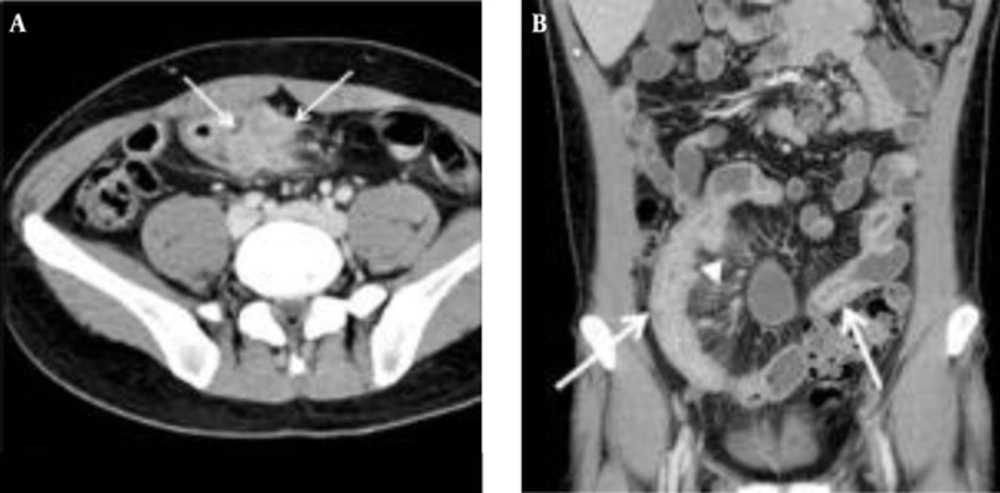
A, Transverse; B Coronal CTE images of a 32-year-old man with a low CTE index (score of 7), which is lower than the given cut-off value, showing mural hyperenhancement with mild thickening (arrows). This patient’s CDAI score was 157, indicating active Crohn’s disease, and his CRP was 6.4 mg/dL


