


1. Background
2. Objectives
3. Patients and Methods
3.1. Study Population
3.2. Lower Extremity CT Angiography
3.3. Coronary CT Angiography
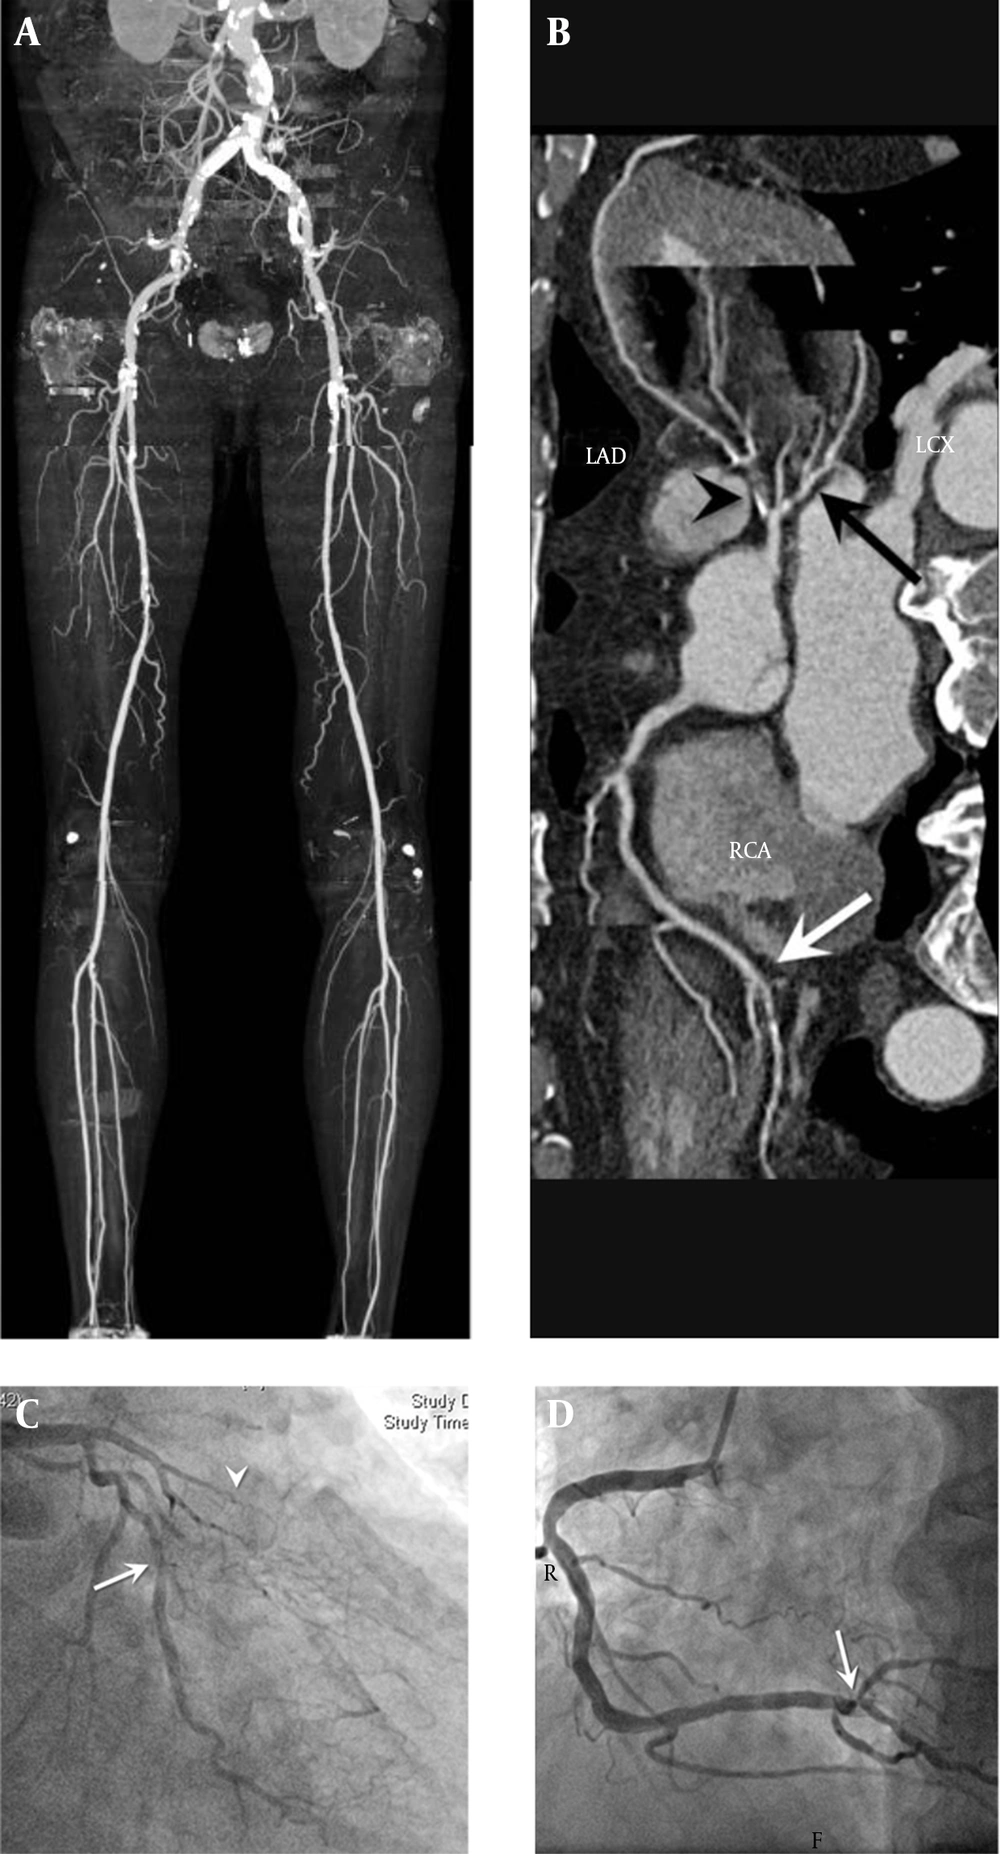
A 74 year-old male patient with claudication underwent lower extremity CT angiography. Lower extremity calcium was detected in the distal aorta, both common iliac arteries, both external iliac arteries, both common femoral arteries, both proximal superficial femoral arteries, right distal superficial femoral arteries, and right popliteal artery. A, The lower extremity calcium score was 11. B, Coronary CT angiography CCTA was performed and the coronary calcium score was 315.52. C, Invasive coronary angiography showed chronic total occlusion of the left anterior descending artery (arrowhead) and severe stenosis of the proximal left circumflex artery (arrow). D, Severe stenosis in trifurcation site of distal RCA (arrow). The stenotic lesions observed by invasive angiography were matched with CCTA results.
3.4. Statistical Analysis
4. Results
4.1. Patient Characteristics
| Variable | Nonsignificant CAD (n = 45) | Single-CAD (n = 26) | Multivessel-CAD (n = 32) | P Value |
|---|---|---|---|---|
| Age, y | 66.4 ± 8.9 | 68.8 ± 7.7 | 68.1 ± 7.3 | 0.437 |
| Gender, Male | 42 (93.3) | 22 (84.6) | 29 (90.6) | 0.488 |
| Height, cm | 163.4 ± 6.2 | 165.5 ± 8.3 | 164.9 ± 7.7 | 0.472 |
| Weight, kg | 56.9 ± 8.1 | 57.5 ± 10.3 | 56.9 ± 9.9 | 0.959 |
| Body mass index, kg/m2 | 21.2 ± 2.4 | 21.0 ± 3.2 | 20.8 ± 3.0 | 0.820 |
| Smoking, pack-years | 20.0 ± 17.3 | 26.3 ± 23.0 | 34.4 ± 24.3 | 0.033 |
| Diabetes Mellitus | 13 (28.9) | 14 (53.8) | 14 (43.8) | 0.101 |
| Hypertension | 20 (44.4) | 15 (57.7) | 20 (62.5) | 0.063 |
| Cerebral disease | 7 (15.6) | 10 (14.1) | 5 (15.6) | 0.980 |
| Chronic renal disease | 2 (4.4) | 1 (3.8) | 4 (12.5) | 0.129 |
| Total cholesterol, mmol/L | 145.6 ± 45.2 | 156.6 ± 45.6 | 164.1 ± 44.5 | 0.223 |
| HDL-cholesterol, mmol/L | 46.1 ± 14.8 | 41.3 ± 10.5 | 40.3 ± 16.4 | 0.611 |
| LDL-cholesterol, mmol/L | 84.1 ± 28.8 | 87.7 ± 21.2 | 95.5 ± 39.8 | 0.476 |
| Triglyceride, mmol/L | 122.8 ± 108.0 | 205.7 ± 135.5 | 211.1 ± 120.4 | 0.424 |
| Glucose, mmol/L | 134.8 ± 50.1 | 138.7 ± 59.7 | 139.7 ± 60.8 | 0.648 |
| Creatinine, μmol/L | 0.95 ± 0.57 | 1.38 ± 1.26 | 1.91 ± 1.72 | 0.191 |
| C-reactive protein | 43.6 ± 45.1 | 33.0 ± 48.0 | 47.8 ± 55.1 | 0.514 |
| Fontain II/III/IV, n | 24 / 14 / 7 | 10 / 6 / 10 | 10 / 12 / 10 | 0.136 |
avalues are expressed as No. (%) or mean ± SD.
4.2. Association of Lower Extremity Artery Disease, Lower Extremity Artery Calcification, and Coronary Artery Calcification with Coronary Artery Disease
| Variable | Nonsignificant CAD (n = 45) | Single-CAD (n = 26) | Multivessel-CAD (n = 32) | P Value |
|---|---|---|---|---|
| Lower extremity arterial index (LEAI) | 5.2 ± 3.5 | 8.0 ± 4.2 | 9.0 ± 5.0b | < 0.001 |
| Aortoiliac | 1.2 ± 1.5 | 1.2 ± 1.5 | 1.7 ± 1.8 | 0.370 |
| Femoropopliteal | 2.03 ± 2.1 | 2.3 ± 2.9 | 3.2 ± 2.3 | 0.127 |
| Below knee | 2.0 ± 2.5 | 4.7 ± 3.3b | 4.5 ± 3.5b | < 0.001 |
| Lower extremity calcium score (LECS) | 3.9 ± 2.3 | 5.7 ± 2.9 | 9.3 ± 4.2b,c | < 0.001 |
| Aortoiliac | 1.4 ± 1.5 | 1.7 ± 1.7 | 1.6 ± 1.8 | 0.789 |
| Femoropopliteal | 1.2 ± 1.5 | 1.6 ± 2.4 | 2.5 ± 2.1b | 0.028 |
| Below knee | 1.2 ± 1.7 | 2.4 ± 2.3 | 5.2 ± 4.1b,c | < 0.001 |
aValues are expressed as mean ± SD.
bP < 0.05 compared to nonsignificant CAD.
cP < 0.05 compared to single-CAD.
4.3. Ability of Lower Extremity Artery Calcification, Extent of Lower Extremity Arterial Disease, And Coronary Artery Calcification to Predict Multivessel Coronary Artery Disease
| Variable | Simple Regression | Stepwise Multiple Regression | ||
|---|---|---|---|---|
| OR (95% CI) | P Value | OR (95% CI) | P Value | |
| Age, y | 1.009 (1.003 - 1.015) | 0.002 | ||
| BMI | 0.968 (0.949 - 0.987) | 0.001 | ||
| HDL-cholesterol, mmol/L | 0.953 (0.911 - 0.993) | 0.021 | ||
| LDL-cholesterol, mmol/L | 1.021 (0.998 - 1.042) | 0.070 | ||
| Fontain classification | ||||
| Fontain III | 1.571 (0.579 - 4.267) | 0.375 | ||
| Fontain IV | 1.765 (0.726 - 4.979) | 0.193 | ||
| LEAI | 1.086 (0.971 - 1.175) | 0.146 | ||
| LECS in all segments | 1.633 (1.349 - 1.977) | < 0.001 | 1.439 (1.072 - 1.930) | 0.015 |
| Log CCS | 14.316 (4.657 - 44.009) | < 0.001 | 8.288 (2.317 - 29.645) | 0.001 |
Abbreviation: CI, confidence interval; BMI, body mass index; CCS, coronary calcium score; LEAI, lower extremity arterial index; LECS, lower extremity calcium score; OR, odds ratio.
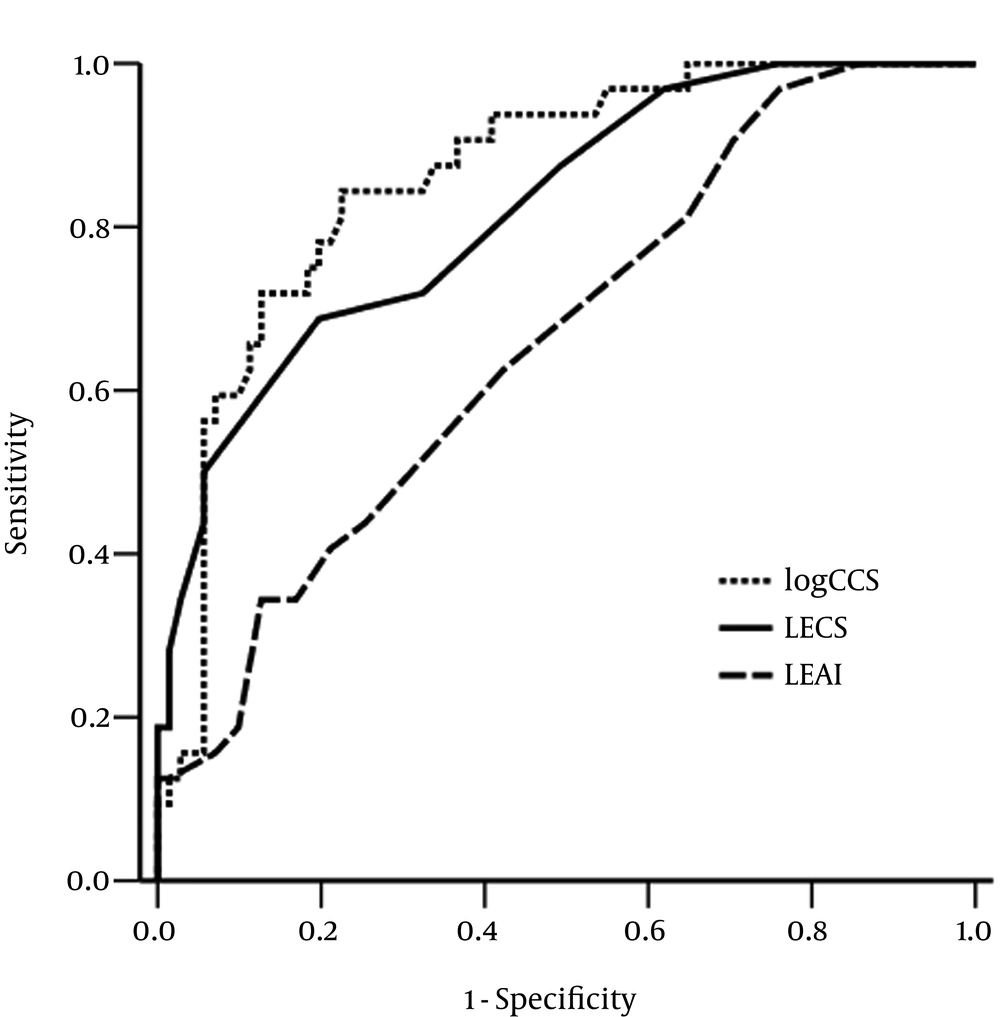
Receiver operator characteristic curves of log-transformed coronary calcium score (log CCS), lower extremity arterial index (LEAI), and lower extremity calcium score (LECS) in all segments, showing the diagnostic performance for the prediction of multivessel-coronary artery disease. The area under the curve of LECS in all segments, that of LEAI, and that of CCS were 0.820 (95% confidence interval = 0.734 to 0.907; P < 0.001), 0.661 (95% CI = 0.551 to 0.771; P = 0.009) and 0.865 (95% confidence interval = 0.792 to 0.938; P < 0.001), respectively.


