


1. Background
2. Objectives
3. Subjects and Methods
3.1. Subjects
3.2. Naming Test
3.3. MR Acquisition
3.4. Naming fMRI Task
3.5. Data Analysis
3.6. Preprocessing
3.7. First Level Analysis
3.8. Higher Level Analysis
3.9. Region of Interest Analysis
4. Results
4.1. VCN Performance Scores
| Subject | Age (year) | Sex | Performance | Hippocampus LIs | Inferior Frontal Gyrus LIs |
|---|---|---|---|---|---|
| 1 | 30 | Female | 58 | 0.521 | 0.021 |
| 2 | 29 | Female | 52 | -0.282 | 0.023 |
| 3 | 52 | Female | 55 | 0.576 | 0.022 |
| 4 | 24 | Female | 45 | 0.000 | 0.017 |
| 5 | 31 | Male | 48 | 0.000 | 0.027 |
| 6 | 16 | Female | 50 | -0.128 | 0.014 |
| 7 | 31 | Female | 55 | 0.443 | 0.020 |
| 8 | 49 | Female | 50 | 0.333 | 0.033 |
| 9 | 63 | Male | 46 | 0.563 | 0.021 |
| 10 | 30 | Male | 52 | 0.253 | 0.021 |
| 11 | 25 | Female | 55 | 0.079 | 0.023 |
| 12 | 26 | Female | 54 | 0.460 | 0.018 |
| 13 | 28 | Female | 58 | 1.000 | 0.035 |
| 14 | 28 | Female | 50 | 0.127 | 0.022 |
| 15 | 19 | Male | 51 | 0.428 | 0.018 |
| 16 | 50 | Male | 52 | -0.900 | 0.372 |
| 17 | 29 | Male | 47 | 1.000 | 0.021 |
Abbreviation: LI, laterality index
4.2. fMRI Results
| Areas | Lobe | Side | Z score | x | y | z |
|---|---|---|---|---|---|---|
| Occipital pole | Occipital | Right | 3.95 | 32 | -92 | -11 |
| Inferior frontal gyrus | Frontal | Left | 3.89 | -58 | 16 | 22 |
| Frontal orbital cortex | Frontal | Right | 3.86 | 44 | 24 | -6 |
| Occipital fusiform gyrus | Occipital | Right | 3.61 | 28 | -90 | -22 |
| Lateral occipital gyrus | Occipital | Right | 3.08 | 30 | -90 | 0 |
| Inferior frontal gyrus | Frontal | Right | 2.62 | 36 | 32 | 4 |
Abbreviation: VCN, visual confrontation naming
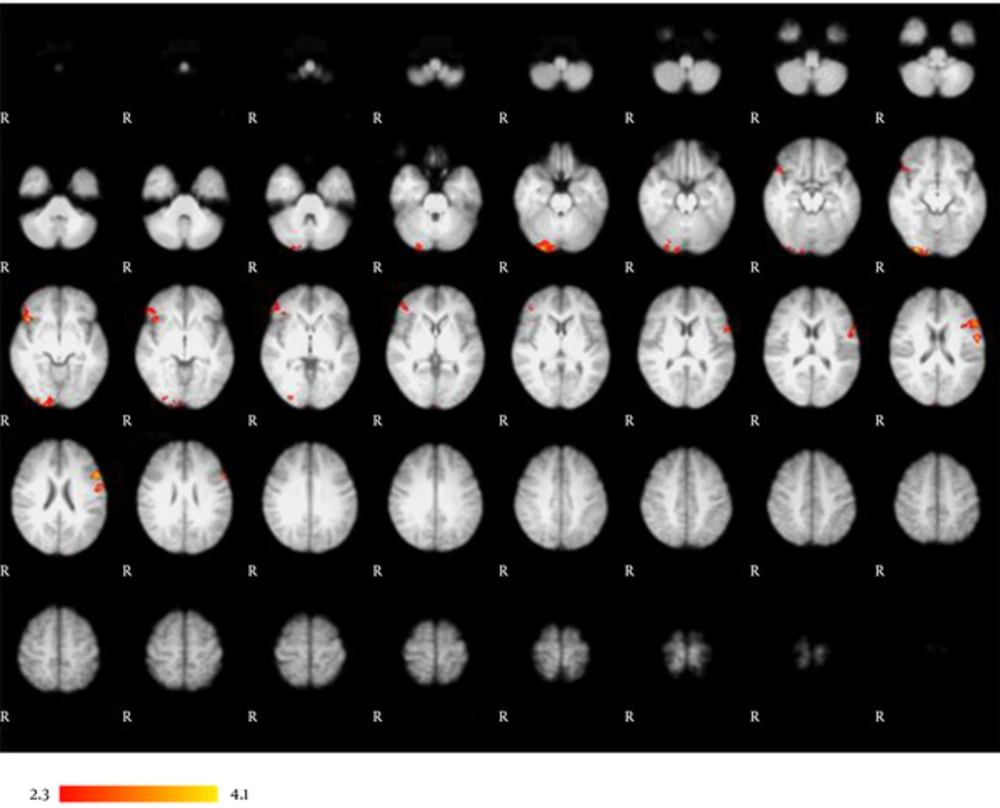
The main effects of VCN. Whole-brain analysis reveals left lateralized activation in the inferior frontal gyrus. VCN tasks mainly produced activation in the left inferior frontal gyrus, right inferior frontal gyrus, right lateral occipital gyrus, right occipital fusiform gyrus, right occipital pole, and right orbital frontal cortex. Results are displayed at a significance threshold of P < 0.05, corrected for family-wise error.
| Areas | Lobe | Side | Z score | x | y | z |
|---|---|---|---|---|---|---|
| Temporal pole | Temporal | Left | 4.15 | -50 | -14 | -22 |
| Middle temporal gyrus | Temporal | Left | 4.13 | -50 | -8 | -12 |
| Temporal occipital fusiform | Occipital | Left | 3.86 | 32 | -62 | -16 |
| Superior temporal | Temporal | Left | 3.85 | -58 | -10 | -10 |
| Occipital fusiform | Occipital | Left | 3.72 | -18 | -80 | -10 |
Abbreviations: fMRI, functional magnetic resonance imaging; VCN, visual confrontation naming
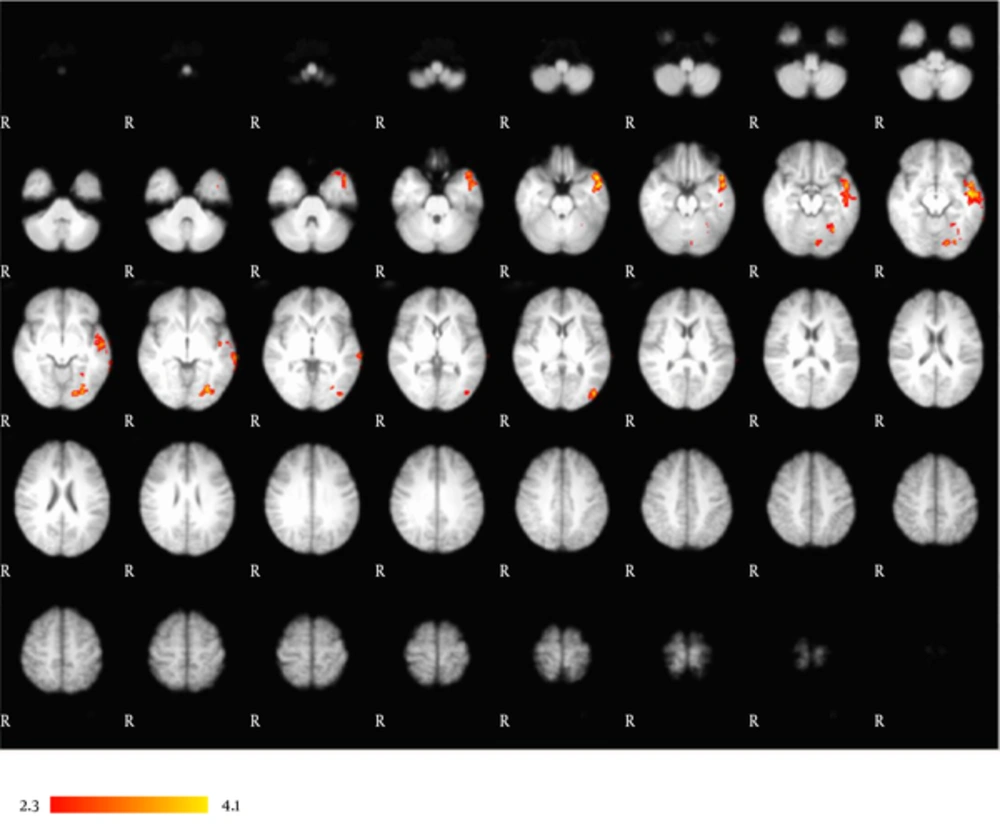
Correlational analysis. Left-dominant activation in an occipitotemporal network correlates with subjects’ VCN performance. This network is comprised of the left occipital fusiform gyrus, left temporal occipital fusiform gyrus, left middle temporal gyrus, left superior temporal gyrus, and left temporal pole. Results are displayed at a significance threshold of P < 0.05, corrected for family-wise error.
| Areas | Lobe | Side | Z score | x | y | z |
|---|---|---|---|---|---|---|
| Hippocampus | Temporal | Left | 3.11 | -14 | -10 | -22 |
| Hippocampus | Temporal | Left | 2.96 | -26 | -24 | -18 |
| Hippocampus | Temporal | Left | 2.95 | -26 | -20 | -22 |
Abbreviation: ROI, region of interest
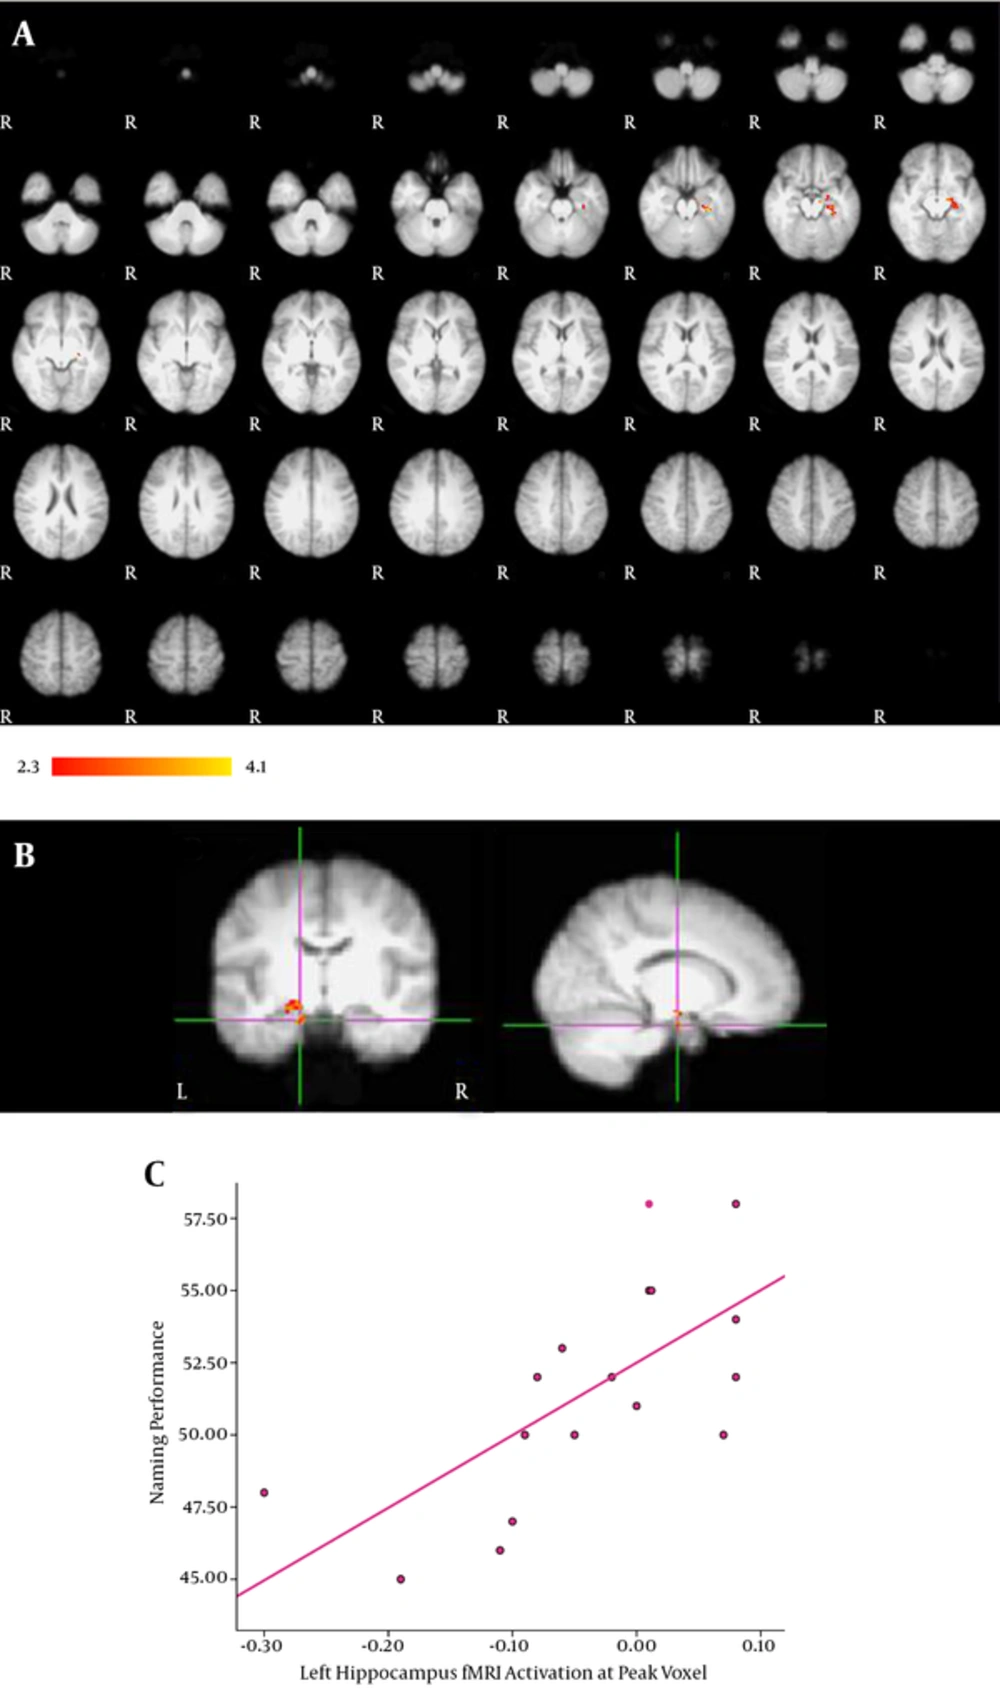
ROI analysis of the hippocampus. A, Activation in the left hippocampus significantly correlated with VCN performance; B, The activation map displaying the correlation of fMRI signal with VCN performance at peak voxel in the left hippocampus; C, A diagram illustrating how VCN performance score is related to fMRI activation at peak voxel. Greater fMRI activation was related to better VCN performance score. Results are displayed at a significance threshold of P < 0.05, corrected for family-wise error.
