


1. Background
2. Objectives
3. Patients and Methods
3.1. Patient Population
3.2. Conventional MRI
3.3. MR Spectroscopy
3.3.1. Data Acquisition
3.3.2. Pre-Processing
3.3.3. Quantification
3.4. Diffusion-Weighted Imaging
3.4.1. Data Acquisition
3.4.2. Quantification
3.5. Histopathological Evaluation
3.6. Statistical Analysis
4. Results
4.1. cMRI
4.2. MR Spectroscopy
4.2.1. Normal Side of the Brain Metabolite Ratios
| Metabolic Ratio | Tumor Grade | TE30 | TE140 | TE270 | |||
|---|---|---|---|---|---|---|---|
| Mean (SD) | Sig | Mean (SD) | Sig | Mean (SD) | Sig | ||
| Chol/Cr | 1 | 0.42 (0.08) | < 0.001 | 0.37 (0.32) | < 0.001 | - | < 0.001 |
| 2 | 0.43 (0.27) | 0.86 (0.57) | 0.71 (0.33) | ||||
| 3 | 0.79 (0.63) | 1.04 (0.54) | 0.97 (0.43) | ||||
| 4 | 1.09 (0.48) | 1.52 (0.62) | 1.44 (0.60) | ||||
| Normal | 0.24 (0.12) | 0.38 (0.15) | 0.45 (0.12) | ||||
| Chol/NAA | 1 | - | < 0.001 | 0.43 (0.49) | < 0.05 | - | < 0.001 |
| 2 | 0.80 (0.65) | 1.04 (1.20) | 0.62 (0.51) | ||||
| 3 | 1.37 (1.80) | 1.47 (1.88) | 0.62 (0.63) | ||||
| 4 | 1.27 (0.74) | 1.78 (1.89) | 1.53 (1.10) | ||||
| Normal | 0.25 (0.11) | 0.17 (0.05) | 0.12 (0.04) | ||||
| NAA/Cr | 1 | - | < 0.001 | 1.23 (0.66) | < 0.001 | - | < 0.001 |
| 2 | 1.18 (0.46) | 1.68 (1.31) | 2.60 (1.33) | ||||
| 3 | 0.55 (0.43) | 1.52 (1.46) | 1.76 (0.60) | ||||
| 4 | 0.75 (0.83) | 0.74 (0.38) | 1.02 (0.53) | ||||
| Normal | 1.36 (1.67) | 2.28 (0.91) | 4.13 (1.07) | ||||
Abbreviations: SD, standard deviation; sig, significance (P value), Chol, choline; CR, creatine; NAA, N-acetyl aspartate; TE, echo time.
4.2.2. Metabolite Ratios in Various Glioma Grades Acquired With Different TEs
| Metabolic Ratio | Tumor Grade | TE30 | TE140 | TE270 | |||
|---|---|---|---|---|---|---|---|
| Mean (SD) | Sig | Mean (SD) | Sig | Mean (SD) | Sig | ||
| Max (Chol/Cr) | 1 | 0.48 (-) | < 0.05 | 1.85 (-) | < 0.05 | - | < 0.001 |
| 2 | 0.76 (1.02) | 1.29 (0.58) | 0.77 (0.34) | ||||
| 3 | 1.10 (0.90) | 1.30 (0.69) | 1.16 (0.37) | ||||
| 4 | 1.65 (0.61) | 2.59 (1.10) | 1.97 (0.46) | ||||
| Max (Chol/NAA) | 1 | - | < 0.001 | 0.79 (-) | 0.27 | - | < 0.05 |
| 2 | 0.91 (0.38) | 1.89 (2.13) | 0.82 (0.46) | ||||
| 3 | 1.10 (0.59) | 3.47 (3.74) | 1.29 (1.07) | ||||
| 4 | 2.18 (0.91) | 3.87 (3.41) | 2.79 (1.88) | ||||
| Min (NAA/Cr) | 1 | - | 0.45 | 0.76 (-) | 0.1 | - | < 0.001 |
| 2 | 0.63 (0.55) | 1.22 (1.01) | 1.89 (0.46) | ||||
| 3 | 0.37 (0.35) | 0.84 (0.61) | 1.25 (0.56) | ||||
| 4 | 0.56 (0.36) | 0.53 (0.42) | 0.66 (0.39) | ||||
Abbreviations: Max, maximum; Min, minimum; Chol, choline; CR, creatine; NAA, N-acetyl aspartate; TE, echo time; SD, standard deviation; sig, significance (P value).
4.2.3. Developing Metabolic Ratio Cut-Off Values for Clinical Applications
| Ratio | Cut-off | Sensitivity | Specificity | PPV | NPV | AUC | sig |
|---|---|---|---|---|---|---|---|
| Max (Chol/Cr) at TE = 270 | 1.15 | 86 | 90 | 92 | 82 | 0.89 | 0.001 |
| Min (NAA/Cr) at TE = 270 | 1.36 | 79 | 90 | 92 | 75 | 0.88 | < 0.05 |
| Min (ADC) at b = 1000 | 0.83 | 72 | 86 | 88 | 69 | 0.80 | < 0.05 |
| Mean (ADC) at b = 3000 | 0.85 | 69 | 81 | 82 | 68 | 0.80 | < 0.05 |
| Min (ADC) at b = 500 | 0.95 | 73 | 75 | 79 | 68 | 0.80 | < 0.05 |
Abbreviations: ADC, apparent diffusion coefficient; PPV, positive predictive value; NPV, negative predictive value; b: diffusion sensitivity; AUC, area under the curve; Chol, choline; CR, creatine; NAA, N-acetyl aspartate; TE, echo time; sig, significance (P value); Min, minimum.
4.3. DWI
4.3.1. ADC Values for the Normal side of Brain
| Tumor Grade | b = 500 | b = 1000 | b = 3000 | ||||
|---|---|---|---|---|---|---|---|
| Mean (SD) | Sig | Mean (SD) | Sig | Mean (SD) | Sig | ||
| Mean ADC value | 1 | 1.90 (0.99) | < 0.05 | 1.89 (1.05) | < 0.001 | 1.06 (0.26) | < 0.001 |
| 2 | 1.61 (0.40) | 1.56 (0.42) | 1.02 (0.22) | ||||
| 3 | 1.46 (0.48) | 1.35 (0.43) | 0.89 (0.17) | ||||
| 4 | 1.12 (0.34) | 1.04 (0.31) | 0.72 (0.14) | ||||
| Normal GM | 0.72 (0.11) | 0.73 (0.15) | 0.53 (0.06) | ||||
| Normal WM | 0.82 (0.11) | 0.75 (0.15) | 0.47 (0.07) | ||||
| Min ADC value | 1 | 1.65 (0.91) | < 0.05 | 1.59 (0.89) | < 0.05 | 0.94 (0.23) | < 0.05 |
| 2 | 1.24 (0.45) | 1.20 (0.48) | 0.79 (0.27) | ||||
| 3 | 1.10 (0.53) | 1.02 (0.46) | 0.65 (0.20) | ||||
| 4 | 0.71 (0.23) | 0.68 (0.19) | 0.51 (0.13) | ||||
Abbreviations: GM, gray matter; WM, white matter; ADC, apparent diffusion coefficient; SD, standard deviation; sig, significance (P value); Min, minimum.
4.3.2. ADC Values in Various Glioma Grades Using Different b Values
4.3.3. Developing ADC Value Thresholds for Clinical Applications
4.4. Combining DWI and MRS Parameters: True Multimodal Parameters in Glioma Grading
5. Discussion
![This 22-year-old female was admitted due to recent seizure attacks and a relatively homogeneous non-enhancing intra-axial lesion in the right medial frontal lobe, with no obvious peritumoral edema and almost no mass effect, suggesting a low-grade glioma based on cMRI (A, T2WI; B, T1WI + contrast). However, a high-grade glioma with a high focal max(Chol/Cr) ratio (mean max[Chol/Cr] in the tumoral region of 2.11, compatible with a high-grade glioma) was observed on CSI-MRS (superimposed metabolite graphic map) with TE = 270 msec (C). The tumor was pathologically proven to be a glioblastoma multiforme.](https://brieflands.com/journals/ijradiology/articles/56225/figures/iranjradiol-In_Press-In_Press-17817-i001-preview-preview.webp "This 22-year-old female was admitted due to recent seizure attacks and a relatively homogeneous non-enhancing intra-axial lesion in the right medial frontal lobe, with no obvious peritumoral edema and almost no mass effect, suggesting a low-grade glioma based on cMRI (A, T2WI; B, T1WI + contrast). However, a high-grade glioma with a high focal max(Chol/Cr) ratio (mean max[Chol/Cr] in the tumoral region of 2.11, compatible with a high-grade glioma) was observed on CSI-MRS (superimposed metabolite graphic map) with TE = 270 msec (C). The tumor was pathologically proven to be a glioblastoma multiforme.")
This 22-year-old female was admitted due to recent seizure attacks and a relatively homogeneous non-enhancing intra-axial lesion in the right medial frontal lobe, with no obvious peritumoral edema and almost no mass effect, suggesting a low-grade glioma based on cMRI (A, T2WI; B, T1WI + contrast). However, a high-grade glioma with a high focal max(Chol/Cr) ratio (mean max[Chol/Cr] in the tumoral region of 2.11, compatible with a high-grade glioma) was observed on CSI-MRS (superimposed metabolite graphic map) with TE = 270 msec (C). The tumor was pathologically proven to be a glioblastoma multiforme.
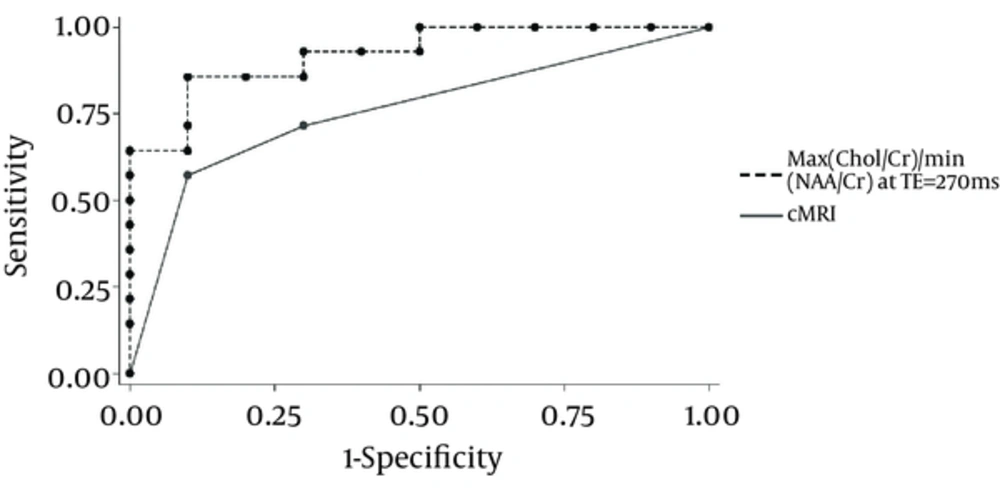
Comparison of cMRI and our most reliable MRS metabolite ratio in glioma grading ROC curves
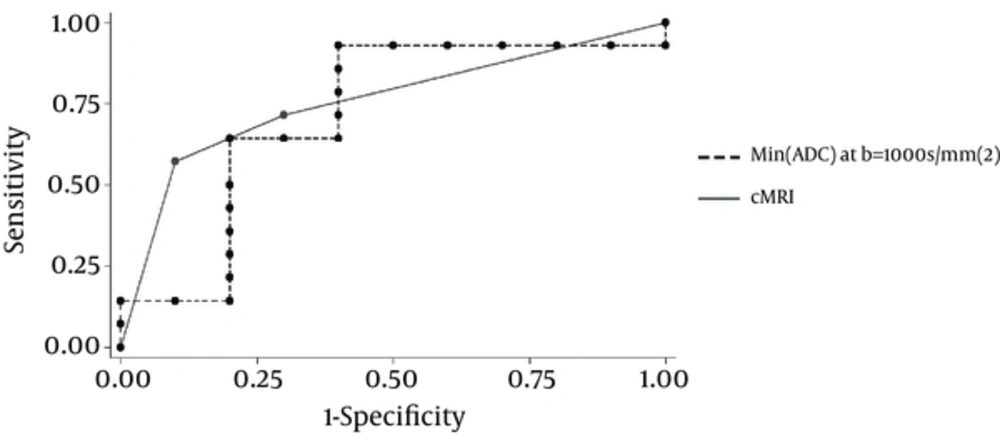
Comparison of cMRI and DWI ROC curves in glioma grading
