


1. Background
| Score | |
|---|---|
| Symptoms | |
| Migratory right iliac fossa pain | 1 |
| Nausea/Vomiting | 1 |
| Anorexia | 1 |
| Signs | |
| Tenderness in the right iliac fossa | 2 |
| Rebound tenderness in the right iliac fossa | 1 |
| Elevated temperature | 1 |
| Laboratory Findings | |
| Leukocytosis | 2 |
| Shift to the left of neutrophils | 1 |
| Total | 10 |
a5 - 6 → Possible; 7 - 8 → Probable; > 9 → Very probable.
2. Objectives
3. Patients and Methods
3.1. Patients
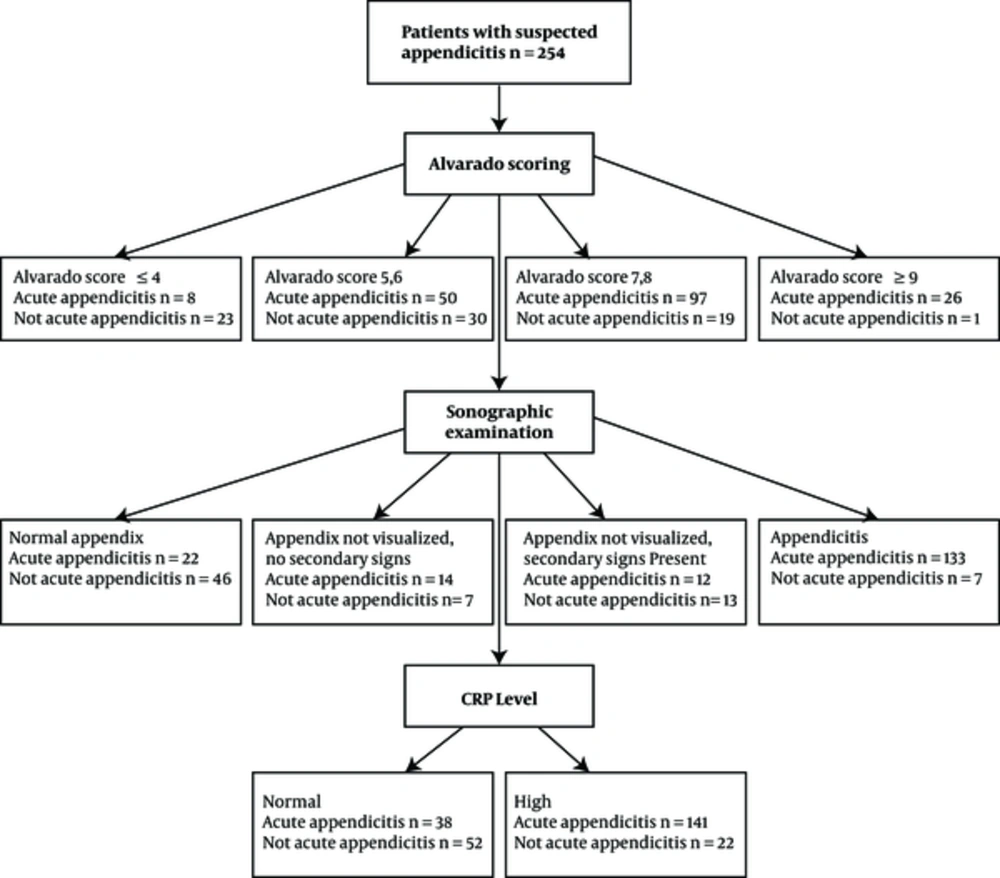
Flow diagram explaining patients’ distribution and evaluation process
3.2. Alvarado Scoring
3.3. CRP Levels
3.4. Sonographic Examination
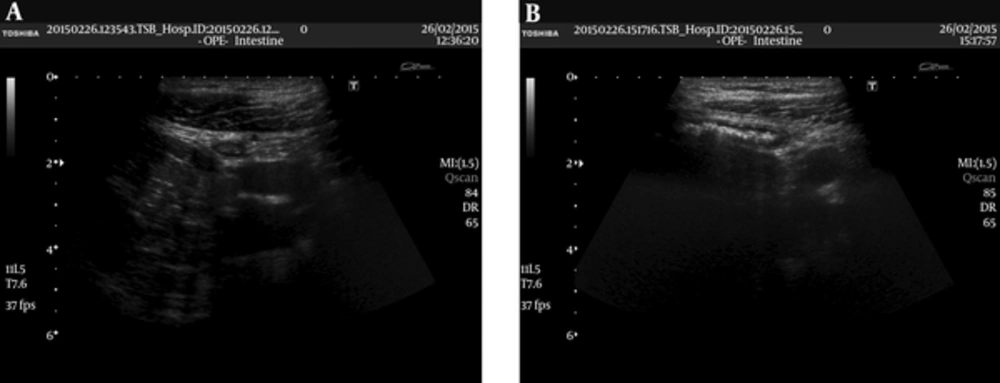
Normal appendix (A) transverse and (B) longitudinal views obtained with a 7 MHZ linear probe. There is no sign of inflammation/increased echogenity, lymph nodes or free fluid in surrounding tissue. The patient was included in US group 1. Appendix vermiformis is pathologically confirmed to be normal.
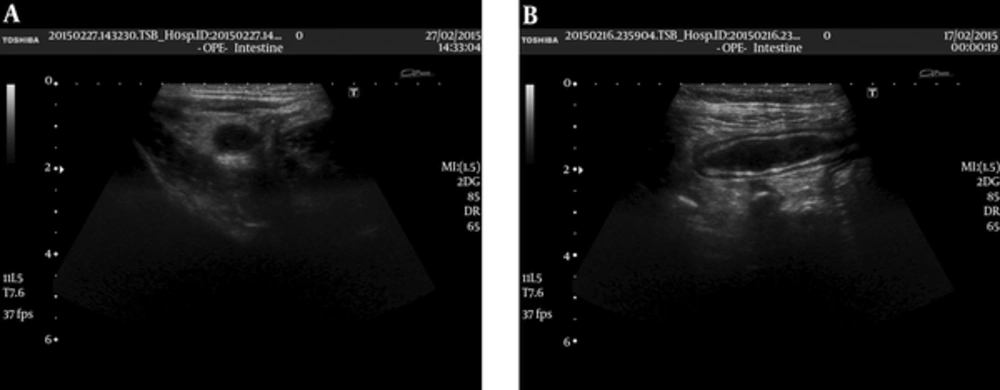
Inflamed appendix (A) transverse and (B) longitudinal views obtained with a 7 MHZ linear probe. Appendix vermiformis is enlarged and hypoechoic. Wall of the appendix is also enlarged. Periappendiceal fat is hyperechoic secondary to inflammation. The patient was included in US group 4. Appendix vermiformis is pathologically confirmed to be inflamed.
3.5. Diagnosis
3.6. Statistical Analysis
4. Results
4.1. Patients’ Diagnosis
4.2. Results of US Subgroups
| Ultrasound Group | Percentages (Numbers) |
|---|---|
| 1 | 26.8% (68/254) |
| 2 | 8.3% (21/254) |
| 3 | 9.8% (25/254) |
| 4 | 55.1% (140/254) |
4.3. Alvarado Scores
| Alvarado Score Group | Percentages (Numbers) |
|---|---|
| i | 12.2% (31/254) |
| ii | 31.5% (80/254) |
| iii | 45.7% (116/254) |
| iv | 10.6% (27/254) |
4.4. CRP Levels
| Ultrasound Groups | Alvarado Score Groups | Diagnosis | |||||||||
|---|---|---|---|---|---|---|---|---|---|---|---|
| 1 | 2 | 3 | 4 | i | ii | iii | iv | Acute Appendicitis | Not Acute Appendicitis | Any Other Clinical Diagnosis | |
| Middle CRP Levels (mg/L) | 0.5 | 3.3 | 2.0 | 3.5 | 0.7 | 1.9 | 3.5 | 5.3 | 3.8 | 0.7 | 0.4 |
Abbreviation: CRP, C - Reactive Protein.
| Pathologically Confirmed Acute Appendicitis (n = 181) | Pathologically Confirmed non Acute Appendicitis (n = 20) | Any Other Clinical Diagnosis (n = 53) | P Value | |
|---|---|---|---|---|
| Migratory right iliac fossa pain | 86 (47.5) | 3 (15) | 4 (7.5) | < 0.001b |
| Nausea / vomiting | 113 (62.4) | 8 (40) | 44 (83) | 0.001b |
| Anorexia | 143 (79) | 14 (70) | 43 (81.1) | 0.584 |
| Tenderness in right iliac fossa | 179 (98.9) | 20 (100) | 51 (96.2) | 0.348 |
| Rebound tenderness in right iliac fossa | 95 (52.5) | 9 (45) | 10 (18.9) | < 0.001b |
| Elevated temperature | 24 (13.3) | 2 (10) | 17 (32.1) | 0.008b |
| Leukocytosis | 151 (83.4) | 12 (60) | 22 (41.5) | 0.001b |
| Shift to the left of neutrophils | 156 (86.2) | 14 (70) | 25 (47.2) | 0.001b |
| Mean alvarado score (mean ± SD) | 7.1 ± 1.4 | 5.7 ± 1.5 | 5.3 ± 1.6 | 0.001b |
| Middle CRP levels | 3,8 (5.0) | 0.7 (1.8) | 0.4 (2,5) | < 0.001b |
| USc group 1 | 22 (12.2) | 1 (5.0) | 45 (84.9) | < 0.001b |
| US group 2 | 14 (7.7) | 4 (20.0) | 3 (5.7) | |
| US group 3 | 12 (6.6) | 8 (40.0) | 5 (9.4) | |
| US group 4 | 133 (73.5) | 7 (35.0) | 0 (0.0) |
aCategorical variables are shown as number (%).
bP < 0.05 statistical significance.
cUltrasound: US.
| Alvarado Score Components | Specificity (%95 C.I.) | Sensitivity (%95 C.I.) | NPV (%95 C.I.) | PPV (%95 C.I.) | Diagnostic Accuracy | AUC (%95 C.I.) |
|---|---|---|---|---|---|---|
| Migratory right iliac fossa pain | 90.40% (80.6% - 95.7%) | 47.50% (40.0% - 55.0%) | 41.00% (33.3% - 49.0%) | 92.50% (84.5% - 96.6%) | 59.8% | 0.690 (0.623 - 0.756) |
| Nausea/ vomiting | 28.80% (19.1% - 40.7%) | 62.40% (54.9% - 69.4%) | 23.60% (15.5% - 34.0%) | 68.50% (60.7% - 75.4%) | 52.8% | 0.456 (0.379 - 0.533) |
| Anorexia | 21.90% (13.4% - 33.4%) | 79.00% (72.2% - 84.5%) | 29.60% (18.3% - 43.8%) | 71.50% (64.6% - 77.5%) | 62.6% | 0.505 (0.426 - 0.583) |
| Tenderness inright iliac fossa | 2.70% (0.4% - 10.4%) | 98.90% (95.6% - 99.8%) | 50.00% (9.2% - 90.8%) | 71.60% (65.5% - 77.0%) | 71.3% | 0.508 (0.429 - 0.587) |
| Rebound tenderness inright iliac fossa | 74.00% (62.2% - 83.2%) | 52.50% (45.0% - 60.0%) | 38.60% (30.6% - 47.2%) | 83.30% (75.0% - 89.4%) | 58.7% | 0.632 (0.558 - 0.706) |
| Elevated temperature | 74.00% (62.2% - 83.2%) | 13.30% (8.8% - 19.3%) | 25.60% (20.0% - 60.0%) | 55.80% (40.0% - 70.6%) | 30.7% | 0.436 (0.356 - 0.517) |
| Leukocytosis | 53.40% (41.4% - 65.0%) | 83.40% (77.0% - 88.4%) | 56.50% (44.1% - 68.2%) | 81.60% (75.1% - 86.8%) | 74.8% | 0.684 (0.607 - 0.761) |
| Shift to the left of neutrophils | 46.60% (34.9% - 58.6%) | 86.20% (80.1% - 90.7%) | 57.60% (44.1% - 70.2%) | 80.00% (73.6% - 85.2%) | 74.8% | 0.664 (0.585 - 0.743) |
Abbreviations: AUC, area under curve; NPV, negative predictive value; PPV, positive predictive value; 95% C.I. , 95% confidence interval.
| Specificity (%95 C.I.) | Sensitivity (%95 C.I.) | NPV (%95 C.I.) | PPV (%95 C.I.) | Diagnostic Accuracy | AUC (%95 C.I.) | |
|---|---|---|---|---|---|---|
| US | 90.4% (80.7% - 95.7%) | 73.5% (66.3% - 79.6%) | 57.9% (48.3% - 67.0%) | 95.0% (89.6% - 97.8%) | 78.3% | 0.819 (0.764 - 0.875) |
| CRP ≥ 0.8 | 69.9% (57.8% - 79.8%) | 78.5% (71.6% - 84.1%) | 56.7% (45.8% - 66.9%) | 86.6% (80.1% - 91.2%) | 76.0% | 0.737 (0.658 - 0.816) |
| Alvarado Score ≥ 5 | 59.0% (46.8% - 70.1%) | 86.2% (80.0% - 90.7%) | 63.1% (50.6% - 74.4%) | 83.9% (77.6% - 88.9%) | 78.3% | 0.776 (0.711 - 0.841) |
| Combination 1 | 83.6% (72.6% - 90.8%) | 69.1% (61.7% - 75.6%) | 52.1% (42.8% - 61.4%) | 91.2% (84.9% - 95.2%) | 73.2% | 0.763 (0.699 - 0.827) |
| Combination 2 | 97.3% (89.6% - 99.5%) | 51.9% (44.4% - 59.4%) | 44.9% (37.1% - 53.0%) | 97.9% (91.9% - 99.6%) | 65.0% | 0.746 (0.687 - 0.816) |
Abbreviations: AUC, area under curve; CRP, C reactive protein; NPV, negative predictive value; PPV, positive predictive value; US, ultrasound.
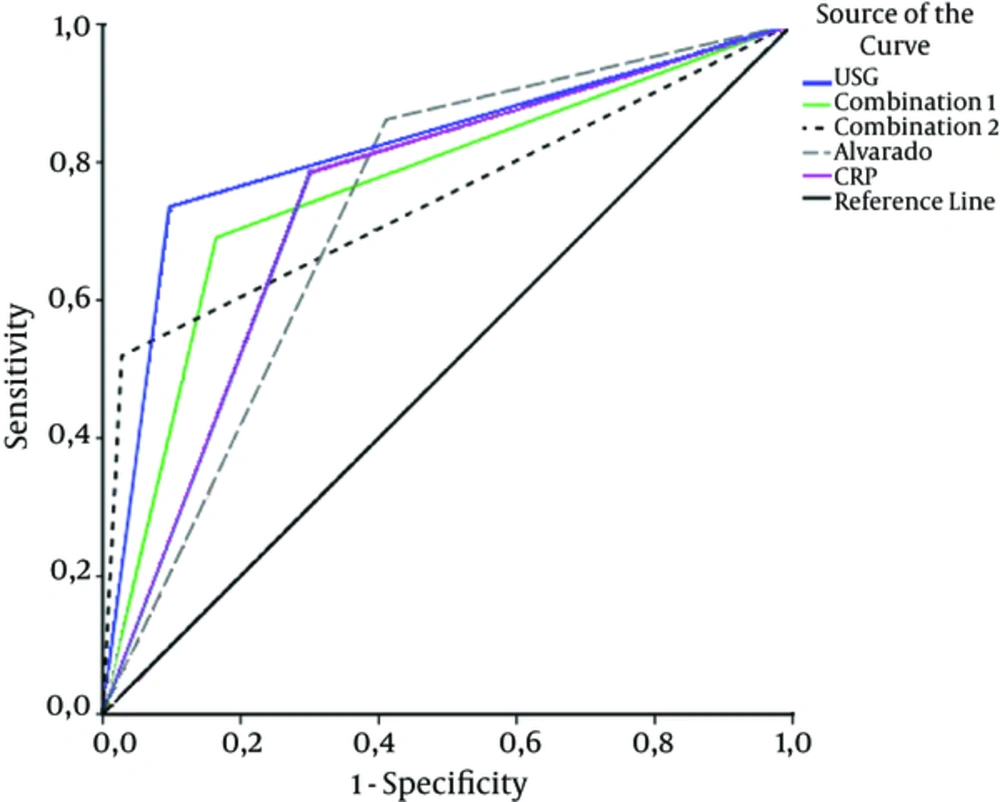
The curve showing diagnostic performances of the methods
