


1. Background
2. Objectives
3. Patients and Methods
3.1. Simulated Vessel Device
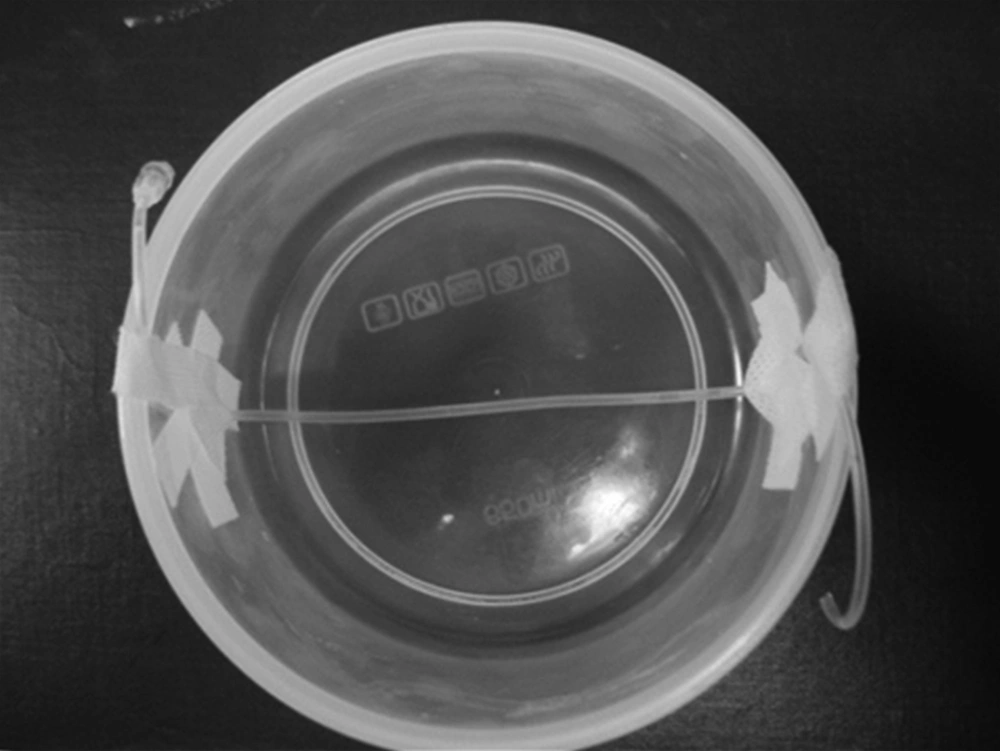
A simulated renal artery (catheter with interior diameter 0.2 cm) was installed in a round plastic container (diameter 15 cm).
3.2. Hypertension Patients
3.3. MR Angiography
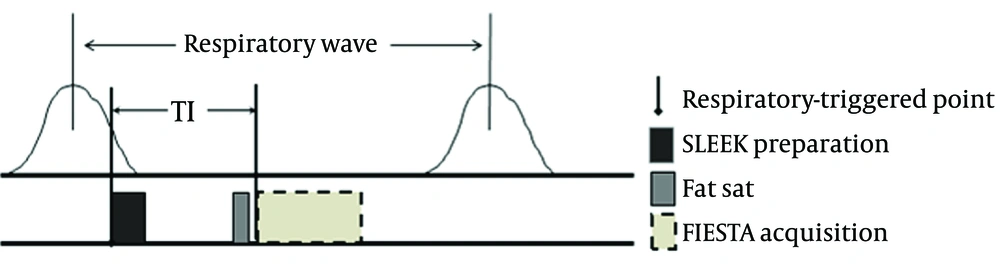
The diagrams of respiratory-triggered spatial labeling with multiple inversion pulses (SLEEK) pulse and signal acquisition with fat saturation 3D fast imaging employing steady-state (FS-3D-FIESTA) sequence.
3.4. Image Analysis
3.5. Statistical Analysis
4. Results
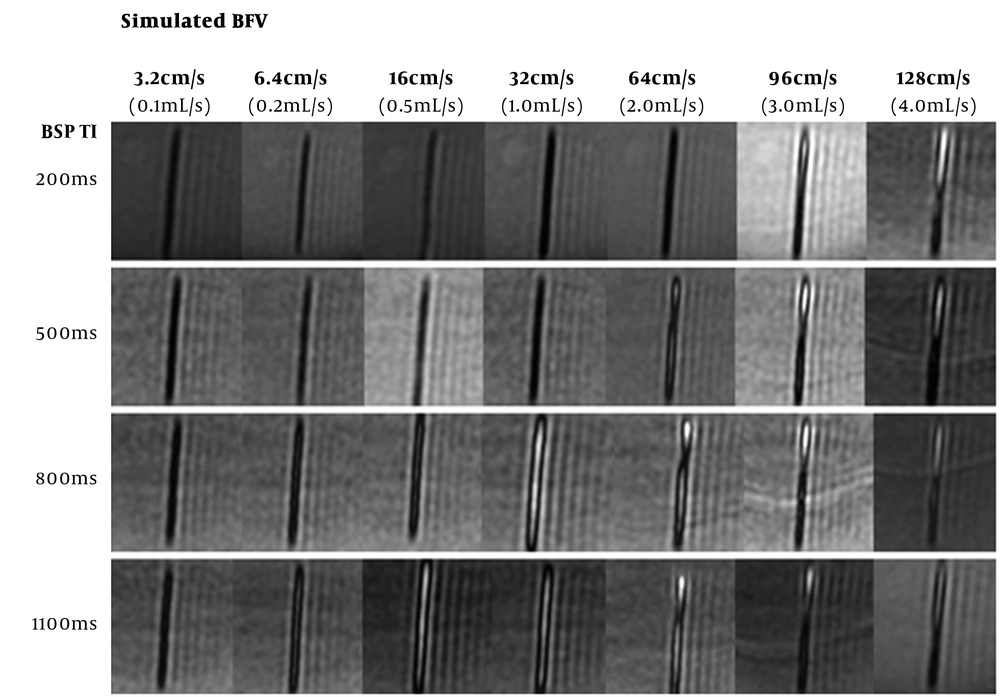
The appearance of the imitated renal artery with different blood flow velocity (BFV) by spatial labeling with multiple inversion pulses (SLEEK) with various blood suppression inversion time (BSP TI). The maximum signal to noise ratio (SNR) was found when BFV = 128 cm/s for BSP TI = 200 ms, BFV = 96 cm/s for BSP TI = 500 ms, BFV = 32 cm/s for BSP TI = 800 ms, and BFV = 16 cm/s for BSP TI = 1100 ms. The BFV had a negative relation with BSP TI was implied.
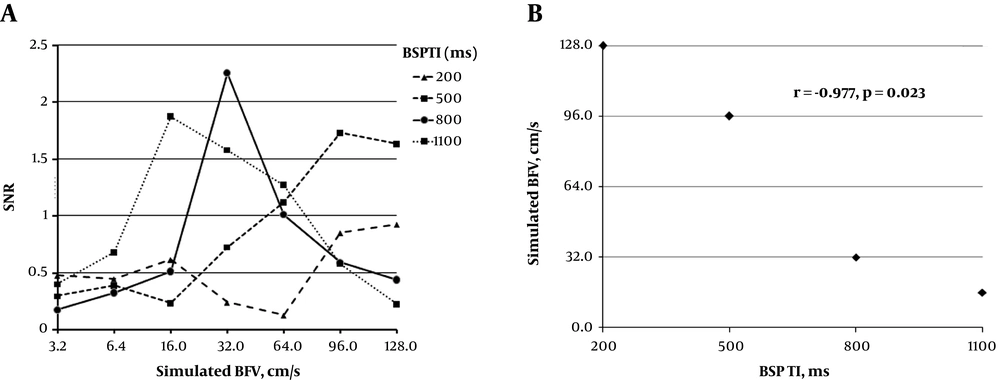
A, The signal to noise ratio (SNR) of the simulated renal artery with different blood flow velocities (BFV) by spatial labeling with multiple inversion pulses (SLEEK) with various blood suppression inversion times (BSP TI); B, Finding of the relationship between BSP TI and BFV. In A, the greatest SNR was 0.927 when BFV = 128 cm/s for BSP TI = 200 ms, 1.732 when BFV = 96 cm/s for BSP TI = 500 ms, 2.256 when BFV = 32 cm/s for BSP TI = 800 ms, and 1.875 when BFV = 16 cm/s for BSP TI = 1100 ms. In B, based on the highest SNR for each BSPTI, a negative correction between BFV and BSP TI was found in SLEEK sequence (r = -0.977, P = 0.023).
| BSP TI | Simulated BFV | ||||||
|---|---|---|---|---|---|---|---|
| 3.2 cm/s | 6.4 cm/s | 16 cm/s | 32 cm/s | 64 cm/s | 96 cm/s | 128 cm/s | |
| 200 ms | 0.476 | 0.447 | 0.616 | 0.238 | 0.126 | 0.852 | 0.927 |
| 500 ms | 0.296 | 0.388 | 0.232 | 0.725 | 1.119 | 1.732 | 1.633 |
| 800 ms | 0.178 | 0.327 | 0.515 | 2.256 | 1.013 | 0.592 | 0.442 |
| 1100 ms | 0.401 | 0.680 | 1. 875 | 1. 577 | 1.274 | 0.579 | 0.225 |
Abbreviations: BFV, blood flow velocity; BSP TI, blood suppression inversion time; SLEEK, spatial labeling with multiple inversion pulses; SNR, signal-to-noise ratio.
a SNR was the mean value of the greatest SNR for three measurements in different time points. Simulated BFV was calculated with the formula: The simulated BFV (cm/s) = flow rate (mL/s)/πr2, 3.2 cm/s = 0.1 mL/s; 6.4 cm/s = 0.2 mL /s; 16 cm/s = 0.5 mL/s; 32 cm/s = 1.0 mL/s; 64 cm/s = 2.0 mL/s; 96 cm/s = 3.0 mL/s; 128 cm/s = 4.0 mL/s.
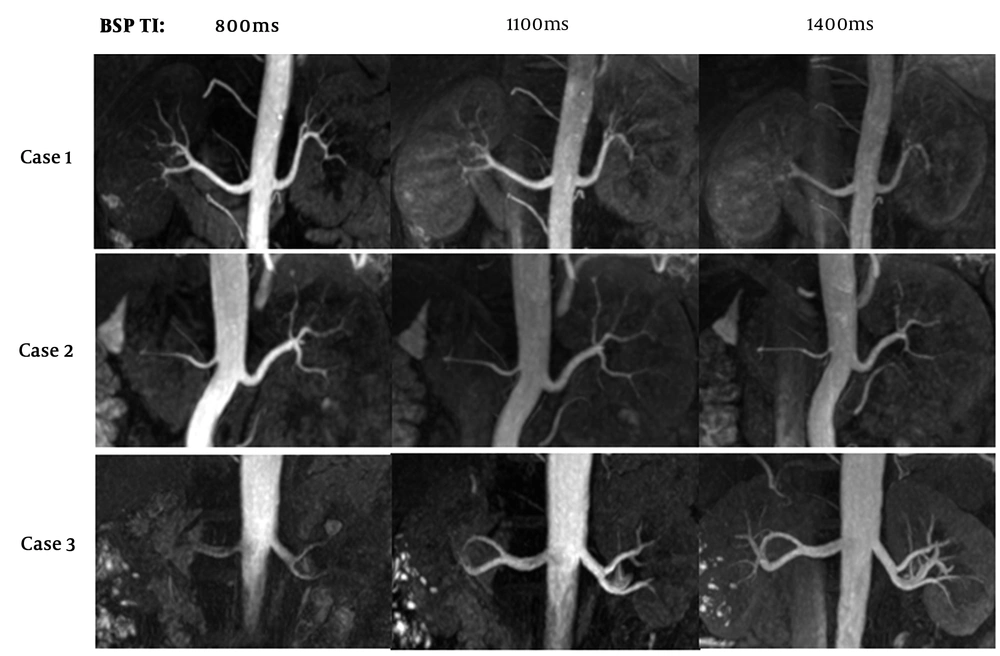
The optimal blood suppression inversion time (BSP TI) for best image quality of renal artery in spatial labeling with multiple inversion pulses (SLEEK) sequence in hypertension patients. In three hypertension male patients with similar height, weight and age, the best image quality was found when BSP TI was 800 ms in the first, 1100 ms in the second, and 1400 ms for the third patient, which suggested the optimal BSP TI was vital to improve the ability of presenting renal artery in SLEEK sequence.
| No. | Age (y) | Height (cm) | Weight (Kg) | The optimal BSP TI (ms) |
|---|---|---|---|---|
| 1 | 42 | 167 | 63 | 1400 |
| 2 | 49 | 166 | 61 | 1100 |
| 3 | 46 | 168 | 60 | 1100 |
| 4 | 40 | 166 | 65 | 800 |
| 5 | 44 | 168 | 63 | 1400 |
| 6 | 47 | 170 | 62 | 1400 |
| 7 | 41 | 170 | 60 | 800 |
| 8 | 47 | 167 | 63 | 1100 |
| 9 | 42 | 165 | 62 | 1100 |
Abbrevations: BSP TI, blood suppression inversion time; SLEEK, spatial labeling with multiple inversion pulses; SNR, signal-to-noise ratio.
a The optimal BSP TI (ms) was defined as the BSP TI with best renal artery image quality, which included best renal artery SNR, homogeneous vessel signal intensity, sharp and complete delineation of vessel borders, and showing clearly segmental branches in renal parenchyma.




