


1. Background
2. Objectives
3. Patients and Methods
3.1. Ultrasound Examination
3.2. Statistical Analysis
4. Results
4.1. Subjects’ Characteristics
| AHU (n = 43) | First gout attack (n = 48) | P value | |
|---|---|---|---|
| Age (year) | 41.67 ± 1.42 | 49.39 ± 2.34 | 0.005 |
| Sex (female) | 9 | 0 | |
| BMI (kg/m2) | 26.21 ± 0.43 | 25.73 ± 0.38 | 0.417 |
| SUA (μmol/L) | 495.70 ± 12.89 | 496.22 ± 19.62 | 0.982 |
| FPG (mmol/L) | 5.77 ± 0.20 | 5.28 ± 0.09 | 0.039 |
| LDL (mmol/L) | 3.20 ± 0.15 | 3.30 ± 0.12 | 0.630 |
| HDL (mmol/L) | 1.09 ± 0.03 | 1.02 ± 0.03 | 0.102 |
| TC (mmol/L) | 5.19 ± 0.20 | 5.01 ± 0.16 | 0.492 |
| TG (mmol/L) | 2.79 ± 0.43 | 2.09 ± 0.18 | 0.164 |
| GFR (mL/min × 1.73 m2) | 92.04 ± 3.22 | 86.24 ± 3.22 | 0.211 |
| HU duration (year) (mean range) | 3 (1, 5) | 4.5 (1, 6.75) | 0.358 |
Abbreviations: AHU, asymptomatic hyperuricemia; BMI, body mass index; FPG, fast plasma glucose; GFR, glomerular filtration rate; HDL, high density lipoprotein; HU, hyperuricemia; LDL, low density lipoprotein; SD, standard deviation; SUA, serum uric acid; TC, total cholesterol; TG, triglyceride.
aValues are expressed as mean ± SD, unless it was mentioned.
4.2. Ultrasound Findings
| AHU (n = 43) | First gout attack (n = 48) | P value | |
|---|---|---|---|
| Snow storm sign | 12 (28) | 44 (92) | < 0.001 |
| DC sign | 10 (21) | 14 (29) | 0.523 |
| Tophi | 1 (2) | 3 (6) | 0.619 |
| Bone erosion | 1 (2) | 6 (13) | 0.074 |
| Abnormal blood flow | 2 (5) | 40 (83) | < 0.001 |
Abbreviations: AHU, asymptomatic hyperuricemia; DC, double contour.
aValues are expressed as No. (%).
| AHU (n = 258) | First gout attack (n = 288) | P value | |
|---|---|---|---|
| Snow storm sign | |||
| 1st MTP | 19 (7.4) | 58 (20.1) | < 0.001 |
| Ankle | 1 (0.3) | 28 (10.8) | < 0.001 |
| Knee | 1 (0.3) | 6 (3.4) | 0.079 |
| DC sign | |||
| 1st MTP | 15 (5.8) | 14 (4.9) | 0.620 |
| Ankle | 3 (1.2) | 4 (1.4) | 0.815 |
| Knee | 2 (0.8) | 5 (1.7) | 0.326 |
| Tophi | |||
| 1st MTP | 1 (0.3) | 2 (0.7) | 0.628 |
| Ankle | - | 2 (0.7) | 0.501 |
| Knee | - | 2 (0.7) | 0.501 |
| Bone erosion | |||
| 1st MTP | 2 (0.8) | 7 (2.4) | 0.182 |
| Ankle | - | 5 (1.7) | 0.063 |
| Knee | - | 2 (0.7) | 0.501 |
| Abnormal blood flow | |||
| 1st MTP | 2 (0.8) | 30 (10.4) | < 0.001 |
| Ankle | - | 19 (6.6) | < 0.001 |
| Knee | - | 5 (1.7) | 0.063 |
Abbreviations: AHU, asymptomatic hyperuricemia; 1st MTP, first metatarsal-phalangeal joints
aValues are expressed as No. (%).
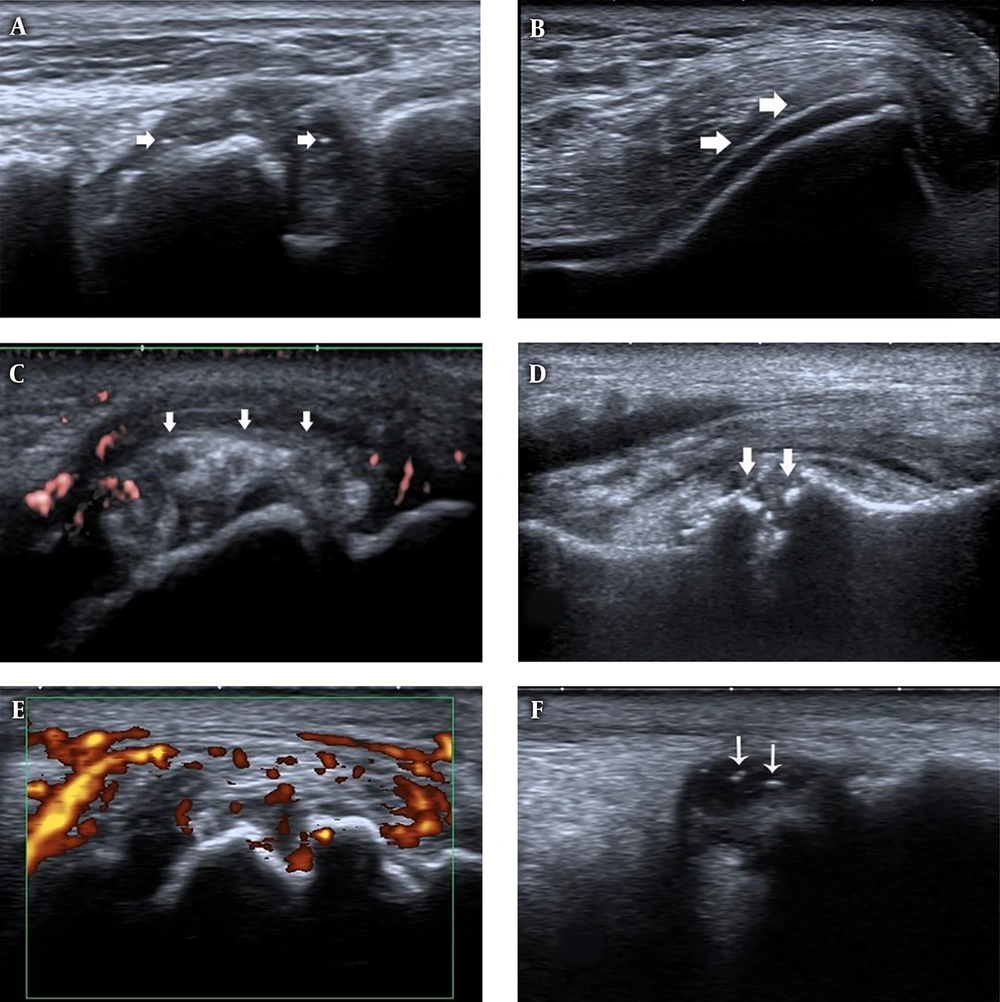
Ultrasound features of joints in first gout attack and asymptomatic hyperuricemia (AHU). A, First metatarso-phalangeal joints (1st MTP) longitudinal view, B-mode ultrasound shows synovial thickening and hyper echoic foci (white arrows) in patients with first gout attack. B, Knee transverse view, B-mode ultrasound shows double contour (DC) sign (white arrows) on the surface of the cartilage in patients with first gout attack. C, 1st MTP longitudinal view, tophi (white arrows) with surrounding power Doppler signal in patients with first gout attack. D, 1st MTP longitudinal view, bone erosion (white arrows) in patients with first gout attack. E, 1st MTP longitudinal view, synovial thickening and power Doppler signals in patients with first gout attack. F, Ankle longitudinal view, hyperechoic foci (white arrows) inside the synovial fluid.


