


1. Background
2. Objectives
3. Patients and Methods
3.1. Study Group
3.2. Computed Tomography Pulmonary Angiography
3.3. Magnetic Resonance Imaging
3.4. Image Interpretation
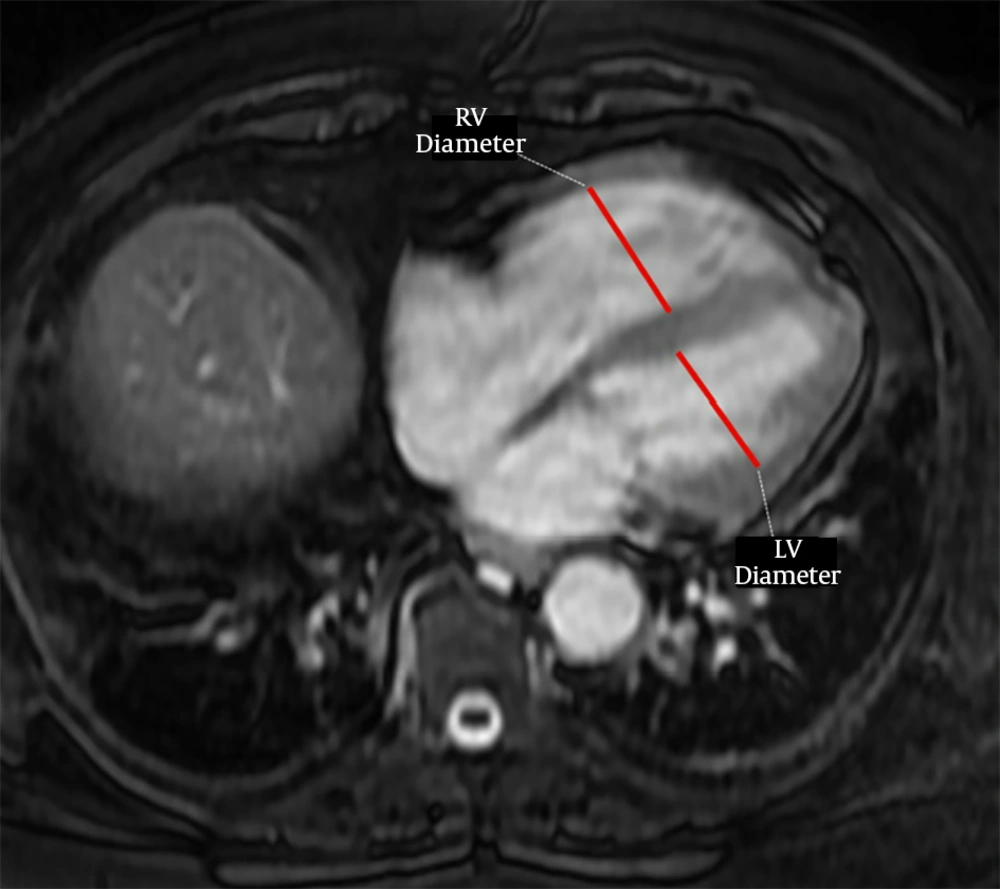
A 52-year-old male with pulmonary embolism and a pulmonary index of 47.5%, right ventricle (RV) and left ventricle (LV) diameter measurements on unenhanced MRI image
3.5. Statistical Analysis
4. Results
| All subjects | Pulmonary embolism (+) | Pulmonary embolism (-) | P value | |
|---|---|---|---|---|
| Number of subjects | 112 | 53 | 59 | |
| Gender, N | 0.011 | |||
| Female | 62 | 36 | 26 | |
| Male | 50 | 17 | 33 | |
| Age, y | 0.001 | |||
| Mean ± SD | 54.7 ± 14.2 | 59.2 ± 14 | 48.8 ± 12.4 | |
| PE index | ||||
| Median (range), % | 52.5 (5 - 77.5) | 52.5 (5 - 77.5) | - | |
| Interquartile range | 42.5 | 42.5 | - | |
| RV/LV ratio | 0.0001 | |||
| Median (range) | 0.91 (0.78 - 1.47) | 0.97 (0.81 - 1.47) | 0.87 (0.78 - 1.15) | |
| Interquartile range | 0.16 | 0.23 | 0.07 |
Abbreviations: PE index, pulmonary embolism severity index; RV/LV ratio, right ventricle to left ventricle ratio; SD, standard deviation.
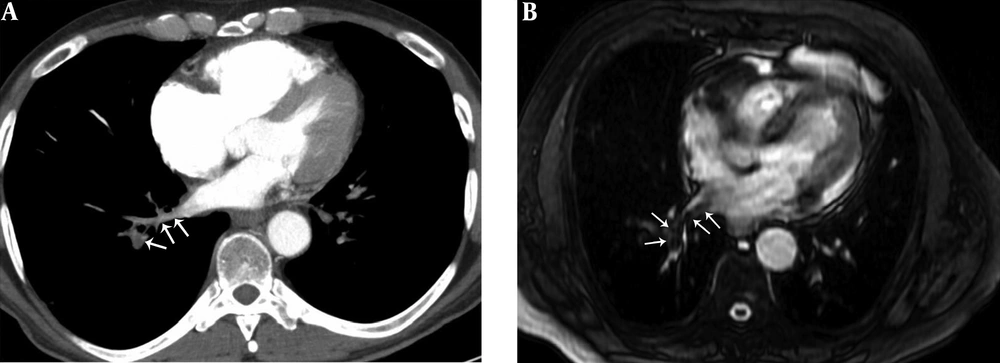
A 41-year-old male with pulmonary embolism and pulmonary embolism index was 75%. A, Axial contrast-enhanced computed tomography pulmonary angiography image shows hypoattenuating filling defect in the right lower lobe pulmonary vein (arrows). B, Axial unenhanced steady-state free precession (SSFP) magnetic resonance image shows hypointense filling defect in the right lower lobe pulmonary vein (arrows).
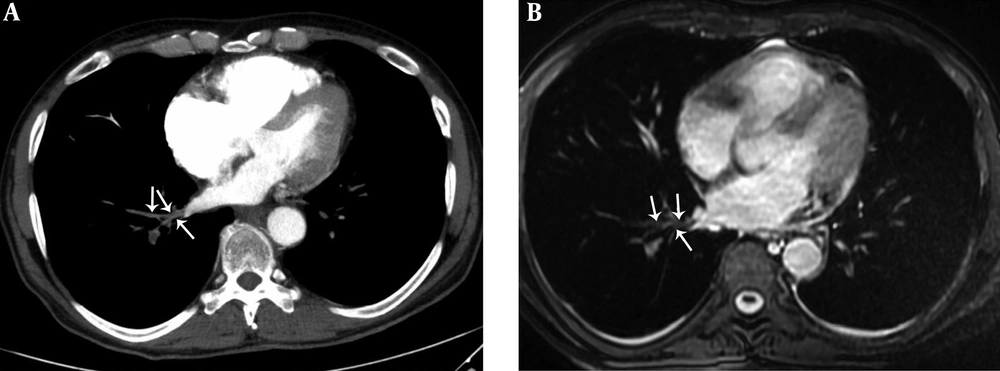
A 29-year-old male with pulmonary embolism and pulmonary embolism index was 62.5%. A, Axial contrast-enhanced computed tomography pulmonary angiography image shows hypoattenuating filling defect in the right lower lobe pulmonary vein (arrows). B, Axial unenhanced steady-state free precession (SSFP) magnetic resonance image shows hypointense filling defect in the right lower lobe pulmonary vein (arrows).
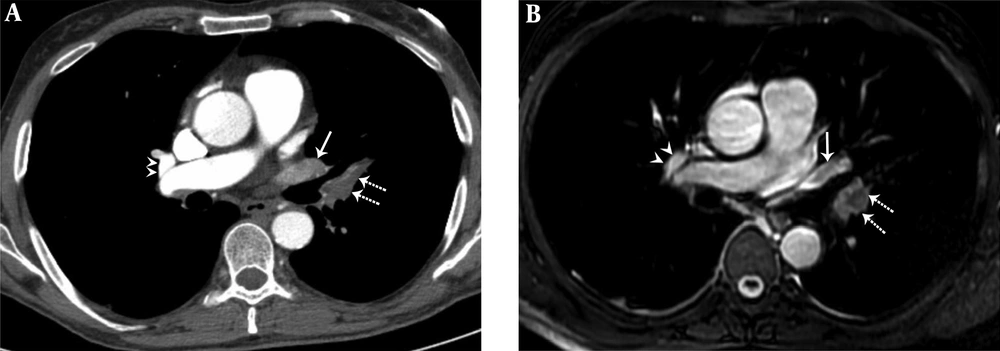
A 36-year-old female with pulmonary embolism and pulmonary embolism index was 80%. A, Axial contrast-enhanced computed tomography pulmonary angiography image shows hypoattenuating filling defect in the left upper lobe pulmonary artery (dashed arrows), hypoattenuating filling defect in the left upper lobe pulmonary vein (arrow). Normal contrast filling in the right upper lobe pulmonary vein is also seen (arrowheads). B, Axial unenhanced steady-state free precession (SSFP) magnetic resonance image shows hypointense filling defect in the left upper lobe pulmonary artery (dashed arrows) and hypointense filling defect in the left upper lobe pulmonary vein (arrow). Normal signal features in the right upper lobe pulmonary vein are also seen (arrowheads).
| Finding | Positive | Negative | P value |
|---|---|---|---|
| PVS on CTPA | 0.0001 | ||
| Number of subjects | 13 | 40 | |
| Median PE index | 67.5 | 37.5 | |
| Interquartile range | 3 | 16 | |
| PVS on MRI | 0.0001 | ||
| Number of subjects | 12 | 41 | |
| Median PE index | 67.5 | 43.75 | |
| Interquartile range | 3 | 16 | |
| RV/LV ratio > 1 | 0.026 | ||
| Number of subjects | 24 | 29 | |
| Median PE index | 57.5 | 37.5 | |
| Interquartile range | 10 | 18 | |
| RV/LV ratio > 1 or PVS | 0.003 | ||
| Number of subjects | 31 | 22 | |
| Median PE index | 57.5 | 32.5 | |
| Interquartile range | 8 | 18 | |
| RV/LV ratio > 1 and PVS | 0.001 | ||
| Number of subjects | 8 | 45 | |
| Median PE index | 67.5 | 47.5 | |
| Interquartile range | 2 | 16 |
Abbreviations: CTPA, computed tomography pulmonary angiography; MRI, magnetic resonance imaging; PE, pulmonary embolism; PVS, pulmonary vein sign, RV/LV ratio, right ventricle to left ventricle ratio.
| PE index | PVS and RV/LV > 1 | PVS on CTPA | PVS on MRI | RV/LV > 1 | RV/LV ratio | RV/LV > 1 and PVS on MRI | |
|---|---|---|---|---|---|---|---|
| PE index | |||||||
| r | - | 0.429a | 0.567a | 0.487a | 0.332b | 0.519a | 0.415a |
| P value | 0.0014 | < 0.0001 | 0.0002 | 0.0151 | 0.0001 | 0.0020 | |
| PVS and RV/LV > 1 | |||||||
| r | - | 0.523a | 0.560a | 0.911a | 0.782a | 0.448a | |
| P value | < 0.0001 | < 0.0001 | < 0.0001 | < 0.0001 | < 0.0001 | ||
| PVS on CTPA | |||||||
| r | - | 0.866a | 0.381a | 0.579a | 0.765a | ||
| P value | < 0.0001 | < 0.0001 | < 0.0001 | < 0.0001 | |||
| PVS on MRI | |||||||
| r | - | 0.344a | 0.482a | 0.8010 | |||
| P value | 0.0002 | < 0.0001 | < 0.0001 | ||||
| RV/LV > 1 | |||||||
| r | - | 0.837a | 0.492a | ||||
| P value | < 0.0001 | < 0.0001 | |||||
| RV/LV ratio | |||||||
| r | - | 0.612a | |||||
| P value | < 0.0001 | ||||||
| RV/LV > 1 and PVS on MRI | |||||||
| r | - | ||||||
| P value |
Abbreviations: CTPA, computed tomography angiography; MRI, magnetic resonance imaging; PE, pulmonary embolism; PVS, pulmonary vein sign, RV/LV ratio, right ventricle to left ventricle ratio.
aCorrelation is significant at 0.01 level.
bCorrelation is significant at 0.05 level.


