
1. Background
Diabetes is considered a major healthcare problem affecting more than 350 million people worldwide (1). Up to 90 to 95% of diabetes mellitus patients suffer from type 2 diabetes mellitus (T2DM) (2, 3). Diabetes, as a chronic metabolic disorder, increases the rate of morbidity and mortality and affects the quality of life (4). High blood glucose (hyperglycemia) in diabetic patients causes different types of complications and makes these individuals susceptible to diseases like Parkinson’s disease, nephropathy, Alzheimer’s diseases, atherosclerosis, and retinopathy (5).
In this regard, one of the most prevalent microvascular complications of T2DM is diabetic retinopathy (DR). It is the leading cause of blindness in adults (6). The pathophysiology of DR as a neurovascular disease is very complex and the underlying mechanisms are not fully understood (7). Hyperglycemia has long been considered an important factor contributing to the pathogenesis of DR (8). The DR could cause deregulated levels of metabolites (such as glucose, lipids, or hormones), increased vascular permeability, apoptosis, angiogenesis, and blood pressure (9). In addition to the aforementioned metabolic and cellular dysregulations, genetic factors are involved in the susceptibility to DR complications and incidence rates (10).
One of the key enzymes of the renin-angiotensin-aldosterone system (RAAS) is the angiotensin-converting enzyme (ACE, EC 3.4.15.1). Gene polymorphism of this enzyme has been correlated with the progression of hypertension and DR (11, 12). The ACE gene is located on chromosome 17q23 and consists of 25 introns and 26 exons (13). Besides, ACE is responsible for the conversion of angiotensin I to angiotensin II (a potent vasoconstrictor) and inactivates bradykinin (a vasodilator) (14, 15). There is a 287-base pair (bp) DNA sequence within intron 16 of the ACE gene which its insertion (I allele) or deletion (D allele) is the common polymorphism of this gene (16). Numerous studies indicated that a higher risk of different T2DM complications threatens the carriers of the D allele, including coronary artery disease (17), diabetic nephropathy (18), and retinopathy (19), when compared to carriers of I allele.
The simultaneous presence of different genotypes of a gene in a population is called genetic polymorphism. This property may vary among different ethnic groups.
2. Objectives
We aimed to investigate the possible correlation between ACE gene insertion/deletion (I/D) polymorphism and susceptibility to DR among Iranian diabetic patients who were living in Ahvaz province (southwest of Iran).
3. Methods
3.1. Sample Collection
All chemicals were purchased from Merck Company (Germany), and all enzymes were purchased from Thermo Fisher Scientific (Waltham, MA, USA) unless otherwise stated. This study was conducted on patients admitted to the Hospitals of Ahvaz Jundishapur University of Medical Sciences (Khuzestan province, Iran) and performed with an analytical case-control method. The study population with type 2 diabetes was classified as the case group with retinopathy (99 people) and the control group without retinopathy (96 people). All participants were given appropriate information concerning the study objectives. They filled informed consent forms to participate in the study. Moreover, the study was approved by the local ethics committee. The WHO criteria were employed to diagnose type 2 diabetes and retinopathy in patients. Screening for DR was performed by ophthalmologists using clinical examination and fluorescein angiography. In both groups, sex frequency was equal, and the age difference between all subjects in the study was observed to be ± 5. The exclusion criteria included patients with type 1 diabetes, diabetic nephropathy, history of myocardial infarction, stroke, patients with past or active retinal or optic nerve disorders, angina pectoris, primary open-angle glaucoma, peripheral vascular diseases, hypertrophic cardiomyopathy, neuropathy, or microalbuminuria of a morning urine sample, people with serum CRP higher than 2 mg/L according to the criteria of the U.S. Centers for Disease Control and Prevention and the American Heart Association, and people who did not agree to participate in the study. Moreover, patients of this study did not have any symptoms of cardiovascular disease or history of other acute and/or chronic diseases, except type 2 diabetes with or without retinopathy.
3.2. ACE Genotypes Determination
Venous blood mixed with EDTA as the anticoagulant was obtained from all subjects, and the genomic DNA was extracted by a saturated salt method using Nucleon BACC2 kit made by Tepnel Life Sciences Co. (Manchester, U.K). The PCR with specific primers was used to amplify the ACE I/D gene polymorphism (5´-CGTGAGACCACTCCCATCCTTTCT-3´ for forward primer and 5´-GATGTGGCCATCACATTCGTCAGAT-3´ for reverse). Then, the I and D alleles were determined by the amplification of two 490 and 190 bp amplicons, respectively. To amplify the genes, a Tekken thermocycler was used. The final volume of the reaction mixture was 50 µL, which included 50 ng of each primer, 500 µM of dNTP, one unit of PUF enzyme, 3 mM magnesium chloride, 100 ng of genomic DNA (template), and PCR buffer. The thermocycling procedure consisted of an initial denaturation at 95°C for 5 min, followed by 35 cycles of denaturation at 95°C for 30 s, annealing at 67°C for one minute, and extension at 72°C for 2 min. Ultimately, PCR products were separated by 2% agarose electrophoresis according to a method described previously (20).
The D allele amplification is preferentially much more than the I allele amplification in heterozygous samples due to the ability of this allele to mask the presence of I alleles. Therefore, the samples, which were known as DD genotype in the first PCR products on the agarose gel, were used for the second independent PCR amplification with specific I allele primers (5´-TCGGACCACAGCGCCCGCCACTAC-3´ for forward primer and 5´-TCGCCAGCCCTCCCATGCCCATAA-3´ for reverse). The second PCR conditions were similar to the first one, except for an annealing temperature which was set at 67°C. The second PCR amplicon was a 335-bp fragment which only could be found if an I allele existed. No PCR product would appear in homozygous samples for DD.
3.3. Statistical Analysis
The sample size was determined by a confidence interval of 95% (Za = 1.96) and a test power of 90% (Zb = 1.78). Description of the data was performed using one or two-dimensional frequency distribution tables, and the groups were compared by unpaired-student t test. Moreover, the Hardy-Weinberg equilibrium assumption (by chi-square test) was used to predict the values, which were then compared with the frequencies of genotypes (DD, II, and DI). All samples were determined with odds ratios to evaluate the association between ACE genotypes and the phenotype of type 2 diabetes with retinopathy. Significant results were considered those with P < 0.05. The SPSS version 16 software was used to carry out the statistical analyses.
4. Results
4.1. Characteristics of Study Subjects
In this study, 195 patients with type 2 diabetes, who had been admitted to the Hospitals of Ahvaz Jundishapur University of Medical Sciences (Khuzestan province, Iran), were divided into two groups: (1) without retinopathy (control group, n = 96) with the age range of 47 to 60; and (2) with retinopathy (n = 99) with the age range of 48 to 62. As shown in Table 1, the mean age was within the same range in both T2DM and T2DMR groups, and there was no significant difference between them (P > 0.05). Table 1 shows the demographic and clinical features of the participants. As Table 1 shows, the number of male participants was 50 in the control group and 61 in the case group. Moreover, the distributions of recognized risk factorslike total cholesterol, Body Mass Index (BMI), Fasting Blood Sugar (FBS), triglycerides (TG), serum creatinine, systolic blood pressure, high-density lipoprotein (HDL), low-density lipoprotein (LDL), mean platelet volume (MPV), platelet (PLT), and platelet distribution width (PDW) are listed in the case and control groups. As indicated, there were no significant differences between the two study groups concerning the prevalence of the aforementioned risk factors (P > 0.05).
Table 1.
Biochemical and Demographic Characteristics of T2DM and T2DMR Individuals
| Variables | T2DM (n = 96) | T2DMR (n = 99) | Significance |
|---|---|---|---|
| Gender (% male) | 50/49 | 61/38 | NS |
| Mean age (y) | 54.1 | 51.66 | NS |
| BMI (kg/m2) | 28.65 ± 0.89 | 27.42 ± 0.36 | NS |
| Total cholesterol (mg/dL) | 201.33 ± 6.66 | 187.53 ± 7.53 | NS |
| TG (mg/dL) | 227.76 ± 17.79 | 147.46 ± 24.3 | NS |
| FBS (mg/dL) | 166.46 ± 13.64 | 171.66 ± 15.43 | NS |
| Serum creatinine (µmol/L) | 1.00 ± 0.04 | 0.97 ± 0.06 | NS |
| HDL (mg/dL) | 59.96 ± 1.92 | 58.40 ± 5.33 | NS |
| LDL (mg/dl) | 95.8 ± 4.50 | 97.03 ± 8.15 | NS |
| Systolic blood pressure (mmHg) | 132.50 ± 2.01 | 125.00 ± 1.62 | NS |
| PLT (10+3/µl) | 258.76 ± 10.32 | 254.06 ± 15.29 | NS |
| MPV (fL) | 9.72 ± 0.16 | 9.43 ± 0.34 | NS |
| PDW (fL) | 12.55 ± 0.28 | 12.46 ± 0.69 | NS |
Abbreviations: M/F, male and female; T2DM, control group with type 2 diabetes mellitus; T2DMR, case group with type 2 diabetes mellitus and retinopathy; NS, not significant.
4.2. Genotype and Phenotype Association
The PCR was performed successfully, and the resultant products were as anticipated (Figure 1). The ACE D/I genotype and allele frequencies in both groups are shown in Table 2, according to the participant’s status (case or control). The distributions of ACE D/I genotypes (DD, DI, and II) were 19.8, 60.4, and 19.8% in the control group, which had T2DM without retinopathy, while they were 39.4, 48.5, and 12.1% in the case group which had T2DM with retinopathy, respectively.
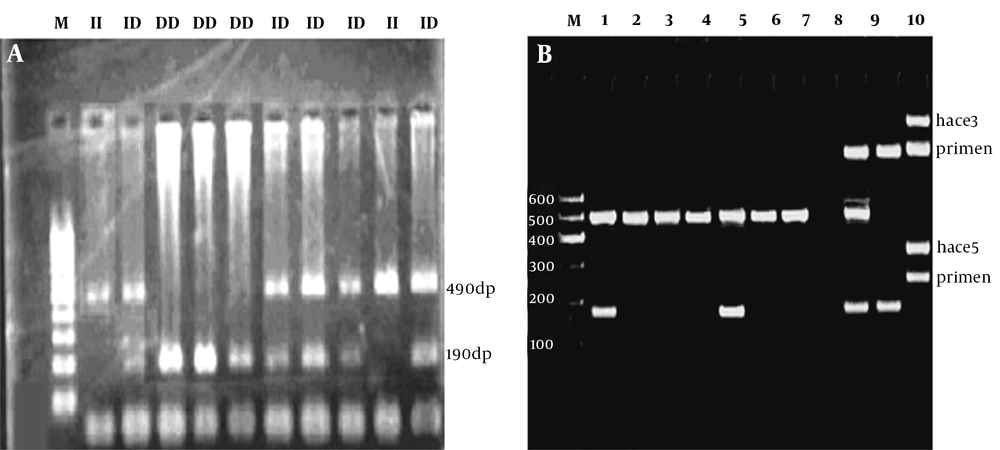
Figure 1.
The PCR amplification results to determine ACE Genotypes. A, ACE I/D deletion polymorphism is analyzed in this figure (M: 100 - 1000 bp Thermo Fisher Geneuler (the same ladder is used for both A and B); II: homozygous; ID heterozygous; DD homozygous; B, using a primer specific for insertion could incorrectly assign the DD genotype to DI samples. Using the hace3 primer pair, the lanes 1 through 6 are determined to be DD. These lanes are followed by standards for DD, blank control, DI, and II (lanes 7, 8, 9, and 10, respectively). Lane 9 is a DI standard, which shows the I band in comparison with preferential amplification of the D band; the faint line below the band is a presumed hetero-duplex band. The same samples, which are amplified with the hace5 primer pair, are shown at the bottom. These samples are able to recognize the insertion specific sequences. In lane 5, there is a sample, which was previously misclassified as DD.
Table 2.
Comparison of Association Between Angiotensin-Converting Enzyme Genotypes and Phenotypes (T2DM and T2DMR Groups) a
| No. (%) | Odds Ratio (95% CI) | P Value b | ||
|---|---|---|---|---|
| T2DM (n = 96) | T2DMR (n = 99) | |||
| Genotypes frequency | ||||
| DD | 19 (19.80) | 39 (39.40) | - | - |
| DI | 58 (60.40) | 48 (48.50) | 2.480 (1.271 - 4.840) | 0.007 |
| II | 19 (19.80) | 12 (12.1) | 3.250 (1.312 - 8.051) | 0.01 |
| Alleles frequency | ||||
| D | 96 (50.00) | 126 (63.63) | - | - |
| I | 96 (50.00) | 72 (36.36) | 1.750 (1.167 - 2.623) | 0.007 |
Abbreviations: T2DM, control group with type 2 diabetes mellitus; T2DMR, case group with type 2 diabetes mellitus and retinopathy; CI, confidence interval.
a Odds ratios and P values for different genotypes.
b Compared with DD genotype or D allele.
The chi-square test revealed that all subjects in both case and control groups were consistent with the predicted Hardy-Weinberg equilibrium (P > 0.05). The genotype frequency distribution (P = 0.009) showed a significant difference between the case and control groups. As depicted in Table 2, the risk estimate analysis showed that having a DD genotype made diabetic patients approximately 2.5 folds and 3.25 folds more susceptible to DR when compared to DI and II genotypes, respectively (odds ratios in Table 2). As Table 2 shows, the frequency distribution of I and D alleles was 50.00% in patients with type 2 diabetes without retinopathy. It means that their distribution was equal in the control group, whereas the frequency distribution of the I allele was about 36.36% in patients with type 2 diabetes and retinopathy, and the D allele distribution was 66.66% in the same patients. The results showed that having a D allele made diabetic individuals nearly 1.75 folds more susceptible to DR than possessing an I allele.
5. Discussion
Blindness, as a consequence of DR, is one of the most terrible tragedies of this disease (21). Although a huge number of studies have been conducted to explore the underlying mechanisms of DR, the exact etiology of this complication still remains obscure. Pan-retinal laser photocoagulation (PRP) is the only approved treatment for patients who are suffering from DR, but PRP is not always beneficial and sometimes may endanger the patients due to serious side effects (22). Accordingly, extensive and intensive research is needed to elucidate strategies to prevent, diagnose, and consequently cure DR.
The DR etiology is based on different biochemical, cellular, and genetic dysregulations (23). In this study, we explored the possible association between the risk of DR and ACE gene insertion/deletion (I/D) polymorphism. The ACE gene product is an enzyme that activates the renin-angiotensin-enzyme system (RAAS); as a result of its action, the blood pressure is increased (11). An important risk factor for the development of DR is persistently high blood pressure (hypertension) (24). Numerous studies have shown that ACE inhibitors have therapeutic benefits against diabetes complications (25-27). The results of this study showed that the frequency of the DD genotype in diabetic patients with retinopathy was higher than that in diabetic individuals without retinopathy. Moreover, we showed a strong correlation between having a DD genotype of the ACE gene and susceptibility to DR in Iranian patients who were living in Ahvaz province. Interestingly, our results indicated a direct relationship between being a carrier of the D allele and the risk for DR (Table 2). Our results are concomitant with previous studies conducted among Iranian diabetic patients (19, 28).
Some studies showed that individuals who are carrying the DD genotype of the ACE gene have more plasma ACE activity and also are more susceptible to T2DM and its complications when compared to II or ID carriers (17, 18, 29, 30). Furthermore, it has been indicated that ACE gene insertion/deletion polymorphism is responsible for more than 50% of plasma ACE activity (31). Moreover, angiotensin II, as the product of the ACE activity, induces the formation of new retinal blood vessels via the upregulation of the vascular endothelial growth factor (VEGF) (32). Besides, inflammation is one the most important factors contributing to DR development, which is induced by inflammatory mediators such as interleukin-1β and angiotensin II (33). Consequently, having the DD genotype of the ACE gene may aggravate retinal complications through increasing ACE activity.
On the other hand, some other studies have reported a direct correlation between the II genotype and T2DM (34). This controversy can be partly attributed to the ethnic background in different parts of the world. Moreover, different protocols to perform the experiments and numerous criteria for the selection of patients are among the most important challenges for this type of study.
We demonstrated that the D/I polymorphism of the ACE gene may be one of the main contributors to the pathogenesis of DR. Having a DD genotype made diabetic patients more susceptible to DR than possessing D/I or II genotypes. Our study was carried out in Ahvaz province as a unique population in the southwest of Iran. Iran is the land of ethno-diversity, and it makes necessary to perform comprehensive studies in different parts of the country to understand the roles played by ACE gene polymorphism in the etiology of DR.
5.1. Conclusion
Given the obtained results, it could be hypothesized that the DD genotype and D allele of the ACE gene might play a role in the pathogenesis of DR. Having a DD genotype makes diabetic patients more susceptible to DR than possessing D/I or II genotypes.