
1. Background
Spinal anesthesia is a common, inexpensive, and rapid method (1). Although regional anesthesia provides excellent analgesia, some patients avoid this method due to fear of needle pain, back pain, and being awake during the operation (2).
Some patients refuse or are dissatisfied with spinal anesthesia because of fear of backache and needle pain (3, 4). Studies show that needle pain is a cause of needle fear that affects 10% to 48.7% of patients scheduled for regional anesthesia (2, 5, 6).
Among 1,191 cases of spinal anesthesia, 96.3% of patients expressed satisfaction. That dissatisfaction was associated with paresthesia at the puncture site during the spinal anesthesia (4). In recent years, pain management has become a human right (7, 8). Therefore, a solution should be found to reduce needle-related pain in regional anesthesia. There are 5Ps interventions, including pharmacological, physical, procedural, psychological, and process for pain management of painful needle procedures (9). Based on the gate control theory, this study used physical intervention with local pressure to reduce the needle pain in spinal anesthesia. Katz and Rosenbloom (as cited by Melzack and Wall) described the gate control theory in 1965 (10). This theory explains how stimulations, such as touch, warmth, vibration, or pressure, can modulate pain (11, 12). This theory has an inhibitory effect on pain afferent fibers (13). It is an innovative approach to reduce needle pain by applying local pressure. Local pressure induces large-fiber activity and exerts an inhibitory effect by closing the gate that transmits pain, whereas pain pulses through activation of small-fiber facilitate or open the gate that transmits pain to the brain (13, 14). This is similar to how transcutaneous electrical nerve stimulation (TENS) produces analgesia or reduces pain (15, 16).
2. Objectives
This clinical trial intends to investigate local pressure's effect on reducing needle pain based on the gate control theory in spinal anesthesia. This study highlights the effect of local pressure and introduces a new approach to reduce the pain caused by needling in spinal anesthesia by applying gate control theory.
3. Methods
This single-blind randomized controlled trial (RCT) study was performed at the educational hospitals of Hamedan University of Medical Sciences in Hamadan (west of Iran). The study was confirmed in Iran clinical trial database with IRCT20121219011822N7 ID.
Patient recruitment and flow through the study are shown in Figure 1. Demographic variables, underlying disease, spinal anesthesia history, and drug use as illicit were asked of patients.
Inclusion criteria included patients aged 18 to 50 who were candidates for elective surgery under spinal anesthesia. Exclusion criteria were refusal to participate, patients with American Society of Anesthesiologists (ASA) IV or more, multiple puncture (needling) attempts, history of spine surgery, pre-existing history of chronic pain or back pain, and history of psychological disorder.
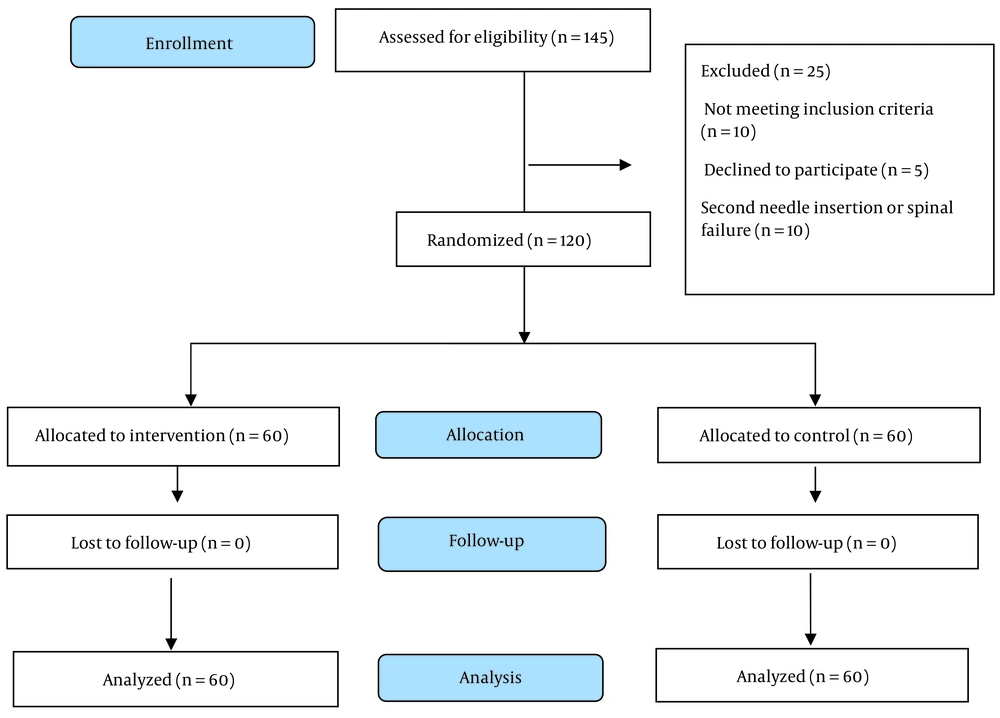
Figure 1.
CONSORT flowchart detailing patient recruitment.
3.1. Intervention, Evaluation, and Follow-up Method
In intervention and control groups, patients were instructed to report the intensity of the needle pain promptly after removing the spinal needle. Sedation and local anesthesia were not used as part of the procedure. After the patient assumed the sitting position and received prepping and draping, the experienced anesthesiologist performed spinal anesthesia using a 24-gauge Quincke needle. In the intervention group, before inserting the spinal needle, a local pressure of about 5 kg with the thump finger was applied to the needle entry site for 15 seconds, and immediately the spinal needle was inserted. To equalize the pressure, the participant anesthesiologist in this study repeatedly experienced a pressure of 5 kg with the thumb on the scale.
The pressure was not applied in the control group, and spinal anesthesia was performed as usual.
Immediately after withdrawing the spinal needle from the skin, the severity of needle pain was evaluated by the verbal rating scale (VRS) tool. The VRS is self-report and suitable (17, 18), and its strengths are rapid completion, conceptually simple, high compliance rates, and easy to score (18). According to the VRS tool, patients requested to describe the pain intensity induced by needling with terms: No pain, mild, moderate and severe, and very severe.
3.2. Randomization and Blinding
Samples were randomly assigned to four blocks using random allocation software. Blocking and allocation sequences for concealment were performed by a researcher uninvolved in the study. The sample allocation ratio was 1:1 and divided into intervention (receiving local pressure) and control (no pressure) groups. Patients were randomized to control or intervention based on the blocks and allocation sequences. This study is single-blinded because the anesthesiologists know which patients receive local pressure before spinal anesthesia. However, the participants are unaware of whether applying pressure is a routine method. They think that this pressure is applied to all patients.
3.3. Ethical Considerations
This study was approved by the ethics committee of Hamadan University of Medical Sciences with ID IR.UMSHA.REC.1400.306 in 2021-07-10. Also, informed written consent was obtained from all patients.
3.4. Statistical Analysis and Sample Size
The sample size of control and intervention groups was calculated to have 80% power to find a 30% difference in pain severity between groups, assuming a type I error of 0.01. Thus, the sample size was 120 patients using G-power software divided into two equal groups. Quantitative variables using mean and standard deviation and qualitative variables using frequency and percentage were analyzed. Independent t-test and chi-square test were used to compare quantitative and qualitative variables, respectively. A regression logistic test was used to compare the severity of pain in two groups and to predict the effective variables. A P-value smaller than 0.05 was considered. Data were analyzed by SPSS version 16.
4. Results
The results show that patients in both control and intervention groups have no significant statistical difference in gender, marriage, education, occupation, residence place, mean age, and body mass index (Table 1).
Table 1.
Baseline Characteristics of Patients in Both Groups a
| Variables | Control Group (n = 60) | Interventional Group (n = 60) | P |
|---|---|---|---|
| Sex | |||
| Male | 34 (56.7) | 26 (43.3) | 0.144 b |
| Female | 26 (43.3) | 34 (56.7) | |
| Marital status | 0.166 b | ||
| Married | 38 (63.3) | 45 (75.0) | |
| Single or divorce | 22 (36.7) | 15 (25.0) | |
| Education (y) | 0.636 b | ||
| ≤ 5 | 15 (25.0) | 17 (28.3) | |
| 5 - 12 | 21 (35.0) | 24 (40.0) | |
| ≥ 12 | 24 (40.0) | 19 (31.7) | 0.500 b |
| Resident | 0.816 | ||
| Urban | 48 (81.4) | 47 (79.7) | |
| Rural | 11 (18.6) | 12 (20.3) | |
| Previous spinal anesthesia | 0.256 b | ||
| No | 25 (41.7) | 19 (31.7) | |
| Yes | 35 (58.3) | 41 (68.3) | |
| Underline disease (diabetes, lipid disorder, or hypertension) | 0.729 b | ||
| No | 55 (91.7) | 56 (93.3) | |
| Yes | 5 (8.3) | 4 (6.7) | |
| Smoking | 0.444 b | ||
| No | 41 (68.3) | 37 (61.7) | |
| Yes | 19 (31.7) | 23 (38.3) | |
| Substance abuse | 0.086 b | ||
| No | 52 (86.7) | 43 (74.1) | |
| Yes | 8 (13.3) | 15 (25.9) | |
| Age (y) | 34.0 ± 9.7 | 33.6 ± 8.7 | 0.787 c |
| BMI (kg/m2) | 25.6 ± 2.5 | 10.4 ± 4.1 | 0.200 c |
Abbreviations: BMI, body mass index; SD, standard deviation.
a Values are expressed as No. (%) or mean ± SD.
b Chi-square or Fisher exact test.
ct-test.
There is a statistically significant difference between both groups in terms of the needle pain intensity. Participants did not report "no pain" and "very severe pain" in the control and intervention groups with the VRS tool. The incidence of mild pain in the intervention and control groups is 78.7% and 60%, respectively. Also, the incidence of moderate and severe pain with the VRS tool in the control group was higher in comparison to the intervention group (Table 2). In addition, logistic regression analysis shows that patients in the control group had a higher chance (odds ratio (OR): 3.4, 95% confidence interval (CI): 1.5 - 7.8, P = 0.039) of moderate and severe pain in comparison to the intervention group (Table 2), and this shows the efficacy of local pressure to reduce needle pain in spinal anesthesia.
Table 2.
Compression of Needle Pain Severity in Both Groups a
| Pain Severity | Control Group | Interventional Group | P | OR (95% CI) |
|---|---|---|---|---|
| Mild | 34 (56.6) | 46 (76.7) | 0.039 | 3.4 (1.5 - 7.8) |
| Moderate | 12 (20.0) | 9 (15.0) | ||
| Severe | 14 (23.3) | 5 (8.3) | ||
| Total | 60 (100.0) | 60 (100.0) |
Abbreviations: OR, odds ratio; CI, confidence interval.
a Values are expressed as No. (%) unless otherwise indicated.
Logistic regression analysis showed that patients with certain variables, including gender (being female), marital status (being single), smoking status (being a smoker), presence of underlying diseases, higher education levels, and increasing body mass index, are further prone to moderate and severe pain. However, this finding is not statistically significant. Additionally, patients with certain variables, such as older age, being male, residing in rural areas, having a history of drug abuse, and previous experience with spinal anesthesia, are prone to have a lower chance of experiencing moderate to severe pain. However, only patients with a history of spinal anesthesia have a statistically significant lower chance of experiencing moderate to severe pain (P = 0.028) (Table 3).
Table 3.
The Relationship between the Studied Variables and the Chance of Having Moderate to Severe Pain
| Variables | OR | CI (95 %) | P |
|---|---|---|---|
| Sex | |||
| Male | 1 | - | - |
| Female | 1.08 | 0.49 - 2.35 | 0.843 |
| Marital status | |||
| Married | 1 | - | - |
| Single | 1.58 | 0.69 - 3.60 | 0.269 |
| Smoking | |||
| No | 1 | - | - |
| Yes | 1.14 | 0.71 - 1.82 | 0.570 |
| Underline disease | |||
| No | 1 | - | - |
| Yes | 1.13 | 0.26 - 4.79 | 0.866 |
| Education | |||
| < 5 y | 1 | - | |
| 5 - 12 y | 1.45 | 0.50 - 4.17 | 0.490 |
| > 12 y | 2.30 | 0.82 - 6.58 | 0.109 |
| Resident | |||
| Urban | 1 | - | - |
| Rural | 0.72 | 0.26 - 2.03 | 0.545 |
| Previous spinal anesthesia | |||
| No | 1 | - | - |
| Yes | 0.40 | 0.18 - 0.90 | 0.028 |
| Substance abuse | |||
| No | 1 | - | |
| Yes | 0.90 | 0.51 - 1.59 | 0.729 |
| Age (y) | 0.97 | 0.92 - 1.01 | 0.185 |
| BMI (kg/m2) | 1.01 | 0.88 - 1.14 | 0.874 |
Abbreviations: BMI, body mass index; OR, odds ratio; CI, confidence interval.
5. Discussion
Pain is an unpleasant sensory and emotional experience, and reducing this undesirable experience is one of the patients' rights, whether this pain is due to disease or treatment measures. Indeed, one of the most common methods of anesthesia is spinal anesthesia. In this type of anesthesia, the needle pain in the lower back leads some patients to refuse spinal anesthesia. Also, the needle pain can cause unintentional movement during the procedure and increase the risk of complications. For this reason, an intervention is necessary to reduce the pain and fear of the needle and increase patients' acceptance of spinal anesthesia (19). In patients with spinal anesthesia, various methods for reducing needle pain have been introduced, including pharmacological and non-pharmacological methods. Some of these methods include using transcutaneous electrical nerve stimulation (TENS) (19), subcutaneous infiltration of topical anesthetics (3, 20), a topical anesthetic (21, 22), shot blocker (5), distraction, and Valsalva maneuver (23). Regardless of the success rate of these methods, these procedures are time-consuming, have side effects, are expensive, require device use and patient cooperation, and delay the onset of surgery.
In this study, we utilized about 5 kg of local pressure by the thumb finger for 15 seconds just before inserting the spinal needle into the skin. Based on our review, this is the first study to evaluate the effect of local pressure on the intensity of needle pain in spinal anesthesia. The gate control theory is the scientific basis of our approach.
The findings of this study demonstrate that applying local pressure on the spinal needle entry site can reduce moderate to severe pain in the intervention group. Furthermore, this pressure can significantly reduce needle pain in patients with a spinal anesthesia history (P value: 0.028). Additionally, our method is compatible with other methods, as mentioned above. Additionally, it offers several advantages, including safety, affordability, availability, convenience, and time-saving. The question is: How does applying local pressure reduce needle pain during spinal anesthesia? As mentioned earlier, the mechanism of pain reduction through local pressure is based on the gate control theory of pain (14).
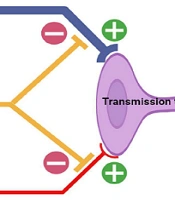
The gate control theory was developed by Braz et al. (as cited by Melzack and Wall) in 1965 and has since been revised (24). According to this theory, massage, which involves applying pressure and touch to the site of pain simultaneously, can alleviate pain. Many people have personally experienced the pleasant effects of this practice (25). Pain-transmitting nerve fibers are generally divided into three categories: A, B, and C. Group A fibers are thick and contain myelin. These fibers are responsible for fast pain and transfer sensations such as pressure and touch (ex., massage) from the environment to the posterior horn of the spinal cord. The unmyelinated C fibers transmit secondary pain to the posterior horn of the spinal cord. According to the gate control theory, the myelinated fibers in the substantia gelatinosa region stimulate interneuron cells. Then, these excited cells prevent the transmission of pain signals through the C fiber to the central nervous system, which could reduce the perception of pain (26, 27). Therefore, when local pressure about five kilograms is applied to the site of entry of the needle for 15 seconds just before puncturing the skin in spinal anesthesia, the thick nerve fibers or myelinated fibers will be stimulated by pressure and send the sensory signal to the posterior horn of the spinal cord, and activate the interneurons cells; In turn, these excited interneurons block C fiber that transfer of the needle pain signal to the upper of the central nervous system (Figure 2).
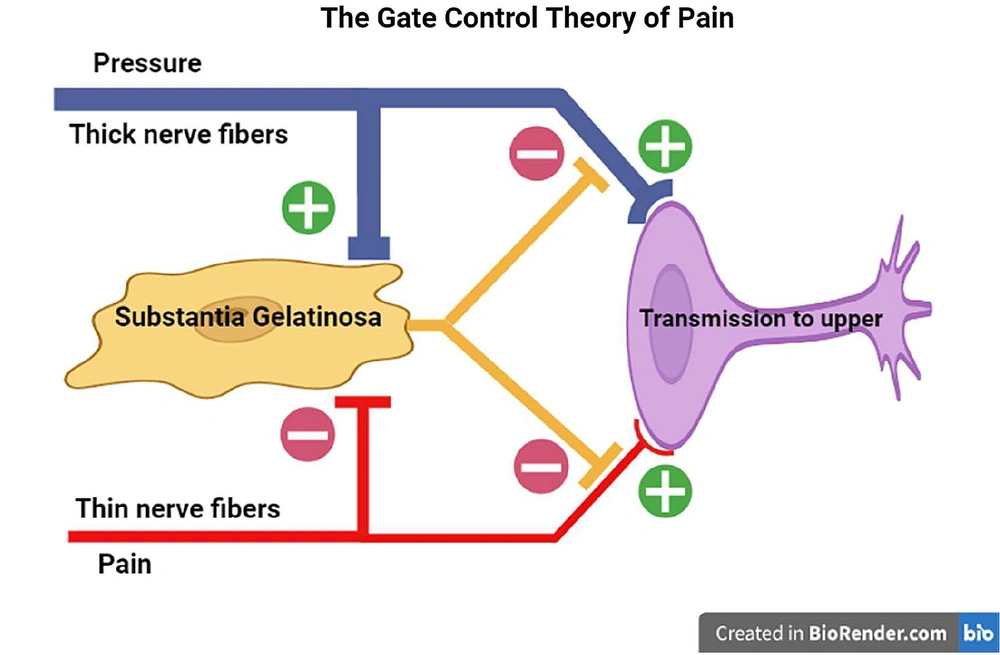
Figure 2.
The gate control theory. We experience this phenomenon daily by applying rubbing or pressure to the injured area to relieve pain.
Today, gate control theory is used to reduce pain; for example, spinal cord stimulation (SCS) is a minimally invasive therapy used to treat chronic neuropathic pain (28). Acupuncture-like TENS (AL-TENS) has been shown to produce prolonged pain relief from chronic low back pain (29). Transcutaneous electrical nerve stimulation is widely used as a non-pharmacological approach for pain relief in the peripheral (PNP) and central neuropathic pain (CNP) (30). Therefore, based on this study, using the gate control theory and applying local pressure can reduce needle pain in spinal anesthesia. As a result, this innovative and simple method may increase the acceptance of spinal anesthesia in patients.
This study did not have any limitations in implementation. However, it was impossible to make comparisons due to the lack of a previous similar study. It is also suggested to conduct further studies with a larger sample size. Additionally, it is important to simultaneously consider variables such as fear and anxiety, as they can affect pain perception (31, 32).
5.1. Conclusions
Intervention based on the gate control theory can be useful for relieving needle-related pain in clinical practice. This study showed that applying about 5 kg of local pressure on the skin just before inserting the spinal needle for 15 seconds can effectively reduce the intensity of needle pain during spinal anesthesia. However, further studies with a larger sample size are needed to confirm the effects of applying local pressure on the skin to reduce needle pain during spinal anesthesia.